
The following table shows current 30-year El Monte mortgage rates. You can use the menus to select other loan durations, alter the loan amount. or change your location.
Housing in New Jersey is expensive, which is probably why the state has a very high rate of foreclosures. Because New York City is nearby, one of the world's most vibrant economies is within driving distance for most Garden State residents, and many are able to commute there daily.
Home prices in the state of New Jersey are consistently above the national average. The median sales price in the Garden State is roughly $275,000 according to New Jersey Realtors, the state's major property association. This figure is a growth of 1.9% from previous figures. The National Association of Realtors estimates the median home value across the country is slightly less than $235,000, making New Jersey about $40,000 more expensive, everything else being equal.
New Jersey's Treasury Department paints a somewhat different picture. The government estimates the average residential sales price in the state to be approximately $390,000. This figure is actually a decrease from previous calculations. The U.S. Census Bureau calculates the median home value in New Jersey to be roughly $316,000. Although somewhat high, this represents a 20% decline from the government's previous survey.
The number of pending sales in the Garden State has been growing at a fast pace, displaying a 12.4% increase. There were over 63,000 pending sales at last count. While pending sales in New Jersey have been increasing, the number of available homes on the market has been declining. New Jersey Realtors estimates a 21% decrease in homes on the market from its previous survey. The trade association counted 39,200 single-family homes for sale, 10,200 condos, and 2,400 adult community units.
RealtyTrac, an organization that monitors foreclosures in the United States, calculates that the Garden State has experienced in increase in home repossessions by roughly 2%. Moreover, the real estate group estimates that New Jersey has the highest foreclosure rate in the country. The state's foreclosure rate is roughly 1 out of every 623 homes, while the national average is 1 out of 1,758.
The real estate website Trulia has a useful heatmap that displays listing prices for U.S. homes as shades of green or red. Dark green represents the country's lowest prices, while dark red is the opposite end of the scale. The southern and middle sections of New Jersey are mostly green. The northeastern quadrant has orange and red mixed with green. The Jersey Shore, which is the eastern border than faces the Atlantic Ocean, is mostly red.
The Garden State had an especially tough time during the Great Recession of 2007, according to the New Jersey Monthly, a local publication. Between 1998 and 2006, homeowners in the state could realize profits from owning and then selling real estate. But that quickly changed when the mortgage crisis showed up.
The monthly magazine stated the property industry was robust before the Recession: “For the last half century, housing in New Jersey has been the most reliable of all personal investments. As in much of the nation, New Jersey experienced a housing construction boom that coincided with the baby boom.” The dean of the Edward J. Bloustein School of Planning and Public Policy at Rutgers University, James W. Hughes, says that the state built a thousand houses a week from 1950 to 1970.
A study conducted by the Center on Wealth and Philanthropy at Boston College found that between the years of 2004 and 2008 wealthy households in New Jersey were leaving for other states, mainly Florida, Pennsylvania and New York. There weren't a corresponding number of wealthy households moving into New Jersey. The main reason cited for the loss of wealth was New Jersey's Tax Policies.
The Great Recession brought major changes to the Garden State. From 2006 to 2007, the issuance of building permits in the state dropped roughly 30%, according to the New Jersey Department of Labor. Some regions saw much higher declines in construction. For instance, building permits in Gloucester County went from 410 in 2005 to just 13 in 2007.
The number of homes sold in the state declined from 92,000 in 2006 to 84,000 in 2007. While inventories increased, prices dropped. The New Jersey Monthly estimates that foreclosures rose 31% from 2006 to 2007. Oddly, foreclosures have actually become a bigger problem in the state post-Recession, with 2017 showing above-average numbers.
Despite the problems the state faced during the housing debacle, the Jersey Shore actually did fairly well. Sales in Spring Lake increased from 2006 to 2007, according to Diane Turton Realtors, a local company. The average price in the town went from $1.1 million to $1.3 million. Obviously, this is an expensive area of the state; but it's an example of how some locations had no difficulty during the economic crisis. Other towns on the Jersey Shore actually saw larger increases.
Otteau Valuation Group, a New Jersey property company, looked over numbers of home listings and sales in the state, both before and after the housing crisis. It found that it took 15.6 months for the typical home to sell during the recession, whereas before it was just 10.6 months. It also determined that luxury homes saw an even bigger time lag, going from 34.6 months to 67.8 months. New Jersey being a recourse state gave wealthy home owners reasons to ride out the recession and let property prices recover before selling.
Market analysts estimate that home values dropped 27% from 2008 to a bottom in the summer of 2012. Since then, values have steadily been improving; but they still have not reached pre-Recession levels. Real estate experts expect a small increase of 1.4% annually going forward, which won't be enough to bring values back to pre-crisis levels for some number of years.
Homownership across the state was at 63.1% in 1998 and peaked in 2005 at 70.1%. Since the housing recession the rate of homeownership has slid to 62.2% in 2016.
South Jersey in general saw less job loss, less housing havoc, and more stability in property values throughout the recession. Though there were losses the dip wasn't nearly as deep, in part because the peak was never as steep. One of the biggest employers in South Jersey is the federal government. There are also many federal jobs in the city of Philadelphia. Governmental jobs tend to be more insulated than private sector jobs from the market impacts of a recession. The Philadelphia suburbs are particularly attractive, with good employment levels, good housing stock, good amenities, a fairly easy commute into Philadelphia, and an easy weekend drive to seashore attractions. Philadelphia amd New York City are an easy drive or train/bus trip away for arts, museums and theater. There's a good mix of contemporary housing stock and charming older South Jersey historic village housing stock.
Through the first 3 quarters of 2020 real estate held up far better than it did during the 2008 housing recession. Central banks and politicians reacted faster and much more aggressively to the COVID-19 crisis than they did to the 2008 recession. Many novel and unconventional policies which began in response to the prior recession were used much more aggressively in this recession. For instance, here are some of the policies which were enacted:
On November 24, 2020 the Federal Housing Finance Agency (FHFA) raised conforming loan limits by 7.42%, reflecting strong annual growth in the nationwide FHFA House Price Index (HPI). 2022 and 2023 saw limit increases of 18.05% and 12.21%, the fastest 2-year growth rates since 1986 & 1987, and inline with the 15.95% growth in 2006. In 2024 and 2025 the limits were increased at more historically normal levels of 5.56% and 5.21%.
| NJ Rank | US Rank | Metropolitan Area | 2016 Pop | 2010 Pop | Change | % △ |
|---|---|---|---|---|---|---|
| 1 | 1 | New York-Newark-Jersey City, NY-NJ-PA Metro Area | 20,153,634 | 19,567,410 | 586,224 | 3.00% |
| 2 | 7 | Philadelphia-Camden-Wilmington, PA-NJ-DE-MD Metro Area | 6,070,500 | 5,965,343 | 105,157 | 1.76% |
| 3 | 69 | Allentown-Bethlehem-Easton, PA-NJ Metro Area | 835,652 | 821,173 | 14,479 | 1.76% |
| 4 | 143 | Trenton | 371,023 | 366,513 | 4,510 | 1.23% |
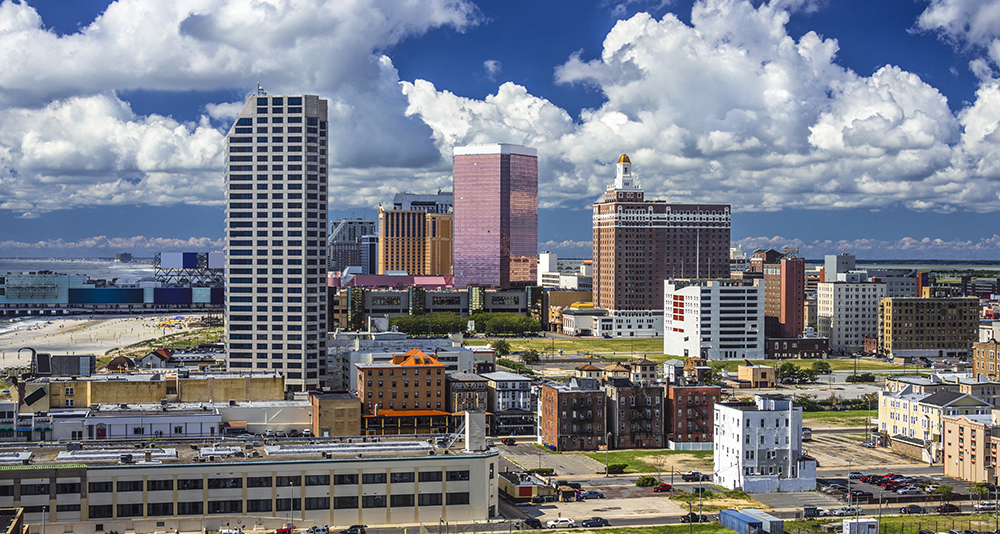
| 5 | 176 | Atlantic City-Hammonton | 270,991 | 274,549 | -3,558 | -1.30% |
| 6 | 270 | Vineland-Bridgeton | 153,797 | 156,898 | -3,101 | -1.98% |
| 7 | 403 | Ocean City | 94,430 | 97,265 | -2,835 | -2.91% |

The biggest city in the Garden State is Newark. Located in the northeast part of the state, Newark is much closer to New York City than Atlantic City, and is part of the NYC metro area. Newark itself has roughly 280,000 residents. Given its location, the city obviously benefits from New York's healthy and vibrant economy, which includes the headquarters of countless corporations. According to the Newark Regional Business Partnership (NRBP), Newark itself is home to almost 10,000 private businesses. These include Panasonic and Verizon.
Newark is the home of the New Jersey Devils NHL team. Both the New York Giants and the New York Jets play at MetLife Stadium, which is located 11 miles north in East Rutherford.
The NRBP also lists the median salary in the city at $42,000. New Jersey Realtors estimates the median sales price of a single-family home in Essex County, where Newark is located, to be roughly $419,000. Thus, we reach a sales price-to-salary ratio of 10.0, which is very high. Property prices are lifted in part due to high incomes in nearby Manhattan.

The fastest growing city in the Garden State is Jersey City, located just 20 minutes east of Newark. This makes Jersey City closer to New York; in fact, it lies right across the Hudson River. It currently has roughly 264,000 people and is growing at roughly 7%, according to the Census Bureau. With a median home value of roughly $392,000 and a median salary of approximately $60,000, we see a home value-to-salary metric of 6.5, lower than Newark, but still high.

To find the state's lowest home prices, you'll have to leave the NYC metro area, stay clear of Jersey Shore, and go inland. Here you will find Trenton, which shares a border with Pennsylvania. The city is the state capital, and the government sector is the heart of the economy.
The median home listing price on a per-square-foot basis in Trenton is $130. This is lower than the national average, which is $139. The U.S. Census Bureau calculates a median household income of roughly $35,000, and the National Association of Realtors provides a median home closing price of $170,000, another low figure. Putting these two numbers together produces a ratio of 4.9, the lowest metric in our survey.

According to the United States Census an estimated 8,944,469 people live in the state of New Jersey. The state has 7,354.22 mi² of land area, which gave it a population density of 1,216.24 per mi². Here is a list of cities, towns, villages & Census Designated Places with more than 10,000 residents, with their estimated population as of June 2016 & the 2010 United States Census. For Census Designated Places (CDP) where there was no population estimate available for 2016, the 2011-2015 American Community Survey 5-Year Estimates data was used.
All table columns are sortable. Click on the column headers to sort by that column. Click again to sort low to high. Cities with higher levels of population growth typically see the increased demand drive faster real estate price appreciation.
| Rank | Geography | County | 2016 Pop | 2010 Pop | Change | % △ | Land mi² | Pop Den mi² | Founded |
|---|---|---|---|---|---|---|---|---|---|
| 1 | Newark | Essex | 281,764 | 277,140 | 4,624 | 1.67% | 24.19 | 11,647.95 | 1693 |
| 2 | Jersey City | Hudson | 264,152 | 247,597 | 16,555 | 6.69% | 14.79 | 17,860.18 | 1838 |
| 3 | Paterson | Passaic | 147,000 | 146,199 | 801 | 0.55% | 8.43 | 17,437.72 | 1831 |
| 4 | Elizabeth | Union | 128,640 | 124,969 | 3,671 | 2.94% | 12.32 | 10,441.56 | 1855 |
| 5 | Edison township | Middlesex | 101,996 | 99,967 | 2,029 | 2.03% | 29.94 | 3,406.68 | 1870 |
| 6 | Woodbridge township | Middlesex | 101,389 | 99,585 | 1,804 | 1.81% | 23.21 | 4,368.33 | 1798 |
| 7 | Lakewood township | Ocean | 100,758 | 92,843 | 7,915 | 8.53% | 24.58 | 4,099.19 | 1892 |
| 8 | Toms River township | Ocean | 91,837 | 91,239 | 598 | 0.66% | 40.49 | 2,268.14 | 1798 |
| Toms River CDP | Ocean | 88,687 | 88,791 | -104 | -0.12% | 38.95 | 2,276.94 | ||
| 9 | Hamilton township | Mercer | 88,400 | 88,464 | -64 | -0.07% | 39.49 | 2,238.54 | 1842 |
| 10 | Clifton | Passaic | 85,845 | 84,136 | 1,709 | 2.03% | 11.26 | 7,623.89 | 1917 |
| 11 | Trenton | Mercer | 84,056 | 84,913 | -857 | -1.01% | 7.65 | 10,987.71 | 1792 |
| 12 | Brick township | Ocean | 75,061 | 75,072 | -11 | -0.01% | 25.72 | 2,918.39 | 1850 |
| 13 | Camden | Camden | 74,420 | 77,344 | -2,924 | -3.78% | 8.92 | 8,343.05 | 1828 |
| 14 | Cherry Hill township | Camden | 71,352 | 71,045 | 307 | 0.43% | 24.1 | 2,960.66 | 1844 |
| 15 | Passaic | Passaic | 70,635 | 69,781 | 854 | 1.22% | 3.15 | 22,423.81 | 1873 |
| 16 | Union City | Hudson | 69,296 | 66,455 | 2,841 | 4.28% | 1.28 | 54,137.50 | 1925 |
| 17 | Old Bridge township | Middlesex | 66,673 | 65,375 | 1,298 | 1.99% | 38.06 | 1,751.79 | 1869 |
| 18 | Franklin township | Somerset | 66,311 | 62,300 | 4,011 | 6.44% | 46.15 | 1,436.86 | 1798 |
| 19 | Bayonne | Hudson | 66,238 | 63,024 | 3,214 | 5.10% | 5.8 | 11,420.34 | 1861 |
| 20 | Middletown township | Monmouth | 65,482 | 66,522 | -1,040 | -1.56% | 40.99 | 1,597.51 | 1798 |
| 21 | East Orange | Essex | 64,789 | 64,270 | 519 | 0.81% | 3.92 | 16,527.81 | 1863 |
| 22 | Gloucester township | Camden | 63,941 | 64,634 | -693 | -1.07% | 22.98 | 2,782.46 | 1798 |
| 23 | North Bergen township | Hudson | 62,886 | 60,773 | 2,113 | 3.48% | 5.13 | 12,258.48 | 1843 |
| 24 | Vineland | Cumberland | 60,525 | 60,724 | -199 | -0.33% | 68.42 | 884.61 | 1952 |
| 25 | Union township | Union | 58,512 | 56,642 | 1,870 | 3.30% | 9.07 | 6,451.16 | 1808 |
| 26 | Piscataway township | Middlesex | 57,602 | 56,044 | 1,558 | 2.78% | 18.83 | 3,059.05 | 1798 |
| 27 | New Brunswick | Middlesex | 56,910 | 55,181 | 1,729 | 3.13% | 5.23 | 10,881.45 | 1784 |
| 28 | Jackson township | Ocean | 56,733 | 54,856 | 1,877 | 3.42% | 99.24 | 571.67 | 1844 |
| 29 | Wayne township | Passaic | 54,690 | 54,717 | -27 | -0.05% | 23.73 | 2,304.68 | 1847 |
| 30 | Irvington township | Essex | 54,425 | 53,926 | 499 | 0.93% | 2.93 | 18,575.09 | 1874 |
| 31 | Hoboken | Hudson | 54,379 | 50,005 | 4,374 | 8.75% | 1.28 | 42,483.59 | 1849 |
| Lakewood CDP | Ocean | 53,591 | 53,805 | -214 | -0.40% | 7.08 | 7,569.35 | ||
| 32 | West New York | Hudson | 53,343 | 49,708 | 3,635 | 7.31% | 1.01 | 52,814.85 | 1898 |
| 33 | Parsippany-Troy Hills township | Morris | 53,258 | 53,238 | 20 | 0.04% | 23.56 | 2,260.53 | 1928 |
| 34 | Perth Amboy | Middlesex | 52,499 | 50,814 | 1,685 | 3.32% | 4.7 | 11,170.00 | 1718 |
| 35 | Howell township | Monmouth | 52,245 | 51,075 | 1,170 | 2.29% | 60.56 | 862.70 | 1801 |
| 36 | Plainfield | Union | 50,636 | 49,808 | 828 | 1.66% | 6.02 | 8,411.30 | 1869 |
| 37 | East Brunswick township | Middlesex | 48,630 | 47,512 | 1,118 | 2.35% | 21.7 | 2,241.01 | 1860 |
| 38 | Bloomfield township | Essex | 48,539 | 47,315 | 1,224 | 2.59% | 5.3 | 9,158.30 | 1812 |
| 39 | Washington township | Gloucester | 48,035 | 48,559 | -524 | -1.08% | 21.38 | 2,246.73 | 1836 |
| 40 | West Orange township | Essex | 47,249 | 46,207 | 1,042 | 2.26% | 12.05 | 3,921.08 | 1863 |
| 41 | South Brunswick township | Middlesex | 45,725 | 43,417 | 2,308 | 5.32% | 40.65 | 1,124.85 | 1798 |
| 42 | Evesham township | Burlington | 45,351 | 45,538 | -187 | -0.41% | 29.28 | 1,548.87 | 1798 |
| 43 | Bridgewater township | Somerset | 44,999 | 44,464 | 535 | 1.20% | 32.04 | 1,404.46 | 1798 |
| 44 | Sayreville borough | Middlesex | 44,905 | 42,704 | 2,201 | 5.15% | 15.84 | 2,834.91 | 1876 |
| 45 | Hackensack | Bergen | 44,756 | 43,010 | 1,746 | 4.06% | 4.18 | 10,707.18 | 1693 |
| 46 | Monroe township | Middlesex | 44,604 | 39,132 | 5,472 | 13.98% | 41.97 | 1,062.76 | 1838 |
| 47 | Manchester township | Ocean | 43,546 | 43,070 | 476 | 1.11% | 81.62 | 533.52 | 1865 |
| 48 | Egg Harbor township | Atlantic | 43,504 | 43,323 | 181 | 0.42% | 66.6 | 653.21 | 1798 |
| 49 | Linden | Union | 42,457 | 40,499 | 1,958 | 4.83% | 10.68 | 3,975.37 | 1925 |
| 50 | North Brunswick township | Middlesex | 42,444 | 40,742 | 1,702 | 4.18% | 12 | 3,537.00 | 1798 |
| 51 | Kearny | Hudson | 42,126 | 40,684 | 1,442 | 3.54% | 8.77 | 4,803.42 | 1867 |
| 52 | Mount Laurel township | Burlington | 41,738 | 41,864 | -126 | -0.30% | 21.69 | 1,924.30 | 1872 |
| 53 | Berkeley township | Ocean | 41,689 | 41,255 | 434 | 1.05% | 42.86 | 972.68 | 1875 |
| 54 | Teaneck township | Bergen | 41,010 | 39,776 | 1,234 | 3.10% | 6.01 | 6,823.63 | 1895 |
| 55 | Marlboro township | Monmouth | 40,330 | 40,191 | 139 | 0.35% | 30.36 | 1,328.39 | 1848 |
| 56 | Manalapan township | Monmouth | 40,018 | 38,872 | 1,146 | 2.95% | 30.61 | 1,307.35 | 1848 |
| 57 | Hillsborough township | Somerset | 39,832 | 38,303 | 1,529 | 3.99% | 54.54 | 730.33 | 1771 |
| 58 | Winslow township | Camden | 39,328 | 39,499 | -171 | -0.43% | 57.34 | 685.87 | 1867 |
| 59 | Atlantic City | Atlantic | 38,735 | 39,558 | -823 | -2.08% | 10.75 | 3,603.26 | 1854 |
| 60 | Montclair township | Essex | 38,700 | 37,669 | 1,031 | 2.74% | 6.31 | 6,133.12 | 1868 |
| 61 | Fort Lee borough | Bergen | 37,577 | 35,345 | 2,232 | 6.31% | 2.54 | 14,794.09 | 1904 |
| 62 | Monroe township | Gloucester | 36,908 | 36,129 | 779 | 2.16% | 46.39 | 795.60 | 1838 |
| 63 | Galloway township | Atlantic | 36,753 | 37,349 | -596 | -1.60% | 89.07 | 412.63 | 1798 |
| 64 | Belleville township | Essex | 36,203 | 35,926 | 277 | 0.77% | 3.34 | 10,839.22 | 1839 |
| 65 | Ewing township | Mercer | 35,982 | 35,790 | 192 | 0.54% | 15.25 | 2,359.48 | 1834 |
| 66 | Pennsauken township | Camden | 35,908 | 35,885 | 23 | 0.06% | 10.44 | 3,439.46 | 1892 |
| 67 | Freehold township | Monmouth | 35,623 | 36,184 | -561 | -1.55% | 38.5 | 925.27 | 1798 |
| 68 | Fair Lawn borough | Bergen | 33,453 | 32,457 | 996 | 3.07% | 5.14 | 6,508.37 | 1924 |
| 69 | Lawrence township | Mercer | 32,897 | 33,472 | -575 | -1.72% | 21.81 | 1,508.34 | 1798 |
| 70 | Garfield | Bergen | 31,876 | 30,487 | 1,389 | 4.56% | 2.1 | 15,179.05 | 1898 |
| 71 | Willingboro township | Burlington | 31,713 | 31,629 | 84 | 0.27% | 7.74 | 4,097.29 | 1798 |
| 72 | Princeton borough | Mercer | 31,249 | 12,307 | 18,942 | 153.91% | 1.84 | 16,983.15 | 1813 |
| 73 | Long Branch | Monmouth | 30,763 | 30,719 | 44 | 0.14% | 5.27 | 5,837.38 | 1867 |
| 74 | Deptford township | Gloucester | 30,613 | 30,561 | 52 | 0.17% | 17.36 | 1,763.42 | 1798 |
| 75 | City of Orange township | Essex | 30,583 | 30,134 | 449 | 1.49% | 2.2 | 13,901.36 | 1806 |
| 76 | Westfield | Union | 30,206 | 30,316 | -110 | -0.36% | 6.72 | 4,494.94 | 1798 |
| 77 | Livingston township | Essex | 29,801 | 29,366 | 435 | 1.48% | 13.77 | 2,164.20 | 1813 |
| 78 | Rahway | Union | 29,451 | 27,346 | 2,105 | 7.70% | 3.9 | 7,551.54 | 1858 |
| 79 | Voorhees township | Camden | 29,396 | 29,131 | 265 | 0.91% | 11.49 | 2,558.40 | 1899 |
| 80 | Mount Olive township | Morris | 29,130 | 28,117 | 1,013 | 3.60% | 29.41 | 990.48 | 1871 |
| 81 | Nutley township | Essex | 28,670 | 28,370 | 300 | 1.06% | 3.38 | 8,482.25 | 1874 |
| 82 | Lacey township | Ocean | 28,569 | 27,644 | 925 | 3.35% | 83.26 | 343.13 | 1871 |
| 83 | Englewood | Bergen | 28,455 | 27,147 | 1,308 | 4.82% | 4.91 | 5,795.32 | 1899 |
| 84 | West Windsor township | Mercer | 28,207 | 27,165 | 1,042 | 3.84% | 25.56 | 1,103.56 | 1798 |
| 85 | Millville | Cumberland | 28,059 | 28,400 | -341 | -1.20% | 42 | 668.07 | 1801 |
| 86 | Neptune township | Monmouth | 27,789 | 27,935 | -146 | -0.52% | 8.18 | 3,397.19 | 1879 |
| 87 | Bergenfield borough | Bergen | 27,647 | 26,764 | 883 | 3.30% | 2.88 | 9,599.65 | 1894 |
| 88 | Pemberton township | Burlington | 27,567 | 27,912 | -345 | -1.24% | 61.28 | 449.85 | 1846 |
| 89 | East Windsor township | Mercer | 27,430 | 27,190 | 240 | 0.88% | 15.65 | 1,752.72 | 1798 |
| 90 | Stafford township | Ocean | 27,153 | 26,535 | 618 | 2.33% | 45.85 | 592.21 | 1798 |
| 91 | Bernards township | Somerset | 26,978 | 26,652 | 326 | 1.22% | 23.93 | 1,127.37 | 1798 |
| 92 | Paramus borough | Bergen | 26,880 | 26,342 | 538 | 2.04% | 10.47 | 2,567.34 | 1922 |
| 93 | Ocean township | Monmouth | 26,729 | 27,291 | -562 | -2.06% | 10.88 | 2,456.71 | 1849 |
| 94 | West Milford township | Passaic | 26,605 | 25,850 | 755 | 2.92% | 75.09 | 354.31 | 1834 |
| 95 | Mahwah township | Bergen | 26,541 | 25,890 | 651 | 2.51% | 25.69 | 1,033.13 | 1849 |
| 96 | Hamilton township | Atlantic | 26,499 | 26,503 | -4 | -0.02% | 111.13 | 238.45 | 1842 |
| 97 | Wall township | Monmouth | 25,987 | 26,164 | -177 | -0.68% | 30.67 | 847.31 | 1851 |
| 98 | Randolph township | Morris | 25,827 | 25,734 | 93 | 0.36% | 20.82 | 1,240.49 | 1806 |
| 99 | Ridgewood village | Bergen | 25,533 | 24,958 | 575 | 2.30% | 5.75 | 4,440.52 | 1894 |
| 100 | Bridgeton | Cumberland | 24,997 | 25,349 | -352 | -1.39% | 6.18 | 4,044.82 | 1865 |
| 101 | Cliffside Park borough | Bergen | 24,856 | 23,594 | 1,262 | 5.35% | 0.96 | 25,891.67 | 1895 |
| 102 | Lodi borough | Bergen | 24,778 | 24,136 | 642 | 2.66% | 2.26 | 10,963.72 | 1894 |
| 103 | Maplewood township | Essex | 24,634 | 23,867 | 767 | 3.21% | 3.88 | 6,348.97 | 1861 |
| 104 | Rockaway township | Morris | 24,554 | 24,156 | 398 | 1.65% | 41.4 | 593.09 | 1844 |
| Somerset CDP | Somerset | 24,409 | 22,083 | 2,326 | 10.53% | 6.33 | 3,856.08 | ||
| 105 | South Plainfield borough | Middlesex | 24,221 | 23,385 | 836 | 3.57% | 8.33 | 2,907.68 | 1926 |
| 106 | Scotch Plains township | Union | 24,186 | 23,510 | 676 | 2.88% | 9.02 | 2,681.37 | 1878 |
| 107 | Cranford township | Union | 24,097 | 22,625 | 1,472 | 6.51% | 4.83 | 4,989.03 | 1871 |
| 108 | Carteret borough | Middlesex | 23,992 | 22,844 | 1,148 | 5.03% | 4.42 | 5,428.05 | 1906 |
| Old Bridge CDP | Middlesex | 23,550 | 23,753 | -203 | -0.85% | 7.1 | 3,316.90 | ||
| 109 | Medford township | Burlington | 23,440 | 23,033 | 407 | 1.77% | 38.92 | 602.26 | 1847 |
| 110 | Plainsboro township | Middlesex | 23,407 | 22,999 | 408 | 1.77% | 11.78 | 1,987.01 | 1919 |
| 111 | Roxbury township | Morris | 23,374 | 23,324 | 50 | 0.21% | 20.83 | 1,122.13 | 1798 |
| 112 | Montgomery township | Somerset | 23,352 | 22,254 | 1,098 | 4.93% | 32.31 | 722.75 | 1798 |
| 113 | Burlington township | Burlington | 22,747 | 22,594 | 153 | 0.68% | 13.42 | 1,695.01 | 1798 |
| 114 | Morris township | Morris | 22,580 | 22,306 | 274 | 1.23% | 15.62 | 1,445.58 | 1798 |
| 115 | Vernon township | Sussex | 22,383 | 23,943 | -1,560 | -6.52% | 68.23 | 328.05 | 1798 |
| 116 | Barnegat township | Ocean | 22,288 | 20,936 | 1,352 | 6.46% | 34.38 | 648.28 | 1846 |
| 117 | Lyndhurst township | Bergen | 22,239 | 20,554 | 1,685 | 8.20% | 4.56 | 4,876.97 | 1852 |
| 118 | North Plainfield borough | Somerset | 22,073 | 21,936 | 137 | 0.62% | 2.79 | 7,911.47 | 1885 |
| 119 | Summit | Union | 22,019 | 21,457 | 562 | 2.62% | 6 | 3,669.83 | 1899 |
| 120 | Lower township | Cape May | 22,007 | 22,866 | -859 | -3.76% | 27.74 | 793.33 | 1798 |
| 121 | Raritan township | Hunterdon | 21,959 | 22,185 | -226 | -1.02% | 37.53 | 585.11 | 1838 |
| 122 | Hillside township | Union | 21,951 | 21,404 | 547 | 2.56% | 2.75 | 7,982.18 | 1913 |
| 123 | Montville township | Morris | 21,700 | 21,528 | 172 | 0.80% | 18.48 | 1,174.24 | 1867 |
| 124 | Roselle borough | Union | 21,625 | 21,085 | 540 | 2.56% | 2.65 | 8,160.38 | 1894 |
| 125 | Jefferson township | Morris | 21,406 | 21,314 | 92 | 0.43% | 39.13 | 547.05 | 1804 |
| 126 | West Deptford township | Gloucester | 21,352 | 21,677 | -325 | -1.50% | 15.41 | 1,385.59 | 1871 |
| 127 | Little Egg Harbor township | Ocean | 20,818 | 20,065 | 753 | 3.75% | 47.37 | 439.48 | 1798 |
| 128 | Palisades Park borough | Bergen | 20,753 | 19,622 | 1,131 | 5.76% | 1.25 | 16,602.40 | 1899 |
| 129 | Moorestown township | Burlington | 20,565 | 20,726 | -161 | -0.78% | 14.69 | 1,399.93 | 1922 |
| 130 | Pleasantville | Atlantic | 20,492 | 20,249 | 243 | 1.20% | 5.69 | 3,601.41 | 1889 |
| 131 | Millburn township | Essex | 20,308 | 20,149 | 159 | 0.79% | 9.32 | 2,178.97 | 1857 |
| 132 | Elmwood Park borough | Bergen | 20,295 | 19,403 | 892 | 4.60% | 2.65 | 7,658.49 | 1916 |
| 133 | Hazlet township | Monmouth | 19,994 | 20,334 | -340 | -1.67% | 5.56 | 3,596.04 | 1848 |
| 134 | Glassboro borough | Gloucester | 19,835 | 18,579 | 1,256 | 6.76% | 9.18 | 2,160.68 | 1878 |
| Woodbridge CDP | Middlesex | 19,822 | 19,265 | 557 | 2.89% | 3.85 | 5,148.57 | ||
| 135 | Secaucus | Hudson | 19,822 | 16,264 | 3,558 | 21.88% | 5.82 | 3,405.84 | 1900 |
| Iselin CDP | Middlesex | 19,146 | 18,695 | 451 | 2.41% | 3.19 | 6,001.88 | ||
| 136 | Morristown | Morris | 19,016 | 18,411 | 605 | 3.29% | 2.93 | 6,490.10 | 1865 |
| 137 | Hawthorne borough | Passaic | 18,941 | 18,791 | 150 | 0.80% | 3.33 | 5,687.99 | 1898 |
| 138 | Sparta township | Sussex | 18,920 | 19,722 | -802 | -4.07% | 36.94 | 512.18 | 1845 |
| 139 | Maple Shade township | Burlington | 18,849 | 19,131 | -282 | -1.47% | 3.82 | 4,934.29 | 1798 |
| Avenel CDP | Middlesex | 18,793 | 17,011 | 1,782 | 10.48% | 3.52 | 5,338.92 | ||
| 140 | Washington township | Morris | 18,695 | 18,533 | 162 | 0.87% | 44.39 | 421.15 | 1836 |
| 141 | Rutherford borough | Bergen | 18,635 | 18,061 | 574 | 3.18% | 2.81 | 6,631.67 | 1881 |
| 142 | Middle township | Cape May | 18,597 | 18,911 | -314 | -1.66% | 70.33 | 264.42 | 1798 |
| 143 | Point Pleasant borough | Ocean | 18,545 | 18,392 | 153 | 0.83% | 3.49 | 5,313.75 | 1920 |
| 144 | Hopewell township | Mercer | 18,523 | 17,304 | 1,219 | 7.04% | 58.03 | 319.20 | 1798 |
| 145 | Aberdeen township | Monmouth | 18,374 | 18,210 | 164 | 0.90% | 5.45 | 3,371.38 | 1857 |
| 146 | Dover | Morris | 18,252 | 18,157 | 95 | 0.52% | 2.68 | 6,810.45 | 1896 |
| 147 | Dumont borough | Bergen | 17,871 | 17,479 | 392 | 2.24% | 1.98 | 9,025.76 | 1894 |
| 148 | Tinton Falls borough | Monmouth | 17,800 | 17,892 | -92 | -0.51% | 15.49 | 1,149.13 | 1950 |
| Colonia CDP | Middlesex | 17,517 | 17,795 | -278 | -1.56% | 3.91 | 4,480.05 | ||
| 149 | Lindenwold borough | Camden | 17,470 | 17,613 | -143 | -0.81% | 3.89 | 4,491.00 | 1929 |
| 150 | Springfield township | Union | 17,447 | 15,817 | 1,630 | 10.31% | 5.17 | 3,374.66 | 1798 |
| 151 | Wyckoff township | Bergen | 17,221 | 16,696 | 525 | 3.14% | 6.55 | 2,629.16 | 1926 |
| 152 | New Milford borough | Bergen | 16,759 | 16,341 | 418 | 2.56% | 2.27 | 7,382.82 | 1922 |
| 153 | Denville township | Morris | 16,735 | 16,635 | 100 | 0.60% | 11.87 | 1,409.86 | 1913 |
| 154 | Delran township | Burlington | 16,656 | 16,896 | -240 | -1.42% | 6.59 | 2,527.47 | 1880 |
| 155 | Holmdel township | Monmouth | 16,604 | 16,773 | -169 | -1.01% | 17.9 | 927.60 | 1857 |
| 156 | Franklin township | Gloucester | 16,568 | 16,820 | -252 | -1.50% | 55.91 | 296.33 | 1798 |
| 157 | Cinnaminson township | Burlington | 16,532 | 15,569 | 963 | 6.19% | 7.5 | 2,204.27 | 1860 |
| 158 | South Orange Village township | Essex | 16,319 | 16,198 | 121 | 0.75% | 2.86 | 5,705.94 | 1869 |
| 159 | South River borough | Middlesex | 16,295 | 16,008 | 287 | 1.79% | 2.77 | 5,882.67 | 1898 |
| 160 | Harrison | Hudson | 16,231 | 13,620 | 2,611 | 19.17% | 1.2 | 13,525.83 | 1840 |
| 161 | Madison borough | Morris | 16,072 | 15,845 | 227 | 1.43% | 4.21 | 3,817.58 | 1889 |
| 162 | Warren township | Somerset | 16,032 | 15,311 | 721 | 4.71% | 19.57 | 819.21 | 1806 |
| Ocean Acres CDP | Ocean | 16,000 | 16,142 | -142 | -0.88% | 5.85 | 2,735.04 | ||
| 163 | Readington township | Hunterdon | 15,875 | 16,126 | -251 | -1.56% | 47.74 | 332.53 | 1798 |
| 164 | North Arlington borough | Bergen | 15,868 | 15,392 | 476 | 3.09% | 2.56 | 6,198.44 | 1896 |
| 165 | Clark township | Union | 15,835 | 14,756 | 1,079 | 7.31% | 4.3 | 3,682.56 | 1864 |
| 166 | Asbury Park | Monmouth | 15,722 | 16,116 | -394 | -2.44% | 1.42 | 11,071.83 | 1874 |
| Williamstown CDP | Gloucester | 15,539 | 15,567 | -28 | -0.18% | 7.42 | 2,094.20 | ||
| 167 | Pequannock township | Morris | 15,425 | 15,540 | -115 | -0.74% | 6.75 | 2,285.19 | 1798 |
| Franklin Park CDP | Somerset | 15,238 | 13,295 | 1,943 | 14.61% | 2.6 | 5,860.77 | ||
| 168 | Weehawken township | Hudson | 15,138 | 12,554 | 2,584 | 20.58% | 0.8 | 18,922.50 | 1859 |
| 169 | Ramsey borough | Bergen | 15,116 | 14,473 | 643 | 4.44% | 5.52 | 2,738.41 | 1908 |
| 170 | Mantua township | Gloucester | 15,099 | 15,217 | -118 | -0.78% | 15.85 | 952.62 | 1853 |
| Fords CDP | Middlesex | 15,085 | 15,187 | -102 | -0.67% | 2.63 | 5,735.74 | ||
| 171 | Tenafly borough | Bergen | 14,846 | 14,488 | 358 | 2.47% | 4.6 | 3,227.39 | 1894 |
| 172 | Branchburg township | Somerset | 14,688 | 14,459 | 229 | 1.58% | 20.04 | 732.93 | 1845 |
| 173 | Hanover township | Morris | 14,686 | 13,712 | 974 | 7.10% | 10.52 | 1,396.01 | 1740 |
| 174 | Haddon township | Camden | 14,676 | 14,707 | -31 | -0.21% | 2.69 | 5,455.76 | 1865 |
| 175 | Phillipsburg | Warren | 14,455 | 14,950 | -495 | -3.31% | 3.19 | 4,531.35 | 1861 |
| 176 | Hammonton | Atlantic | 14,428 | 14,791 | -363 | -2.45% | 40.89 | 352.85 | 1866 |
| 177 | Little Falls township | Passaic | 14,423 | 14,432 | -9 | -0.06% | 2.74 | 5,263.87 | 1868 |
| 178 | Fairview borough | Bergen | 14,421 | 13,835 | 586 | 4.24% | 0.84 | 17,167.86 | 1894 |
| 179 | Hopatcong borough | Sussex | 14,384 | 15,147 | -763 | -5.04% | 10.85 | 1,325.71 | 1898 |
| 180 | Robbinsville township | Mercer | 14,282 | 13,642 | 640 | 4.69% | 20.32 | 702.85 | 1859 |
| Moorestown-Lenola CDP | Burlington | 14,217 | 14,217 | 0 | 0.00% | 7.01 | 2,028.10 | ||
| 181 | Highland Park borough | Middlesex | 14,195 | 13,982 | 213 | 1.52% | 1.81 | 7,842.54 | 1905 |
| Springdale CDP | Camden | 14,145 | 14,518 | -373 | -2.57% | 5.35 | 2,643.93 | ||
| 182 | Saddle Brook township | Bergen | 14,069 | 13,659 | 410 | 3.00% | 2.69 | 5,230.11 | 1716 |
| 183 | Collingswood borough | Camden | 14,010 | 13,926 | 84 | 0.60% | 1.82 | 7,697.80 | 1888 |
| West Freehold CDP | Monmouth | 14,000 | 13,613 | 387 | 2.84% | 5.91 | 2,368.87 | ||
| Bradley Gardens CDP | Somerset | 13,994 | 14,206 | -212 | -1.49% | 4.49 | 3,116.70 | ||
| 184 | Metuchen borough | Middlesex | 13,871 | 13,574 | 297 | 2.19% | 2.76 | 5,025.72 | 1900 |
| Princeton Meadows CDP | Middlesex | 13,839 | 13,834 | 5 | 0.04% | 2.08 | 6,653.37 | ||
| Cherry Hill Mall CDP | Camden | 13,829 | 14,171 | -342 | -2.41% | 3.64 | 3,799.18 | ||
| 185 | Middlesex borough | Middlesex | 13,812 | 13,635 | 177 | 1.30% | 3.52 | 3,923.86 | 1913 |
| 186 | Roselle Park borough | Union | 13,638 | 13,297 | 341 | 2.56% | 1.23 | 11,087.80 | 1901 |
| 187 | Berkeley Heights township | Union | 13,541 | 13,183 | 358 | 2.72% | 6.21 | 2,180.52 | 1809 |
| 188 | Verona township | Essex | 13,519 | 13,332 | 187 | 1.40% | 2.76 | 4,898.19 | 1907 |
| Hamilton Square CDP | Mercer | 13,456 | 12,784 | 672 | 5.26% | 4.34 | 3,100.46 | ||
| Mercerville CDP | Mercer | 13,371 | 13,230 | 141 | 1.07% | 3.69 | 3,623.58 | ||
| 189 | Oakland borough | Bergen | 13,130 | 12,754 | 376 | 2.95% | 8.45 | 1,553.85 | 1902 |
| 190 | Ridgefield Park village | Bergen | 13,059 | 12,729 | 330 | 2.59% | 1.72 | 7,592.44 | 1892 |
| 191 | Harrison township | Gloucester | 12,982 | 12,417 | 565 | 4.55% | 19.14 | 678.27 | 1844 |
| 192 | Clinton township | Hunterdon | 12,854 | 13,478 | -624 | -4.63% | 29.88 | 430.19 | 1841 |
| Short Hills CDP | Essex | 12,831 | 13,165 | -334 | -2.54% | 5.2 | 2,467.50 | ||
| 193 | New Providence borough | Union | 12,758 | 12,171 | 587 | 4.82% | 3.64 | 3,504.95 | 1899 |
| 194 | Pennsville township | Salem | 12,677 | 13,409 | -732 | -5.46% | 21.28 | 595.72 | 1798 |
| 195 | Florence township | Burlington | 12,664 | 12,109 | 555 | 4.58% | 9.78 | 1,294.89 | 1872 |
| 196 | Woodland Park borough | Passaic | 12,645 | 11,819 | 826 | 6.99% | 2.96 | 4,271.96 | 1914 |
| 197 | Cedar Grove township | Essex | 12,592 | 12,411 | 181 | 1.46% | 4.25 | 2,962.82 | 1892 |
| 198 | Ringwood borough | Passaic | 12,399 | 12,228 | 171 | 1.40% | 25.21 | 491.83 | 1918 |
| 199 | Woolwich township | Gloucester | 12,365 | 10,200 | 2,165 | 21.23% | 20.91 | 591.34 | 1798 |
| 200 | Lumberton township | Burlington | 12,325 | 12,559 | -234 | -1.86% | 12.92 | 953.95 | 1860 |
| 201 | Eatontown borough | Monmouth | 12,287 | 12,709 | -422 | -3.32% | 5.83 | 2,107.55 | 1873 |
| 202 | Hasbrouck Heights borough | Bergen | 12,182 | 11,842 | 340 | 2.87% | 1.51 | 8,067.55 | 1894 |
| 203 | Somerville borough | Somerset | 12,165 | 12,098 | 67 | 0.55% | 2.33 | 5,221.03 | 1863 |
| 204 | Red Bank borough | Monmouth | 12,160 | 12,206 | -46 | -0.38% | 1.74 | 6,988.51 | 1870 |
| Holiday City-Berkeley CDP | Ocean | 12,132 | 12,831 | -699 | -5.45% | 5.75 | 2,109.91 | ||
| 205 | Bordentown township | Burlington | 12,095 | 11,367 | 728 | 6.40% | 8.51 | 1,421.27 | 1852 |
| 206 | Edgewater borough | Bergen | 12,044 | 11,513 | 531 | 4.61% | 0.94 | 12,812.77 | 1894 |
| 207 | Upper township | Cape May | 11,976 | 12,373 | -397 | -3.21% | 62.15 | 192.70 | 1798 |
| Martinsville CDP | Somerset | 11,950 | 11,980 | -30 | -0.25% | 12.32 | 969.97 | ||
| 208 | Glen Rock borough | Bergen | 11,946 | 11,601 | 345 | 2.97% | 2.71 | 4,408.12 | 1894 |
| 209 | Freehold borough | Monmouth | 11,891 | 12,052 | -161 | -1.34% | 1.95 | 6,097.95 | 1869 |
| 210 | Florham Park borough | Morris | 11,766 | 11,696 | 70 | 0.60% | 7.29 | 1,613.99 | 1899 |
| 211 | Wanaque borough | Passaic | 11,759 | 11,116 | 643 | 5.78% | 7.99 | 1,471.71 | 1918 |
| Upper Montclair CDP | Essex | 11,753 | 11,565 | 188 | 1.63% | 2.54 | 4,627.17 | ||
| 212 | Wallington borough | Bergen | 11,689 | 11,335 | 354 | 3.12% | 0.98 | 11,927.55 | 1894 |
| 213 | River Edge borough | Bergen | 11,647 | 11,340 | 307 | 2.71% | 1.85 | 6,295.68 | 1894 |
| Pennsville CDP | Salem | 11,623 | 11,888 | -265 | -2.23% | 10.07 | 1,154.22 | ||
| 214 | Guttenberg | Hudson | 11,618 | 11,176 | 442 | 3.95% | 0.2 | 58,090.00 | 1859 |
| 215 | Bellmawr borough | Camden | 11,478 | 11,583 | -105 | -0.91% | 2.98 | 3,851.68 | 1926 |
| 216 | Haddonfield borough | Camden | 11,424 | 11,593 | -169 | -1.46% | 2.82 | 4,051.06 | 1875 |
| 217 | Ridgefield borough | Bergen | 11,357 | 11,032 | 325 | 2.95% | 2.55 | 4,453.73 | 1892 |
| 218 | Ocean City | Cape May | 11,340 | 11,701 | -361 | -3.09% | 6.33 | 1,791.47 | 1884 |
| 219 | Gloucester City | Camden | 11,339 | 11,456 | -117 | -1.02% | 2.32 | 4,887.50 | 1868 |
| Robertsville CDP | Monmouth | 11,334 | 11,297 | 37 | 0.33% | 5.92 | 1,914.53 | ||
| Greentree CDP | Camden | 11,283 | 11,367 | -84 | -0.74% | 4.66 | 2,421.24 | ||
| Echelon CDP | Camden | 11,276 | 10,743 | 533 | 4.96% | 2.81 | 4,012.81 | ||
| 220 | Westwood borough | Bergen | 11,235 | 10,908 | 327 | 3.00% | 2.27 | 4,949.34 | 1894 |
| 221 | East Hanover township | Morris | 11,228 | 11,157 | 71 | 0.64% | 7.89 | 1,423.07 | 1928 |
| 222 | Beachwood borough | Ocean | 11,196 | 11,045 | 151 | 1.37% | 2.85 | 3,928.42 | 1917 |
| 223 | Pompton Lakes borough | Passaic | 11,127 | 11,097 | 30 | 0.27% | 2.91 | 3,823.71 | 1895 |
| 224 | Wantage township | Sussex | 10,998 | 11,358 | -360 | -3.17% | 66.75 | 164.76 | 1798 |
| 225 | West Caldwell township | Essex | 10,928 | 10,759 | 169 | 1.57% | 5.05 | 2,163.96 | 1904 |
| 226 | Little Ferry borough | Bergen | 10,925 | 10,626 | 299 | 2.81% | 1.48 | 7,381.76 | 1894 |
| 227 | Totowa borough | Passaic | 10,904 | 10,804 | 100 | 0.93% | 3.99 | 2,732.83 | 1898 |
| 228 | Franklin Lakes borough | Bergen | 10,852 | 10,590 | 262 | 2.47% | 9.38 | 1,156.93 | 1922 |
| Browns Mills CDP | Burlington | 10,831 | 11,223 | -392 | -3.49% | 5.37 | 2,016.95 | ||
| 229 | Waterford township | Camden | 10,754 | 10,649 | 105 | 0.99% | 36.04 | 298.39 | 1798 |
| 230 | Somers Point | Atlantic | 10,545 | 10,795 | -250 | -2.32% | 4.03 | 2,616.63 | 1886 |
| 231 | Pine Hill borough | Camden | 10,524 | 10,233 | 291 | 2.84% | 3.87 | 2,719.38 | 1929 |
| 232 | Hillsdale borough | Bergen | 10,510 | 10,219 | 291 | 2.85% | 2.95 | 3,562.71 | 1898 |
| 233 | Chatham township | Morris | 10,466 | 10,452 | 14 | 0.13% | 8.98 | 1,165.48 | 1806 |
| 234 | Bound Brook borough | Somerset | 10,455 | 10,402 | 53 | 0.51% | 1.66 | 6,298.19 | 1891 |
| 235 | Millstone township | Monmouth | 10,450 | 10,566 | -116 | -1.10% | 36.59 | 285.60 | 1844 |
| 236 | Lincoln Park borough | Morris | 10,442 | 10,521 | -79 | -0.75% | 6.38 | 1,636.68 | 1922 |
| 237 | Manville borough | Somerset | 10,430 | 10,344 | 86 | 0.83% | 2.36 | 4,419.49 | 1929 |
| Kendall Park CDP | Middlesex | 10,323 | 9,339 | 984 | 10.54% | 3.702 | 2,788.49 | ||
| 238 | Ventnor City | Atlantic | 10,317 | 10,650 | -333 | -3.13% | 1.95 | 5,290.77 | 1903 |
| Marlton CDP | Burlington | 10,271 | 10,133 | 138 | 1.36% | 3.23 | 3,179.88 | ||
| 239 | Southampton township | Burlington | 10,235 | 10,464 | -229 | -2.19% | 43.67 | 234.37 | 1845 |
| 240 | Kinnelon borough | Morris | 10,219 | 10,248 | -29 | -0.28% | 17.99 | 568.04 | 1922 |
| 241 | Waldwick | Bergen | 10,026 | 9,625 | 401 | 4.17% | 2.067 | 4,850.51 | 1919 |
| 242 | Colts Neck township | Monmouth | 9,965 | 10,142 | -177 | -1.75% | 30.73 | 324.28 | 1847 |
| 243 | Woodbury | Gloucester | 9,962 | 10,174 | -212 | -2.08% | 2.01 | 4,956.22 | 1854 |
Annual Estimates of the Resident Population: April 1, 2010 to July 1, 2016
Source: U.S. Census Bureau, Population Division
Release Date: May 2017.

There are many mortgage types available to New Jersey residents. The traditional home loan is the fixed-rate loan that provide an APR that does not change during the course of the mortgage's life. Because these loans are amortized, payments are always the same each month. Fixed-rate loans come in a variety of terms, with the 30-year product being the most common. This mortgage produces the lowest possible monthly payment, although the interest rate is higher than shorter-term loans. Those who can afford the higher monthly payments from 15-year mortgages will build equity much faster.
The home loan companies that offer conforming mortgages typically want 20% down. Private mortgage insurance is required for down payments smaller than this. Additional fees may also be required. Furthermore, you could end up facing a higher interest rate with a small down payment. The best terms are available to borrowers with credit scores above 740 and debt-to-income ratios of less than 40%.
For those who do not have a 20% down payment & do not qualify for government subsidized loans, another way to augment a low down payment is to use a piggyback mortgage where the second mortgage is used as a down payment on the first mortgage to negate PMI requirements.
There are still a few well established community banks in New Jersey that continue to offer mortgage loans and to keep a high percentage of those loans in portfolio.
Adjustable-rate loans can provide lower interest rates than the 30-year mortgage. These loans have a fixed APR for a specified inital term, such as 3, 5, 7, or 10 years, and then the interest can increase once per year.
Interest-only mortgages are also available in the Garden State. These products are similar to the ARM loans, except that for the initial period, only interest is charged. This produces a small monthly payment. The disadvantage of course is that the principal on the loan hasn't been paid during these years, which will produce a larger monthly payment once the initial term is over, principal payment is required & interest rates reset higher. These loans can be structured as balloon loans & are popular among people in finance with high incomes who are looking to write off their mortgage interest payments.
As of 2026 the conforming loan limit across the United States for single-family homes is set to $832,750, with a ceiling of up to 150% that amount in areas where median home values are higher. Dual unit homes have a limit of $1,066,250, triple unit homes have a limit of $1,288,800 & quadruple unit homes have a limit of $1,601,750. Loans which exceed the conventional limits are considered jumbo loans. Jumbo loans typically have a slightly higher rate of interest than conforming mortgages, though spreads vary based on credit market conditions. The New York City metropolitan area is a HERA high-cost area, extending across the following counties.
| County | Metropolitan Area | 1 Unit Limit | 2 Unit Limit | 3 Unit Limit | 4 Unit Limit |
|---|---|---|---|---|---|
| Bergen | New York-Newark-Jersey City, Ny-Nj-Pa | $1,209,750 | $1,548,975 | $1,872,225 | $2,326,875 |
| Essex | New York-Newark-Jersey City, Ny-Nj-Pa | $1,209,750 | $1,548,975 | $1,872,225 | $2,326,875 |
| Hudson | New York-Newark-Jersey City, Ny-Nj-Pa | $1,209,750 | $1,548,975 | $1,872,225 | $2,326,875 |
| Hunterdon | New York-Newark-Jersey City, Ny-Nj-Pa | $1,209,750 | $1,548,975 | $1,872,225 | $2,326,875 |
| Middlesex | New York-Newark-Jersey City, Ny-Nj-Pa | $1,209,750 | $1,548,975 | $1,872,225 | $2,326,875 |
| Monmouth | New York-Newark-Jersey City, Ny-Nj-Pa | $1,209,750 | $1,548,975 | $1,872,225 | $2,326,875 |
| Morris | New York-Newark-Jersey City, Ny-Nj-Pa | $1,209,750 | $1,548,975 | $1,872,225 | $2,326,875 |
| Ocean | New York-Newark-Jersey City, Ny-Nj-Pa | $1,209,750 | $1,548,975 | $1,872,225 | $2,326,875 |
| Passaic | New York-Newark-Jersey City, Ny-Nj-Pa | $1,209,750 | $1,548,975 | $1,872,225 | $2,326,875 |
| Somerset | New York-Newark-Jersey City, Ny-Nj-Pa | $1,209,750 | $1,548,975 | $1,872,225 | $2,326,875 |
| Sussex | New York-Newark-Jersey City, Ny-Nj-Pa | $1,209,750 | $1,548,975 | $1,872,225 | $2,326,875 |
| Union | New York-Newark-Jersey City, Ny-Nj-Pa | $1,209,750 | $1,548,975 | $1,872,225 | $2,326,875 |
| All Others | Rest of the State | $832,750 | $1,066,250 | $1,288,800 | $1,601,750 |
The U.S. government also provides mortgages through two of its agencies: the Federal Housing Administration and the Department of Veterans Affairs. The FHA provides mortgages to applicants who can pay at least 3.5% down and who have a 580 credit score or higher. The agency also provides loans to borrowers with lower scores, although it requires a larger down payment. In either case, insurance premiums are required for mortgages with less than 20% down.
The VA has the best terms in our survey with no down payment requirement and no insurance premiums, either. However, it does charge a funding fee. It varies from 1.25% to 3.3%. Making a down payment will lower this surcharge. To qualify for a VA loan, you must be an eligible veteran of course.
USDA loans can help people with low incomes in rural parts of the state qualify for a subsidized low-interest loan.
The state of New Jersey, in conjunction with federal and local governments, offers a variety of housing assistance programs. These services include the Section 8 Voucher program plus assistance for veterans and disabled persons. A convenient housing assistance phone line, NJ211, is available 24 hours a day. Many housing agencies have offices throughout the state.
New Jersey has a very low risk of tornadoes. Most of the state has a low or very low risk of hail with Bergen & Union counties having a moderate hail risk.
Homeowner's insurance policies typically do not cover flooding. Here are counties across the state which have a risk profile above very low for either flooding or hurricane storm surges.
Home buyers with mortgages in high-risk areas are required to buy flood insurance. Most flood insurance policies are sold by the United States federal government through The National Flood Insurance Program. Under-priced flood insurance in high-risk areas act as a subsidy to wealthy homeowners.
The NFIP does not charge nearly enough to cover the expected costs of its liabilities. The assessments are not sufficient to build any buffer to cover an extraordinary year, such as what occurred with Hurricane Katrina in 2005 or Hurricane Sandy in 2012. Because homeowners don't incur the full cost of building in a flood zone we end up with more houses there than if homeowners incurred the full cost of the flood risk, which exacerbates the government's costs in the next disaster.
Typically, homes built after 2002, when building code regulations tightened, are subject to lower insurance rates than older homes. On the other hand, homes without hurricane straps, with roofs that do not meet current standards for wind, with older plumbing or with outdated electrical systems may be difficult or very expensive to insure.
Homeowners who live in lower risk areas & are not required to purchase flood insurance heavily cross-subsidize homeowners who are in areas where floods are more common.
Most of the state has a very low eathquake risk, but the northeastern portion of New Jersey near to the New York City metro area has a low earthquake risk in the following counties: Bergen, Essex, Hudson, Middlesex, Monmouth, Morris, Passaic, Somerset & Union.
Standard rental and homeowner insurance policies typically do not cover earthquake damage, though they usually cover losses caused by fires which resulted from an earthquake. You can supplement your homeowner's insurance with an earthquake policy.
The risk of wildfires is considered moderate to very high across much of the state. Fire damages from wildfires & other types of fires are typically covered in most homeowner's insurance policies. If you own expensive items you may want to keep an up-to-date household inventory list which lists specific valuables, such as fine art & jewelry. Here is a list of counties across the state with a wildfire risk above very low.
The New Jersey Department of the Treasury reports effective tax rates on residential properties to be between 0.84% and 4.79%. This results in a statewide average of approximately 2.31%, far above the national average of 1.24%. Average homes in the Garden State are valued at $367,036, which is well above the national average. When that is combined with the state having the highest property tax rate, residents pay a lot of property tax – an average of $8,477 per year compared against a national average of $3,313.
During the last property tax survey, residents of Newark paid a general tax rate of 3.44% on assessed value, which resulted in an effective tax rate of 3.06% of fair market value. Hoboken implements a rate of 1.55% against assessed value, which results in 1.29% for an effective tax rate.
Under New Jersey law, sellers aren't required to make any disclosures about a property to potential buyers, although courts have made exceptions from time to time in order to help protect buyers. Thus, the common law does have basic protections in place for buyers. There is a statute that requires a home for sale be fit to live in.
The Garden State uses a judicial foreclosure process, which means mortgage defaults are handled within the court system. The legal proceeding typically begins after missing just three payments, although by law it can start after missing just one payment.
New Jersey is a recourse state. This means that lenders can sue borrowers using a deficiency judgment. Under this legal system, if a home's value doesn't cover the mortgage balance at the time of default, the lender can pursue all assets the homeowner has, including bank accounts and anything else of value. Under a non-recourse system, the lender can only pursue the collateral stated in the loan, which is usually the house only.

The Garden State is still trying to get back on track more than a decade after the Great Recession. It is making slow but consistent progress. New Jersey's very high property tax doesn't help much, contributing to a very high foreclosure rate. Nevertheless, there are many housing programs for people who need assistance, and one of the world's biggest economies is right around the corner.
For more information on the New Jersey property market, check out:
The Federal Reserve has begun lowering interest rates. Lock in today's low rates and save on your loan.
Are you paying too much for your mortgage?
Check your mortgage options with a trusted El Monte lender.
Answer a few questions below and connect with a lender who can help save you money today!