
The following table is sortable & shares the median home price, 2023 property tax amount, and 2023 property tax rate by state. Where rankings are shown a lower number is given a higher rank (for example, Alabama is a low-tax state, with affordable homes, yielding a high rating for both median tax rate and median property tax amount paid).
Various states have exemptions which many people qualify for. Exemptions can lower property appraisal values, which are used to help determine property tax payments. Some common exemptions include:
States may also limit how quickly property taxes can increase. For example, California's Proposition 13 was passed in 1978. It limits property taxes to a maximum of 1% of assessed value plus any popular vote approved assessments, and limits the rate of assessment increases for a particular homeowner to a maximum of 2% a year. If a property changes hands the assessment rate can then reset dramatically higher for properties that have been held by a homeowner for an extended period of time.
| Location | Home | Cost Rank | Property Tax | $ Tax Rank | Tax % | % Rank |
|---|---|---|---|---|---|---|
| Alabama | $274,280 | 14 | $718 | 1 | 0.40% | 2 |
| Alaska | $364,980 | 24 | $3,650 | 38 | 1.04% | 31 |
| Arizona | $444,220 | 36 | $1,786 | 15 | 0.63% | 12 |
| Arkansas | $249,360 | 7 | $977 | 3 | 0.64% | 13 |
| California | $809,860 | 51 | $4,831 | 45 | 0.75% | 19 |
| Colorado | $603,840 | 46 | $2,422 | 23 | 0.55% | 3 |
| Connecticut | $397,980 | 32 | $6,189 | 49 | 1.79% | 47 |
| District of Columbia | $647,600 | 49 | $4,114 | 41 | 0.62% | 11 |
| Delaware | $338,980 | 20 | $1,635 | 12 | 0.61% | 10 |
| Florida | $413,820 | 33 | $2,529 | 26 | 0.91% | 26 |
| Georgia | $368,160 | 25 | $2,160 | 20 | 0.92% | 27 |
| Hawaii | $767,740 | 50 | $2,092 | 19 | 0.32% | 1 |
| Idaho | $474,620 | 40 | $1,995 | 18 | 0.67% | 17 |
| Illinois | $280,600 | 16 | $4,912 | 46 | 2.08% | 50 |
| Indiana | $249,200 | 6 | $1,467 | 9 | 0.84% | 22 |
| Iowa | $228,620 | 1 | $2,724 | 30 | 1.52% | 42 |
| Kansas | $262,160 | 11 | $2,578 | 27 | 1.34% | 37 |
| Kentucky | $254,220 | 10 | $1,456 | 8 | 0.83% | 21 |
| Louisiana | $250,860 | 8 | $1,127 | 4 | 0.56% | 4 |
| Maine | $386,440 | 29 | $2,785 | 32 | 1.24% | 36 |
| Maryland | $415,640 | 34 | $3,777 | 39 | 1.05% | 32 |
| Massachusetts | $609,320 | 47 | $5,536 | 47 | 1.14% | 34 |
| Michigan | $247,660 | 5 | $2,746 | 31 | 1.38% | 38 |
| Minnesota | $341,640 | 21 | $3,087 | 33 | 1.11% | 33 |
| Mississippi | $244,100 | 4 | $1,161 | 5 | 0.67% | 14 |
| Missouri | $251,400 | 9 | $1,810 | 16 | 1.01% | 30 |
| Montana | $518,760 | 43 | $2,498 | 25 | 0.74% | 18 |
| Nebraska | $284,620 | 17 | $3,313 | 35 | 1.63% | 45 |
| Nevada | $446,700 | 37 | $1,889 | 17 | 0.59% | 9 |
| New Hampshire | $470,280 | 38 | $6,209 | 50 | 1.93% | 49 |
| New Jersey | $502,120 | 42 | $8,897 | 51 | 2.23% | 51 |
| New Mexico | $346,600 | 23 | $1,638 | 13 | 0.67% | 16 |
| New York | $523,600 | 44 | $6,180 | 48 | 1.40% | 40 |
| North Carolina | $368,800 | 26 | $1,769 | 14 | 0.82% | 20 |
| North Dakota | $270,640 | 13 | $2,347 | 21 | 0.98% | 29 |
| Ohio | $235,360 | 2 | $2,639 | 29 | 1.59% | 43 |
| Oklahoma | $238,600 | 3 | $1,501 | 10 | 0.89% | 25 |
| Oregon | $501,560 | 41 | $3,646 | 37 | 0.93% | 28 |
| Pennsylvania | $277,560 | 15 | $3,094 | 34 | 1.49% | 41 |
| Rhode Island | $471,100 | 39 | $4,726 | 43 | 1.40% | 39 |
| South Carolina | $375,680 | 27 | $1,185 | 6 | 0.57% | 7 |
| South Dakota | $318,700 | 19 | $2,481 | 24 | 1.17% | 35 |
| Tennessee | $378,520 | 28 | $1,376 | 7 | 0.67% | 15 |
| Texas | $345,260 | 22 | $4,050 | 40 | 1.68% | 46 |
| Utah | $541,440 | 45 | $2,376 | 22 | 0.57% | 8 |
| Vermont | $397,700 | 31 | $4,787 | 44 | 1.83% | 48 |
| Virginia | $434,700 | 35 | $2,617 | 28 | 0.87% | 23 |
| Washington | $631,060 | 48 | $4,283 | 42 | 0.87% | 24 |
| West Virginia | $268,580 | 12 | $821 | 2 | 0.57% | 6 |
| Wisconsin | $299,880 | 18 | $3,497 | 36 | 1.61% | 44 |
| Wyoming | $396,360 | 30 | $1,609 | 11 | 0.56% | 5 |
The following property taxes table shares national & state-level data from the 2022 American Community Survey's 5-year estimates of Financial Characteristics for Housing Units With a Mortgage. It shows median home price, median property tax, median tax percent, median household income, along with annual property taxes cost bucket ranges for homes in each state.
| Location | Home | Cost Rank | Property Tax | $ Tax Rank | Tax % | % Rank | Income | Monthly House Cost | House Cost % | Homes w Mortgages | $0 prop tax | % | $1 to $800 | % | $800 to $1,499 | % | $1,500+ | % |
|---|---|---|---|---|---|---|---|---|---|---|---|---|---|---|---|---|---|---|
| United States | $311,300 | $3,201 | 1.03% | $110,515 | $1,828 | 19.85% | 50,148,459 | 1,423,512 | 2.8% | 4,068,964 | 8.1% | 6,708,120 | 13.4% | 37,947,863 | 75.7% | |||
| Alabama | $203,300 | 10 | $808 | 2 | 0.40% | 2 | $92,184 | $1,343 | 17.48% | 740,157 | 83,723 | 11.3% | 325,476 | 44.0% | 184,848 | 25.0% | 146,110 | 19.7% |
| Alaska | $341,700 | 35 | $4,004 | 40 | 1.17% | 37 | $120,033 | $2,130 | 21.29% | 106,808 | 9,738 | 9.1% | 4,181 | 3.9% | 6,630 | 6.2% | 86,259 | 80.8% |
| Arizona | $346,500 | 37 | $1,859 | 15 | 0.54% | 6 | $102,250 | $1,665 | 19.54% | 1,140,854 | 34,509 | 3.0% | 130,605 | 11.4% | 294,641 | 25.8% | 681,099 | 59.7% |
| Arkansas | $181,600 | 4 | $1,134 | 4 | 0.62% | 16 | $86,985 | $1,240 | 17.11% | 415,881 | 22,758 | 5.5% | 141,068 | 33.9% | 114,553 | 27.5% | 137,502 | 33.1% |
| California | $679,200 | 50 | $5,304 | 46 | 0.78% | 23 | $136,094 | $2,759 | 24.33% | 5,067,173 | 87,083 | 1.7% | 126,028 | 2.5% | 280,949 | 5.5% | 4,573,113 | 90.2% |
| Colorado | $476,300 | 47 | $2,378 | 22 | 0.50% | 3 | $121,231 | $2,109 | 20.88% | 1,057,739 | 19,466 | 1.8% | 81,234 | 7.7% | 190,104 | 18.0% | 766,935 | 72.5% |
| Connecticut | $329,100 | 33 | $6,582 | 49 | 2.00% | 50 | $131,540 | $2,326 | 21.22% | 618,022 | 6,247 | 1.0% | 7,686 | 1.2% | 9,541 | 1.5% | 594,548 | 96.2% |
| Delaware | $314,100 | 31 | $1,798 | 13 | 0.57% | 11 | $106,744 | $1,729 | 19.44% | 180,097 | 5,008 | 2.8% | 22,882 | 12.7% | 47,552 | 26.4% | 104,655 | 58.1% |
| District of Columbia | $705,200 | 51 | $4,089 | 41 | 0.58% | 14 | $178,717 | $2,958 | 19.86% | 99,112 | 1,909 | 1.9% | 5,092 | 5.1% | 8,814 | 8.9% | 83,297 | 84.0% |
| Florida | $314,800 | 32 | $2,616 | 26 | 0.83% | 24 | $96,121 | $1,752 | 21.87% | 3,166,465 | 98,224 | 3.1% | 287,757 | 9.1% | 523,296 | 16.5% | 2,257,188 | 71.3% |
| Georgia | $269,600 | 26 | $2,394 | 23 | 0.89% | 28 | $104,715 | $1,640 | 18.79% | 1,647,031 | 41,018 | 2.5% | 170,220 | 10.3% | 290,613 | 17.6% | 1,145,180 | 69.5% |
| Hawaii | $773,600 | 52 | $2,079 | 20 | 0.27% | 1 | $130,811 | $2,778 | 25.48% | 191,577 | 10,618 | 5.5% | 25,858 | 13.5% | 36,995 | 19.3% | 118,106 | 61.6% |
| Idaho | $347,900 | 38 | $1,930 | 17 | 0.55% | 9 | $93,096 | $1,520 | 19.59% | 309,472 | 8,375 | 2.7% | 24,703 | 8.0% | 78,031 | 25.2% | 198,363 | 64.1% |
| Illinois | $256,300 | 22 | $5,591 | 47 | 2.18% | 51 | $113,647 | $1,903 | 20.09% | 2,054,273 | 35,825 | 1.7% | 66,617 | 3.2% | 109,875 | 5.3% | 1,841,956 | 89.7% |
| Indiana | $194,800 | 7 | $1,480 | 9 | 0.76% | 18 | $93,904 | $1,301 | 16.63% | 1,202,896 | 30,029 | 2.5% | 266,739 | 22.2% | 329,007 | 27.4% | 577,121 | 48.0% |
| Iowa | $194,000 | 6 | $2,875 | 31 | 1.48% | 43 | $99,833 | $1,444 | 17.36% | 552,272 | 10,432 | 1.9% | 29,749 | 5.4% | 77,464 | 14.0% | 434,627 | 78.7% |
| Kansas | $212,300 | 11 | $2,742 | 28 | 1.29% | 38 | $103,083 | $1,580 | 18.39% | 445,348 | 7,867 | 1.8% | 24,970 | 5.6% | 65,119 | 14.6% | 347,392 | 78.0% |
| Kentucky | $198,000 | 9 | $1,651 | 11 | 0.83% | 25 | $92,078 | $1,344 | 17.52% | 685,954 | 22,769 | 3.3% | 114,778 | 16.7% | 185,003 | 27.0% | 363,404 | 53.0% |
| Louisiana | $225,300 | 15 | $1,332 | 6 | 0.59% | 15 | $96,292 | $1,481 | 18.46% | 619,438 | 79,050 | 12.8% | 169,998 | 27.4% | 131,121 | 21.2% | 239,269 | 38.6% |
| Maine | $259,300 | 25 | $2,996 | 33 | 1.16% | 36 | $97,930 | $1,589 | 19.47% | 254,699 | 2,106 | 0.8% | 10,680 | 4.2% | 28,717 | 11.3% | 213,196 | 83.7% |
| Maryland | $389,700 | 42 | $3,964 | 39 | 1.02% | 32 | $135,723 | $2,245 | 19.85% | 1,122,350 | 25,021 | 2.2% | 27,599 | 2.5% | 59,442 | 5.3% | 1,010,288 | 90.0% |
| Massachusetts | $491,400 | 49 | $5,602 | 48 | 1.14% | 35 | $143,688 | $2,553 | 21.32% | 1,152,808 | 14,875 | 1.3% | 19,195 | 1.7% | 36,307 | 3.1% | 1,082,431 | 93.9% |
| Michigan | $220,200 | 13 | $2,894 | 32 | 1.31% | 39 | $98,101 | $1,472 | 18.01% | 1,713,680 | 60,944 | 3.6% | 69,444 | 4.1% | 222,020 | 13.0% | 1,361,272 | 79.4% |
| Minnesota | $298,700 | 30 | $3,115 | 34 | 1.04% | 33 | $116,495 | $1,818 | 18.73% | 1,060,861 | 16,204 | 1.5% | 51,223 | 4.8% | 113,691 | 10.7% | 879,743 | 82.9% |
| Mississippi | $180,800 | 3 | $1,388 | 7 | 0.77% | 21 | $84,327 | $1,311 | 18.66% | 387,280 | 52,521 | 13.6% | 81,511 | 21.0% | 102,516 | 26.5% | 150,732 | 38.9% |
| Missouri | $214,400 | 12 | $1,966 | 19 | 0.92% | 29 | $96,993 | $1,436 | 17.77% | 1,011,923 | 18,508 | 1.8% | 134,983 | 13.3% | 234,848 | 23.2% | 623,584 | 61.6% |
| Montana | $335,700 | 34 | $2,564 | 24 | 0.76% | 19 | $95,149 | $1,660 | 20.94% | 168,923 | 3,513 | 2.1% | 9,767 | 5.8% | 23,296 | 13.8% | 132,347 | 78.3% |
| Nebraska | $222,200 | 14 | $3,476 | 35 | 1.56% | 44 | $106,751 | $1,612 | 18.12% | 304,599 | 7,797 | 2.6% | 11,411 | 3.7% | 28,325 | 9.3% | 257,066 | 84.4% |
| Nevada | $384,200 | 41 | $1,937 | 18 | 0.50% | 4 | $101,618 | $1,791 | 21.15% | 454,707 | 14,893 | 3.3% | 52,041 | 11.4% | 106,769 | 23.5% | 281,004 | 61.8% |
| New Hampshire | $350,900 | 39 | $6,591 | 50 | 1.88% | 49 | $126,962 | $2,226 | 21.04% | 250,376 | 2,023 | 0.8% | 3,312 | 1.3% | 4,453 | 1.8% | 240,588 | 96.1% |
| New Jersey | $413,900 | 44 | $9,507 | 52 | 2.30% | 52 | $143,426 | $2,728 | 22.82% | 1,421,409 | 24,098 | 1.7% | 12,216 | 0.9% | 11,350 | 0.8% | 1,373,745 | 96.6% |
| New Mexico | $238,700 | 16 | $1,856 | 14 | 0.78% | 22 | $87,653 | $1,457 | 19.95% | 293,870 | 15,296 | 5.2% | 42,543 | 14.5% | 67,275 | 22.9% | 168,756 | 57.4% |
| New York | $410,100 | 43 | $6,661 | 51 | 1.62% | 46 | $127,503 | $2,441 | 22.97% | 2,432,174 | 111,641 | 4.6% | 53,458 | 2.2% | 92,224 | 3.8% | 2,174,851 | 89.4% |
| North Carolina | $259,000 | 24 | $1,908 | 16 | 0.74% | 17 | $98,222 | $1,496 | 18.28% | 1,690,466 | 27,951 | 1.7% | 187,475 | 11.1% | 432,330 | 25.6% | 1,042,710 | 61.7% |
| North Dakota | $256,700 | 23 | $2,584 | 25 | 1.01% | 31 | $111,003 | $1,653 | 17.87% | 106,287 | 2,921 | 2.7% | 8,828 | 8.3% | 14,994 | 14.1% | 79,544 | 74.8% |
| Ohio | $197,200 | 8 | $2,818 | 30 | 1.43% | 41 | $98,947 | $1,429 | 17.33% | 1,973,077 | 35,875 | 1.8% | 123,338 | 6.3% | 309,111 | 15.7% | 1,504,753 | 76.3% |
| Oklahoma | $190,200 | 5 | $1,762 | 12 | 0.93% | 30 | $93,780 | $1,416 | 18.12% | 543,408 | 26,688 | 4.9% | 91,664 | 16.9% | 126,142 | 23.2% | 298,914 | 55.0% |
| Oregon | $437,900 | 46 | $3,747 | 37 | 0.86% | 26 | $111,489 | $1,984 | 21.35% | 697,213 | 10,003 | 1.4% | 17,243 | 2.5% | 45,327 | 6.5% | 624,640 | 89.6% |
| Pennsylvania | $244,800 | 20 | $3,539 | 36 | 1.45% | 42 | $108,181 | $1,671 | 18.54% | 2,123,566 | 30,370 | 1.4% | 123,869 | 5.8% | 251,821 | 11.9% | 1,717,506 | 80.9% |
| Rhode Island | $344,900 | 36 | $4,819 | 43 | 1.40% | 40 | $118,980 | $2,110 | 21.28% | 182,924 | 2,053 | 1.1% | 3,251 | 1.8% | 5,491 | 3.0% | 172,129 | 94.1% |
| South Carolina | $243,700 | 19 | $1,317 | 5 | 0.54% | 8 | $92,428 | $1,423 | 18.47% | 830,217 | 25,262 | 3.0% | 198,538 | 23.9% | 275,161 | 33.1% | 331,256 | 39.9% |
| South Dakota | $240,300 | 17 | $2,693 | 27 | 1.12% | 34 | $99,338 | $1,557 | 18.81% | 131,828 | 2,704 | 2.1% | 6,865 | 5.2% | 18,410 | 14.0% | 103,849 | 78.8% |
| Tennessee | $252,700 | 21 | $1,462 | 8 | 0.58% | 13 | $94,174 | $1,449 | 18.46% | 1,064,620 | 31,770 | 3.0% | 210,541 | 19.8% | 323,346 | 30.4% | 498,963 | 46.9% |
| Texas | $271,700 | 27 | $4,877 | 44 | 1.79% | 48 | $113,935 | $1,913 | 20.15% | 3,699,516 | 144,435 | 3.9% | 174,675 | 4.7% | 246,932 | 6.7% | 3,133,474 | 84.7% |
| Utah | $416,200 | 45 | $2,247 | 21 | 0.54% | 7 | $113,097 | $1,830 | 19.42% | 523,663 | 12,121 | 2.3% | 19,765 | 3.8% | 88,534 | 16.9% | 403,243 | 77.0% |
| Vermont | $282,700 | 28 | $5,000 | 45 | 1.77% | 47 | $104,906 | $1,822 | 20.84% | 118,114 | 1,102 | 0.9% | 1,604 | 1.4% | 3,428 | 2.9% | 111,980 | 94.8% |
| Virginia | $367,000 | 40 | $2,812 | 29 | 0.77% | 20 | $124,028 | $2,014 | 19.49% | 1,489,688 | 42,018 | 2.8% | 132,703 | 8.9% | 225,704 | 15.2% | 1,089,263 | 73.1% |
| Washington | $490,200 | 48 | $4,266 | 42 | 0.87% | 27 | $126,200 | $2,249 | 21.39% | 1,277,064 | 25,488 | 2.0% | 42,771 | 3.3% | 74,139 | 5.8% | 1,134,666 | 88.8% |
| West Virginia | $174,400 | 2 | $989 | 3 | 0.57% | 10 | $86,352 | $1,180 | 16.40% | 248,040 | 7,359 | 3.0% | 92,368 | 37.2% | 86,159 | 34.7% | 62,154 | 25.1% |
| Wisconsin | $240,600 | 18 | $3,777 | 38 | 1.57% | 45 | $103,471 | $1,602 | 18.58% | 1,020,853 | 9,039 | 0.9% | 18,394 | 1.8% | 53,825 | 5.3% | 939,595 | 92.0% |
| Wyoming | $283,600 | 29 | $1,640 | 10 | 0.58% | 12 | $102,866 | $1,642 | 19.16% | 97,687 | 2,265 | 2.3% | 10,048 | 10.3% | 31,877 | 32.6% | 53,497 | 54.8% |
| Puerto Rico | $144,300 | 1 | $764 | 1 | 0.53% | 5 | $45,067 | $935 | 24.90% | 311,663 | 252,402 | 81.0% | 30,642 | 9.8% | 14,936 | 4.8% | 13,683 | 4.4% |
The following table highlights the counties with the highest median home prices.
| County | Home price | Monthly Home Cost | Property Tax | Income |
|---|---|---|---|---|
| San Mateo County, California | $1,474,100 | $4,000+ | $9,885 | $214,962 |
| San Francisco County, California | $1,409,500 | $4,000+ | $10,000+ | $222,823 |
| Marin County, California | $1,365,400 | $4,000+ | $10,000+ | $213,728 |
| Santa Clara County, California | $1,342,600 | $4,000+ | $10,000+ | $224,845 |
| Nantucket County, Massachusetts | $1,230,200 | $3,780 | $3,471 | $147,500 |
| New York County, New York | $1,157,900 | $4,000+ | $10,000+ | $248,422 |
| Alameda County, California | $1,029,700 | $3,547 | $8,572 | $190,075 |
| Santa Cruz County, California | $998,400 | $3,350 | $6,859 | $163,101 |
| Teton County, Wyoming | $975,100 | $2,597 | $4,390 | $131,306 |
| Dukes County, Massachusetts | $965,900 | $3,180 | $4,301 | $114,643 |
| Summit County, Utah | $896,100 | $2,641 | $2,964 | $148,584 |
| Kings County, New York | $889,000 | $3,359 | $5,681 | $138,695 |
| Orange County, California | $881,800 | $3,216 | $6,458 | $160,203 |
| Arlington County, Virginia | $839,800 | $3,426 | $7,308 | $214,131 |
| Honolulu County, Hawaii | $829,800 | $2,969 | $2,346 | $140,545 |
| Napa County, California | $819,800 | $3,108 | $6,480 | $147,336 |
| Contra Costa County, California | $804,800 | $3,216 | $7,280 | $163,513 |
| Maui County, Hawaii | $802,300 | $2,730 | $1,419 | $124,763 |
| King County, Washington | $773,900 | $2,999 | $6,439 | $172,276 |
| Sonoma County, California | $756,900 | $2,915 | $5,790 | $141,144 |
| San Diego County, California | $741,500 | $2,993 | $5,807 | $144,355 |
| Los Angeles County, California | $741,200 | $2,945 | $5,771 | $133,242 |
| Kauai County, Hawaii | $741,100 | $2,641 | $1,737 | $115,153 |
| Ventura County, California | $738,700 | $2,940 | $5,694 | $141,661 |
| Summit County, Colorado | $736,100 | $2,288 | $2,338 | $121,766 |
In 2022 the median homeowner in the following 16 counties all pay over $10,000 a year in property taxes.
There were over 40 counties with median property taxes above $7,000 a year in 2022.
| County | Home Value | Income | Monthly Housing Cost | Property tax |
|---|---|---|---|---|
| San Francisco County, California | $1,409,500 | $222,823 | 4,000+ | 10,000+ |
| Marin County, California | $1,365,400 | $213,728 | 4,000+ | 10,000+ |
| Santa Clara County, California | $1,342,600 | $224,845 | 4,000+ | 10,000+ |
| New York County, New York | $1,157,900 | $248,422 | 4,000+ | 10,000+ |
| Westchester County, New York | $643,700 | $185,226 | $3,834 | 10,000+ |
| Nassau County, New York | $642,300 | $176,417 | $3,663 | 10,000+ |
| Bergen County, New Jersey | $581,000 | $174,354 | $3,386 | 10,000+ |
| Morris County, New Jersey | $545,100 | $175,826 | $3,210 | 10,000+ |
| Rockland County, New York | $541,900 | $157,657 | $3,464 | 10,000+ |
| Somerset County, New Jersey | $493,800 | $177,884 | $3,063 | 10,000+ |
| Hunterdon County, New Jersey | $493,500 | $172,555 | $3,038 | 10,000+ |
| Suffolk County, New York | $491,800 | $152,714 | $3,155 | 10,000+ |
| Essex County, New Jersey | $469,900 | $149,204 | $3,148 | 10,000+ |
| Union County, New Jersey | $463,200 | $155,305 | $3,053 | 10,000+ |
| Putnam County, New York | $429,200 | $144,813 | $2,988 | 10,000+ |
| Passaic County, New Jersey | $415,400 | $140,018 | $2,898 | 10,000+ |
| Monmouth County, New Jersey | $530,900 | $163,531 | $2,976 | $9,887 |
| San Mateo County, California | $1,474,100 | $214,962 | 4,000+ | $9,885 |
| Middlesex County, New Jersey | $423,500 | $147,145 | $2,775 | $9,528 |
| Hudson County, New Jersey | $521,800 | $153,427 | $3,140 | $9,421 |
| Lake County, Illinois | $326,900 | $142,710 | $2,403 | $9,017 |
| Orange County, New York | $349,300 | $128,771 | $2,590 | $8,705 |
| Mercer County, New Jersey | $340,700 | $137,598 | $2,519 | $8,687 |
| Alameda County, California | $1,029,700 | $190,075 | $3,547 | $8,572 |
| Sussex County, New Jersey | $327,000 | $131,397 | $2,380 | $8,486 |
| Warren County, New Jersey | $315,100 | $124,718 | $2,271 | $8,257 |
| Gloucester County, New Jersey | $277,900 | $132,139 | $2,262 | $8,081 |
| Burlington County, New Jersey | $313,500 | $133,511 | $2,326 | $8,001 |
| Camden County, New Jersey | $245,500 | $120,117 | $2,125 | $7,960 |
| DuPage County, Illinois | $367,000 | $141,629 | $2,365 | $7,817 |
| Kendall County, Illinois | $291,700 | $118,488 | $2,188 | $7,602 |
| Collin County, Texas | $420,900 | $154,649 | $2,600 | $7,575 |
| Travis County, Texas | $452,200 | $146,085 | $2,425 | $7,489 |
| Kane County, Illinois | $297,800 | $126,461 | $2,143 | $7,485 |
| Dutchess County, New York | $361,600 | $137,058 | $2,508 | $7,444 |
| Rockingham County, New Hampshire | $434,700 | $144,763 | $2,487 | $7,433 |
| Arlington County, Virginia | $839,800 | $214,131 | $3,426 | $7,308 |
| Contra Costa County, California | $804,800 | $163,513 | $3,216 | $7,280 |
| McHenry County, Illinois | $274,900 | $123,344 | $2,035 | $7,277 |
| Fort Bend County, Texas | $338,500 | $139,634 | $2,430 | $7,230 |
| Williamson County, Texas | $377,800 | $134,613 | $2,258 | $7,157 |
| Will County, Illinois | $290,600 | $125,876 | $2,155 | $7,082 |
| Middlesex County, Massachusetts | $661,600 | $176,444 | $3,019 | $7,049 |
| Denton County, Texas | $386,300 | $146,199 | $2,438 | $7,033 |
The following table shows the median home value, household income, monthly housing costs, and annual property taxes by state across the United States. Data is sourced from the 2021 American Community Survey's 5-year estimates of Financial Characteristics for Housing Units With a Mortgage.
| State | Household Income | Monthly Home Cost | Housing Cost % | Home Value | Property Tax | Property Tax % |
|---|---|---|---|---|---|---|
| United States | $102,003 | $1,697 | 19.96% | $268,800 | $2,971 | 1.11% |
| Alabama | $84,630 | $1,242 | 17.61% | $172,300 | $742 | 0.43% |
| Alaska | $113,259 | $1,986 | 21.04% | $300,100 | $3,716 | 1.24% |
| Arizona | $93,406 | $1,545 | 19.85% | $283,900 | $1,717 | 0.60% |
| Arkansas | $80,161 | $1,154 | 17.28% | $157,300 | $1,031 | 0.66% |
| California | $124,759 | $2,548 | 24.51% | $591,300 | $4,804 | 0.81% |
| Colorado | $111,311 | $1,927 | 20.77% | $407,100 | $2,125 | 0.52% |
| Connecticut | $122,066 | $2,192 | 21.55% | $289,600 | $6,251 | 2.16% |
| Delaware | $97,991 | $1,644 | 20.13% | $274,800 | $1,694 | 0.62% |
| District of Columbia | $162,917 | $2,751 | 20.26% | $636,600 | $3,754 | 0.59% |
| Florida | $87,788 | $1,618 | 22.12% | $266,100 | $2,372 | 0.89% |
| Georgia | $95,994 | $1,514 | 18.93% | $226,600 | $2,151 | 0.95% |
| Hawaii | $122,258 | $2,587 | 25.39% | $669,200 | $1,915 | 0.29% |
| Idaho | $84,542 | $1,395 | 19.80% | $277,400 | $1,741 | 0.63% |
| Illinois | $105,528 | $1,781 | 20.25% | $227,700 | $5,213 | 2.29% |
| Indiana | $86,702 | $1,206 | 16.69% | $165,900 | $1,373 | 0.83% |
| Iowa | $92,540 | $1,348 | 17.48% | $169,600 | $2,700 | 1.59% |
| Kansas | $95,641 | $1,467 | 18.41% | $182,000 | $2,556 | 1.40% |
| Kentucky | $85,017 | $1,241 | 17.52% | $169,600 | $1,508 | 0.89% |
| Louisiana | $89,298 | $1,376 | 18.49% | $196,000 | $1,223 | 0.62% |
| Maine | $90,235 | $1,471 | 19.56% | $223,100 | $2,868 | 1.29% |
| Maryland | $125,998 | $2,111 | 20.11% | $346,500 | $3,709 | 1.07% |
| Massachusetts | $132,795 | $2,365 | 21.37% | $431,100 | $5,113 | 1.19% |
| Michigan | $91,004 | $1,374 | 18.12% | $188,300 | $2,734 | 1.45% |
| Minnesota | $107,302 | $1,682 | 18.81% | $260,500 | $2,860 | 1.10% |
| Mississippi | $79,124 | $1,218 | 18.47% | $159,200 | $1,289 | 0.81% |
| Missouri | $89,803 | $1,343 | 17.95% | $183,900 | $1,830 | 1.00% |
| Montana | $87,424 | $1,538 | 21.11% | $282,200 | $2,339 | 0.83% |
| Nebraska | $98,099 | $1,483 | 18.14% | $187,700 | $3,184 | 1.70% |
| Nevada | $93,669 | $1,655 | 21.20% | $325,300 | $1,793 | 0.55% |
| New Hampshire | $116,764 | $2,062 | 21.19% | $297,900 | $6,235 | 2.09% |
| New Jersey | $132,635 | $2,560 | 23.16% | $363,400 | $8,928 | 2.46% |
| New Mexico | $80,767 | $1,359 | 20.19% | $204,400 | $1,721 | 0.84% |
| New York | $117,482 | $2,267 | 23.16% | $359,600 | $6,217 | 1.73% |
| North Carolina | $90,243 | $1,397 | 18.58% | $220,000 | $1,765 | 0.80% |
| North Dakota | $103,797 | $1,524 | 17.62% | $233,300 | $2,378 | 1.02% |
| Ohio | $91,298 | $1,338 | 17.59% | $169,200 | $2,658 | 1.57% |
| Oklahoma | $86,723 | $1,313 | 18.17% | $164,500 | $1,623 | 0.99% |
| Oregon | $101,875 | $1,840 | 21.67% | $373,900 | $3,457 | 0.92% |
| Pennsylvania | $100,000 | $1,569 | 18.83% | $215,300 | $3,352 | 1.56% |
| Rhode Island | $108,763 | $1,952 | 21.54% | $293,100 | $4,526 | 1.54% |
| South Carolina | $85,590 | $1,329 | 18.63% | $207,400 | $1,213 | 0.58% |
| South Dakota | $91,930 | $1,434 | 18.72% | $207,700 | $2,528 | 1.22% |
| Tennessee | $86,333 | $1,337 | 18.58% | $211,700 | $1,376 | 0.65% |
| Texas | $105,323 | $1,747 | 19.90% | $232,000 | $4,399 | 1.90% |
| Utah | $102,978 | $1,682 | 19.60% | $345,300 | $1,972 | 0.57% |
| Vermont | $96,470 | $1,701 | 21.16% | $248,700 | $4,706 | 1.89% |
| Virginia | $114,445 | $1,891 | 19.83% | $321,200 | $2,656 | 0.83% |
| Washington | $115,096 | $2,064 | 21.52% | $414,300 | $3,841 | 0.93% |
| West Virginia | $79,315 | $1,101 | 16.66% | $156,000 | $916 | 0.59% |
| Wisconsin | $95,893 | $1,491 | 18.66% | $208,900 | $3,570 | 1.71% |
| Wyoming | $95,472 | $1,536 | 19.31% | $247,600 | $1,501 | 0.61% |
| Puerto Rico | $41,807 | $884 | 25.37% | $131,100 | $718 | 0.55% |

| ✓ Lowest Rates | ⨯ Highest Rates |
|---|---|
| Hawaii (0.37%) | New Jersey (2.2%) |
| Alabama (0.44%) | Illinois (2.18%) |
| West Virginia (0.51%) | Texas (2.15%) |
| Colorado (0.54%) | Vermont (1.97%) |
| Utah (0.54%) | Connecticut (1.92%) |
| Tennessee (0.59%) | New Hampshire (1.86%) |
| Nevada (0.6%) | New York (1.68%) |
| Idaho (0.61%) | Pennsylvania (1.64%) |
| Arizona (0.62%) | Ohio (1.62%) |
| Wyoming (0.63%) | Nebraska (1.53%) |
| ✓ Lowest Amount | ⨯ Highest Amount |
|---|---|
| Alabama ($841) | New jersey ($9,196) |
| West Virginia ($849) | Connecticut ($7,395) |
| Arkansas ($1,147) | New York ($6,628) |
| Tennessee ($1,202) | New Hampshire ($6,596) |
| Mississippi ($1,241) | Massachusetts ($6,514) |
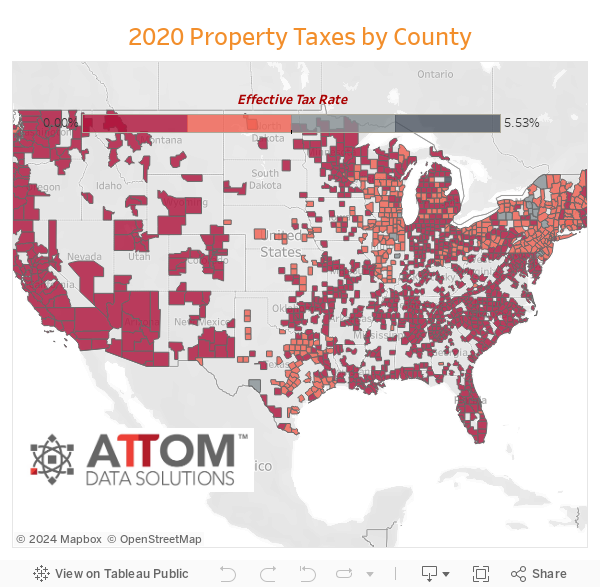
In 2020 sixteen counties had an average property tax of more than $10,000. The 5 highest were:
Across the states many individidual counties have widely varying rates when compared across the blended average rate for the state. This map allows you to drill down to see effective local rates.
| State | Effective Tax Rate | Rank |
|---|---|---|
| United States | 1.03% | |
| Alabama | 0.37% | 49 |
| Alaska | 0.98% | 21 |
| Arizona | 0.60% | 39 |
| Arkansas | 0.61% | 38 |
| California | 0.70% | 34 |
| Colorado | 0.52% | 46 |
| Connecticut | 1.73% | 5 |
| Delaware | 0.59% | 41 |
| Florida | 0.86% | 26 |
| Georgia | 0.87% | 25 |
| Hawaii | 0.31% | 50 |
| Idaho | 0.65% | 35 |
| Illinois | 1.97% | 2 |
| Indiana | 0.81% | 30 |
| Iowa | 1.43% | 10 |
| Kansas | 1.28% | 15 |
| Kentucky | 0.78% | 31 |
| Louisiana | 0.51% | 48 |
| Maine | 1.20% | 16 |
| Maryland | 1.01% | 20 |
| Massachusetts | 1.08% | 18 |
| Michigan | 1.31% | 13 |
| Minnesota | 1.05% | 19 |
| Mississippi | 0.63% | 37 |
| Missouri | 0.96% | 22 |
| Montana | 0.74% | 33 |
| Nebraska | 1.54% | 7 |
| Nevada | 0.56% | 42 |
| New Hampshire | 1.89% | 3 |
| New Jersey | 2.13% | 1 |
| New Mexico | 0.59% | 40 |
| New York | 1.30% | 14 |
| North Carolina | 0.78% | 32 |
| North Dakota | 0.88% | 24 |
| Ohio | 1.52% | 9 |
| Oklahoma | 0.83% | 29 |
| Oregon | 0.91% | 23 |
| Pennsylvania | 1.43% | 11 |
| Rhode Island | 1.37% | 12 |
| South Carolina | 0.53% | 44 |
| South Dakota | 1.14% | 17 |
| Tennessee | 0.63% | 36 |
| Texas | 1.60% | 6 |
| Utah | 0.56% | 43 |
| Vermont | 1.76% | 4 |
| Virginia | 0.84% | 28 |
| Washington | 0.84% | 27 |
| West Virginia | 0.53% | 45 |
| Wisconsin | 1.53% | 8 |
| Wyoming | 0.51% | 47 |
| District of Columbia | 0.58% | 42 |
Note: The figures in this table are mean effective property tax rates on owner-occupied housing (total real taxes paid/total home value). As a result, the data exclude property taxes paid by businesses, renters, and others. D.C.’s rank does not affect states’ ranks, but the figure in parentheses indicates where it would rank if included.
Sources: U.S. Census Bureau, "2019 American Community Survey"; Tax Foundation calculations.
| State | Collections per Capita | Rank |
|---|---|---|
| United States | $1,675 | |
| Alabama | $598 | 50 |
| Alaska | $2,195 | 10 |
| Arizona | $1,125 | 34 |
| Arkansas | $776 | 48 |
| California | $1,680 | 18 |
| Colorado | $1,616 | 23 |
| Connecticut | $3,107 | 3 |
| Delaware | $931 | 43 |
| Florida | $1,377 | 29 |
| Georgia | $1,205 | 33 |
| Hawaii | $1,358 | 30 |
| Idaho | $1,022 | 40 |
| Illinois | $2,277 | 8 |
| Indiana | $1,033 | 39 |
| Iowa | $1,702 | 15 |
| Kansas | $1,605 | 24 |
| Kentucky | $845 | 45 |
| Louisiana | $894 | 44 |
| Maine | $2,249 | 9 |
| Maryland | $1,693 | 17 |
| Massachusetts | $2,565 | 6 |
| Michigan | $1,465 | 28 |
| Minnesota | $1,649 | 21 |
| Mississippi | $1,061 | 37 |
| Missouri | $1,073 | 35 |
| Montana | $1,711 | 14 |
| Nebraska | $2,010 | 12 |
| Nevada | $1,044 | 38 |
| New Hampshire | $3,362 | 2 |
| New Jersey | $3,378 | 1 |
| New Mexico | $832 | 46 |
| New York | $3,025 | 4 |
| North Carolina | $993 | 41 |
| North Dakota | $1,649 | 20 |
| Ohio | $1,356 | 31 |
| Oklahoma | $771 | 49 |
| Oregon | $1,557 | 27 |
| Pennsylvania | $1,584 | 26 |
| Rhode Island | $2,431 | 7 |
| South Carolina | $1,211 | 32 |
| South Dakota | $1,586 | 25 |
| Tennessee | $799 | 47 |
| Texas | $1,973 | 13 |
| Utah | $1,070 | 36 |
| Vermont | $2,738 | 5 |
| Virginia | $1,699 | 16 |
| Washington | $1,645 | 22 |
| West Virginia | $950 | 42 |
| Wisconsin | $1,680 | 19 |
| Wyoming | $2,012 | 11 |
| District of Columbia | $3,740 | 1 |
Note: D.C.’s rank does not affect states’ ranks, but the figure in parentheses indicates where it would rank if included. See Table 43 for people per household by state.
Source: U.S. Census Bureau, "Annual Survey of State and Local Government Finances"; Tax Foundation calculations.
States with the lowest property tax rate are ranked lowest whereas states with the highest rates are ranked highest. The following tables are sortable. Click on any column header to sort by that column. Statewide data is estimated by multiplying the number of single family homes by the average property tax rate & the the average home price.
| Rank (Rate) | State | Tax Rate | Avg Home Price | Avg Property Tax | Highest Metro Area | Highest Metro Tax | Single-Family Homes | Prop Taxes | Real Estate Value |
|---|---|---|---|---|---|---|---|---|---|
| 1 | Hawaii | 0.32% | $784,583 | $2,489 | Honolulu | $2,853 | 263,544 | $655,859,737 | $206,772,142,152 |
| 2 | Alabama | 0.48% | $161,853 | $776 | Birmingham-Hoover | $1,229 | 1,416,458 | $1,099,560,543 | $229,257,976,674 |
| 3 | Colorado | 0.52% | $394,604 | $2,046 | Denver-Aurora-Lakewood | $2,452 | 1,474,840 | $3,017,021,019 | $581,977,763,360 |
| 4 | Tennessee | 0.54% | $181,331 | $981 | Chattanooga | $1,076 | 2,462,587 | $2,414,870,997 | $446,543,363,297 |
| 5 | Delaware | 0.56% | $271,585 | $1,526 | 268,144 | $409,301,861 | $72,823,888,240 | ||
| 6 | West Virginia | 0.57% | $271,585 | $802 | Huntington-Ashland | $893 | 503,299 | $403,808,142 | $136,688,458,915 |
| 7 | South Carolina | 0.63% | $204,349 | $1,294 | Charleston | $2,062 | 1,461,713 | $1,891,139,228 | $298,699,589,837 |
| 8 | District of Columbia | 0.64% | $772,008 | $4,915 | Washington-Arlington-Alexandria | $4,963 | 48,752 | $239,609,457 | $37,636,934,016 |
| 9 | Nevada | 0.64% | $293,432 | $1,873 | Las Vegas | $1,774 | 701,103 | $1,313,426,630 | $205,726,055,496 |
| 10 | Utah | 0.65% | $300,245 | $1,948 | Ogden-Clearfield | $1,831 | 671,168 | $1,307,378,832 | $201,514,836,160 |
| 11 | Arkansas | 0.67% | $150,742 | $1,006 | Little Rock | $1,349 | 966,864 | $972,976,892 | $145,747,013,088 |
| 12 | Arizona | 0.68% | $282,423 | $1,918 | Tucson | $2,437 | 1,731,919 | $3,321,478,730 | $489,133,759,737 |
| 13 | Louisiana | 0.71% | $183,591 | $1,302 | New Orleans | $1,864 | 1,303,899 | $1,698,204,632 | $239,384,121,309 |
| 14 | Kentucky | 0.74% | $165,285 | $1,217 | Louisville | $1,655 | 1,352,969 | $1,646,371,009 | $223,625,481,165 |
| 15 | Wyoming | 0.76% | $222,449 | $1,691 | 152,852 | $258,423,896 | $34,001,774,548 | ||
| 16 | California | 0.77% | $619,491 | $4,783 | Bakersfield | $2,399 | 7,451,864 | $35,642,959,906 | $4,616,362,681,224 |
| 17 | North Carolina | 0.78% | $217,560 | $1,706 | Durham-Chapel Hill | $2,927 | 2,955,186 | $5,041,987,758 | $642,930,266,160 |
| 18 | Montana | 0.80% | $242,342 | $1,950 | 218,757 | $426,566,206 | $53,014,008,894 | ||
| 19 | Georgia | 0.86% | $204,399 | $1,757 | Atlanta | $2,079 | 2,989,257 | $5,251,647,262 | $611,001,141,543 |
| 20 | Mississippi | 0.86% | $143,357 | $1,236 | Jackson | $1,424 | 826,867 | $1,021,799,579 | $118,537,172,519 |
| 21 | Washington | 0.88% | $406,602 | $3,592 | Seattle | $4,767 | 1,847,717 | $6,636,087,773 | $751,285,427,634 |
| 22 | Oklahoma | 0.89% | $142,683 | $1,272 | Oklahoma City | $1,650 | 1,196,564 | $1,521,917,123 | $170,729,341,212 |
| 23 | Indiana | 0.94% | $143,016 | $1,351 | Indianapolis | $1,720 | 1,938,580 | $2,618,310,864 | $277,247,957,280 |
| 24 | Alaska | 0.96% | $336,088 | $3,225 | Huntington-Ashland | $893 | 148,221 | $478,053,738 | $49,815,299,448 |
| 25 | New Mexico | 0.97% | $227,540 | $2,214 | Albuquerque | $2,202 | 572,602 | $1,267,491,253 | $130,289,859,080 |
| 26 | Virginia | 0.99% | $321,992 | $3,181 | Virginia Beach | $2,521 | 2,311,374 | $7,352,471,265 | $744,243,937,008 |
| 27 | Oregon | 1.02% | $342,488 | $3,495 | Portland | $4,146 | 964,852 | $3,372,374,666 | $330,450,231,776 |
| 28 | Idaho | 1.02% | $236,120 | $2,415 | Boise City | $2,213 | 470,126 | $1,135,221,302 | $111,006,151,120 |
| 29 | Florida | 1.05% | $278,629 | $2,936 | Naples-Immokalee-Marco Island | $5,035 | 5,043,659 | $14,808,112,731 | $1,405,309,663,511 |
| 30 | Maryland | 1.05% | $326,151 | $3,437 | Baltimore | $3,278 | 1,685,294 | $5,793,093,142 | $549,660,323,394 |
| 31 | Minnesota | 1.06% | $260,373 | $2,752 | Minneapolis-St. Paul-Bloomington | $3,507 | 1,568,498 | $4,316,053,505 | $408,394,529,754 |
| 32 | Missouri | 1.11% | $173,044 | $1,923 | St. Louis | $2,530 | 1,889,825 | $3,633,221,145 | $327,022,877,300 |
| 33 | North Dakota | 1.11% | $227,882 | $2,539 | Fargo | $2,696 | 165,946 | $421,387,935 | $37,816,106,372 |
| 34 | Massachusetts | 1.21% | $455,642 | $5,513 | Boston | $6,624 | 1,426,203 | $7,862,552,338 | $649,837,987,326 |
| 35 | South Dakota | 1.38% | $195,438 | $2,701 | Sioux Falls | $2,753 | 206,322 | $557,236,832 | $40,323,159,036 |
| 36 | Iowa | 1.43% | $158,691 | $2,270 | Des Moines | $3,561 | 1,100,452 | $2,498,309,539 | $174,631,828,332 |
| 37 | Maine | 1.43% | $274,961 | $3,937 | Portland | $4,448 | 214,542 | $844,568,960 | $58,990,682,862 |
| 38 | Kansas | 1.47% | $172,654 | $2,532 | Wichita | $2,153 | 867,569 | $2,196,871,236 | $149,789,258,126 |
| 39 | Nebraska | 1.50% | $174,731 | $2,614 | Omaha | $3,089 | 567,796 | $1,484,030,705 | $99,211,562,876 |
| 40 | Michigan | 1.52% | $165,584 | $2,524 | Ann Arbor | $4,456 | 3,617,172 | $9,128,770,495 | $598,945,808,448 |
| 41 | Wisconsin | 1.61% | $199,072 | $3,196 | Madison | $4,871 | 1,644,878 | $5,256,720,608 | $327,449,153,216 |
| 42 | Rhode Island | 1.64% | $316,486 | $5,195 | Providence-Warwick | $4,800 | 243,941 | $1,267,347,836 | $77,203,911,326 |
| 43 | Ohio | 1.68% | $155,415 | $2,616 | Columbus | $3,636 | 3,377,526 | $8,836,073,431 | $524,918,203,290 |
| 44 | New York | 1.88% | $372,854 | $7,013 | New York | $9,384 | 3,170,812 | $22,236,206,289 | $1,182,249,937,448 |
| 45 | Pennsylvania | 1.89% | $206,280 | $3,900 | Philadelphia | $5,324 | 3,388,941 | $13,215,670,426 | $699,070,749,480 |
| 46 | Connecticut | 2.00% | $348,513 | $6,963 | Bridgeport-Stamford-Norwalk | $10,400 | 833,532 | $5,804,256,783 | $290,496,737,916 |
| 47 | Vermont | 2.02% | $255,242 | $5,150 | Burlington | $5,604 | 246,689 | $1,270,380,094 | $62,965,393,738 |
| 48 | New Hampshire | 2.03% | $292,452 | $5,935 | Claremont-Lebanon | $5,668 | 321,532 | $1,908,139,330 | $94,032,676,464 |
| 49 | Texas | 2.06% | $226,553 | $4,660 | Austin | $7,012 | 6,610,286 | $30,802,480,121 | $1,497,580,124,158 |
| 50 | Illinois | 2.13% | $227,242 | $4,845 | Chicago | $5,812 | 3,203,168 | $15,517,823,616 | $727,894,302,656 |
| 51 | New Jersey | 2.31% | $367,036 | $8,477 | Trenton | $8,103 | 2,452,282 | $20,788,294,213 | $900,075,776,152 |
| United States | 1.24% | $279,715 | $3,313 | Bridgeport-Stamford-Norwalk | $10,400 | 82,370,722 | $272,863,921,610 | $23,040,317,386,073 |
Source: ATTOM Data Solutions via USA Today
Property taxes paid as a percentage of owner-occupied housing value. HTML table is sorted alphabetically by state, but column headers can be clicked on to sort by other columns. The final 5 columns show what percent of the state's tax base is driven by each component.
| Rank | State | Abreviation | Effective Propert Tax Rate | Property Tax Rev | General Sales | Individual Income | Corporate Income | Other Taxes |
|---|---|---|---|---|---|---|---|---|
| United States | US | 1.08% | 31.3% | 23.3% | 22.9% | 3.7% | 18.9% | |
| 2 | Alabama | AL | 0.38% | 17.4% | 29.7% | 22.7% | 2.8% | 27.4% |
| 29 | Alaska | AK | 0.97% | 34.9% | 3.9% | 0.0% | 7.3% | 53.8% |
| 14 | Arizona | AZ | 0.66% | 29.5% | 39.6% | 15.4% | 2.6% | 13.0% |
| 10 | Arkansas | AR | 0.59% | 18.0% | 37.5% | 23.4% | 3.6% | 17.6% |
| 16 | California | CA | 0.72% | 25.4% | 22.9% | 32.2% | 4.2% | 15.3% |
| 7 | Colorado | CO | 0.55% | 31.3% | 25.8% | 24.2% | 3.1% | 15.7% |
| 46 | Connecticut | CT | 1.65% | 38.3% | 15.3% | 29.8% | 2.4% | 14.2% |
| 8 | Delaware | DE | 0.56% | 18.8% | 0.0% | 26.6% | 6.9% | 47.7% |
| 28 | Florida | FL | 0.93% | 35.7% | 35.3% | 0.0% | 3.1% | 26.0% |
| 26 | Georgia | GA | 0.89% | 32.2% | 26.0% | 26.3% | 2.8% | 12.7% |
| 1 | Hawaii | HI | 0.28% | 17.2% | 37.6% | 21.5% | 1.6% | 22.2% |
| 18 | Idaho | ID | 0.75% | 28.7% | 26.0% | 25.3% | 3.6% | 16.4% |
| 49 | Illinois | IL | 1.97% | 36.5% | 14.2% | 23.5% | 6.3% | 19.5% |
| 24 | Indiana | IN | 0.84% | 25.9% | 28.3% | 24.4% | 3.5% | 17.8% |
| 40 | Iowa | IO | 1.43% | 34.5% | 21.5% | 24.1% | 2.8% | 17.1% |
| 37 | Kansas | KS | 1.29% | 32.8% | 30.7% | 19.8% | 2.6% | 14.1% |
| 20 | Kentucky | KY | 0.78% | 20.4% | 19.7% | 31.3% | 5.1% | 23.4% |
| 3 | Louisiana | LA | 0.48% | 21.6% | 38.3% | 15.2% | 2.7% | 22.2% |
| 36 | Maine | ME | 1.24% | 39.9% | 18.7% | 22.1% | 2.9% | 16.4% |
| 32 | Maryland | MD | 1.00% | 26.6% | 12.5% | 37.4% | 2.9% | 20.5% |
| 34 | Massachusetts | MA | 1.13% | 36.3% | 13.6% | 32.6% | 5.4% | 12.1% |
| 39 | Michigan | MI | 1.43% | 35.4% | 23.3% | 22.3% | 2.4% | 16.7% |
| 33 | Minnesota | MN | 1.08% | 25.0% | 18.3% | 31.3% | 4.3% | 21.1% |
| 11 | Mississippi | MS | 0.61% | 26.2% | 31.5% | 15.9% | 5.0% | 21.4% |
| 31 | Missouri | MO | 0.98% | 27.6% | 26.4% | 27.0% | 2.0% | 16.9% |
| 19 | Montana | MT | 0.75% | 38.2% | 0.0% | 27.1% | 3.8% | 31.0% |
| 44 | Nebraska | NE | 1.59% | 36.0% | 23.0% | 23.1% | 3.3% | 14.5% |
| 15 | Nevada | NV | 0.68% | 24.6% | 38.1% | 0.0% | 0.0% | 37.3% |
| 50 | New Hampshire | NH | 1.99% | 66.1% | 0.0% | 1.6% | 9.4% | 22.8% |
| 51 | New Jersey | NJ | 2.13% | 47.5% | 15.4% | 20.8% | 4.1% | 12.2% |
| 13 | New Mexico | NM | 0.66% | 18.4% | 36.8% | 15.7% | 2.5% | 26.6% |
| 38 | New York | NY | 1.38% | 30.7% | 16.5% | 32.1% | 6.9% | 13.7% |
| 21 | North Carolina | NC | 0.82% | 26.3% | 22.7% | 28.9% | 3.8% | 18.4% |
| 25 | North Dakota | ND | 0.88% | 11.5% | 21.1% | 6.9% | 3.5% | 57.1% |
| 43 | Ohio | OH | 1.57% | 28.6% | 25.0% | 26.7% | 0.6% | 19.1% |
| 22 | Oklahoma | OK | 0.83% | 17.5% | 33.3% | 21.4% | 2.9% | 24.9% |
| 30 | Oregon | OR | 0.98% | 32.9% | 0.0% | 40.8% | 3.4% | 22.8% |
| 41 | Pennsylvania | PA | 1.46% | 29.8% | 16.9% | 25.9% | 4.6% | 22.7% |
| 42 | Rhode Island | RI | 1.51% | 44.6% | 16.8% | 20.0% | 2.2% | 16.4% |
| 6 | South Carolina | SC | 0.55% | 33.5% | 24.1% | 22.0% | 2.1% | 18.2% |
| 35 | South Dakota | SD | 1.19% | 35.3% | 40.4% | 0.0% | 0.8% | 23.4% |
| 17 | Tennessee | TN | 0.72% | 26.8% | 40.9% | 1.2% | 5.8% | 25.3% |
| 45 | Texas | TX | 1.63% | 40.4% | 36.0% | 0.0% | 0.0% | 23.6% |
| 12 | Utah | UT | 0.64% | 27.7% | 24.3% | 28.0% | 3.0% | 17.0% |
| 47 | Vermont | VT | 1.71% | 42.2% | 10.5% | 19.4% | 3.0% | 24.8% |
| 23 | Virginia | VA | 0.83% | 34.7% | 13.7% | 31.1% | 2.1% | 18.4% |
| 27 | Washington | WA | 0.93% | 29.9% | 45.4% | 0.0% | 0.0% | 24.6% |
| 9 | Washington D.C. | DC | 0.57% | 32.5% | 17.8% | 26.3% | 6.5% | 16.9% |
| 4 | West Virginia | WV | 0.53% | 21.5% | 16.7% | 24.2% | 2.8% | 34.8% |
| 48 | Wisconsin | WI | 1.72% | 36.2% | 18.9% | 25.7% | 3.7% | 15.5% |
| 5 | Wyoming | WY | 0.54% | 35.5% | 27.4% | 0.0% | 0.0% | 37.1% |
Source: Tax Foundation
Note: The figures in the effective property tax column are mean effective property tax rates on owner-occupied housing (total real taxes paid/total home value). As a result, the data exclude property taxes paid by businesses, renters, and others. The "Other Taxes" column include excise taxes (such as those on alcohol, tobacco, motor vehicles, utilities, and licenses), severance taxes, stock transfer taxes, estate and gift taxes, and other miscellaneous taxes.

The Federal Reserve has hinted they are likely to taper their bond buying program later this year. Lock in today's low rates and save on your loan.
Are you paying too much for your mortgage?
Check your refinance options with a trusted El Monte lender.
Answer a few questions below and connect with a lender who can help you refinance and save today!