The following table shows current 30-year El Monte mortgage rates. You can use the menus to select other loan durations, alter the loan amount. or change your location.
Home Mortgage Rates in California

Palm trees, beaches and more than 300 sunny days per year on average - who wouldn’t want to live in the Golden State? And that’s precisely the problem. Demand for homes in California has soared; consequently the prices reflect that.
The real estate market in California is one of the country's most expensive. Median incomes do not always keep pace with average home prices, making the state's property market all the more difficult. The high cost of living in the state has led to some of the highest poverty rates in the nation in spite of the state being the sixth largest economy in the world. Nevertheless, pockets of affordability do exist outside the state's major cities, and mortgages with reasonable interest rates can be found without a high credit score.
California Real Estate Trends
Before & During the 2008 Housing Crisis
One of the consequences of California's increasing home prices is the decline in home ownership. According to data from the St. Louis Federal Reserve Bank, the percent of Californians who own rather than rent has been on the decline since 2006.
The housing crisis of 2007 caused much turmoil in the Golden State, as it did in many other parts of the country. Before the real estate bubble burst in 2008, California had seen more than its fair share of real estate booms and busts. In fact, one could say that expansions and contractions are a natural part of California's long-term upward trend in prices.
For example, prices for luxury homes in the San Francisco Bay Area saw a significant decline in 2000 after the dotcom bubble burst on the Nasdaq. And then 9/11 struck a year later, and home prices suffered even more. But they proved to be resilient, showing a significant recovery until the mortgage crisis of 2007 jolted them once again.

This real estate fiasco caused the number of foreclosures to increase, according to the Public Policy Institute of California. The number of construction permits went down a very significant 35%. The same research agency estimates that home prices fell more than 15% in central valley areas, but only slightly declined in most coastal regions.
Data from the Federal Housing Finance Agency (FHFA) for San Mateo and San Francisco counties show a tendency toward boom and bust cycles in the short term, but with long term appreciation. A recession in the early 1990's, for example, precipitated a decline in home prices, but there was a recovery in the mid-90's.
After the 2008 Housing Crisis
Although the Great Recession of 2007/2008 was worse than other misfortunes in California's real estate history, the state was nevertheless able to recover from it. The Golden State's ability to quickly bounce back is a testament to the strength of the housing market there.
High real estate prices hold down homeownership rates across California. Throughout the mid 1980s to 1990 the ownership rate held between 53% and 55%. The tech stock bubble caused the ownership rate to jump to 58.2% in 2001. The ensuing housing bubble drove ownership rates to a peak of 60.2% in 2006. By 2016 the ownership rate had fallen to 53.8%. The median ownership rate across the nation is about 10% higher, reaching 63.9% in Q3 of 2017.
For instance, compared to Las Vegas, Los Angeles has done a much better job of recovering from the housing crisis. According to S&P/Case-Shiller indexes, home prices in the City of Angels are almost back to pre-recession levels; whereas Las Vegas continues to struggle. California's city has seen a 95% recovery in home prices, whereas Nevada's is still 31% below 2006 levels. A two-bedroom house in Los Angeles proper may cost up to three times as much as a similar home in say, Austin, Texas.
According to Trulia's heat scale, California, along with New York, New Jersey, Connecticut are all colored the brightest shade of red, indicating a sweltering average home price. Neighboring Nevada and nearby New Mexico, among others, come in at a distinctly warm orange. For the most bang for your buck, head to North Dakota, Iowa, Indiana or Ohio where Trulia.com has rated these areas a cool deep green to indicate low average house prices.
Real estate prices in California have been on the rise recently. The median value of a home in the state is currently around $506,000. The average list price is just under $500,000. Per square foot, the average list price is $296.
These numbers are quite a bit higher than the national average, where the median home value sits at less than $201,000. The average list price in the U.S. is just north of $258,000. On a per-square-foot basis, this translates into $139. The National Association of Realtors also estimates the average home price in the United States to be slightly less than $260,000. So California is roughly twice as expensive as the rest of the country.
According to the California Association of Realtors (C.A.R.), the median sale price of resold single detached homes in the state is just under $550,000. This price does vary from region to region. Santa Clara is much more expensive than Riverside, for example.
Prices of new detached homes will of course be higher than existing houses. In Salinas, new homes typically sell for $350,000 up to $970,000. In Orange County, new homes go for $400,000 to nearly $5,000,000.
C.A.R. also notes that the median price of condos in California is slightly above $443,000, a small increase compared to previous figures. San Francisco, home to Facebook and other tech startups, has the most expensive condos with an average resale price of approximately $1,200,000; while Fresno sits at the bottom of the survey at less than $132,000.
According to the S&P/Case-Shiller Home Price Index, which is one of the country's most followed indicators for home values, real estate prices in California are currently on the rise. This is true for multiple populated areas. There is no sign of this increase slowing down, so purchasing real estate in California, while pricey now, can only be expected to become more expensive in the near future.
COVID-19 Impacts on the California Real Estate Market
Through the first 3 quarters of 2020 real estate held up far better than it did during the 2008 housing recession. Central banks and politicians reacted faster and much more aggressively to the COVID-19 crisis than they did to the 2008 recession. Many novel and unconventional policies which began in response to the prior recession were used much more aggressively in this recession. For instance, here are some of the policies which were enacted:
- The Federal Reserve quickly dropped the Fed Funds Rate to zero while suggesting they would buy an unlimited number of Treasury securities and mortgage-backed securities to keep those markets functional.
- In 4 months the Federal Reserve expanded their balance sheet by over $3 trillion from $4 trillion to over $7 trillion.
- The Federal Reserve offered forward guidance stating they were unlikely to lift interest rates through 2023.
- Unemployment benefits were extended in duration, amount, and to people who previously could not qualify for unemployment like self-employed people.
- The CARES act was a $2.2 trillion economic stimulus bill. It prohibited evictions for lack of rent payment and prohibited foreclosures for lack of mortgage payments while allowing homebuyers to payment forebearance for up to 360 days.
- In the 2008 economic criss the FASB did not relax mark-to-market accounting rules until April, 2009. In 2020 domestic & international regulators worked much more quickly to adjust financial reporting requirements.
On November 24, 2020 the Federal Housing Finance Agency (FHFA) raised conforming loan limits by 7.42%, reflecting strong annual growth in the nationwide FHFA House Price Index (HPI). 2022 and 2023 saw limit increases of 18.05% and 12.21%, the fastest 2-year growth rates since 1986 & 1987, and inline with the 15.95% growth in 2006. In 2024 and 2025 the limits were increased at more historically normal levels of 5.56% and 5.21%.

Bay Area Real Estate Volatility
Some big tech companies like Twitter have promoted the work-from-home movement and Pinterest paid $89.5 million to break a large lease in San Francisco.
As employees moved to working remotely that shifted the local real estate supply and demand balance, causing San Francisco median rents for studio apartments to fall 31% year over year in September of 2020. The net out migration from the Bay Area was also shown in recent aggregate sales tax data. If this trend continues it would be the third crash for the San Francisco real estate market in the past couple decades, as the 2008 housing crisis was preceeded by the popping of the Dotcom bubble on March 10, 2000.
The launch of OpenAI's ChatGPT on November 30, 2022 and the popularity of general AI has sharply increased demand for startups, along with putting a bid back under real estate even as rates normalized.
State & Federal Income Tax Impacts on Internal Migration
The 2017 Tax Cuts and Jobs Acts (TCJA) bill limited a taxpayer's deduction of state and local taxes (SALT) to $10,000. This dramatically increased the cost of state taxes in states with high marginal income tax rates and relatively high property taxes. A home of modest means in a middle-class neighborhood on the outskirts of the Bay Area can cost $7,000 a year in property taxes. While campaigning Joe Biden stated he wanted to set the top marginal tax rate at 39.7% and re-impose FICA taxes on any income above $400,000. This would effectively make the marginal Federal income tax rate 55% for those in the top bracket. Add in the 13.3% top marginal rate in California and taxpayers could pay a 68.3% marginal rate on income above $1,000,000. That income tax rate would be before other taxes and fees like property taxes, vehicle licensing and registration, and sales taxes.
Some high-income earners like bond investor Jeffrey Gundalach have considered moving due to escalating income taxes coupled with incompetent government leading to rolling brown outs. Low-tax or no income tax states like Florida, Texas, Tenneessee and Nevada have seen net migration from high-tax states like California, New York and New Jersey. Lockdowns destroyed many small businesses while lowering the appeal of cramped living places in big cities. Those combined with the realization that much work can be done remote has many businesses and successful business owners migrating. California legislators proposed a wealth and exit tax. Some high-end spec homes which were listed for $100 million or more sold at steep discounts to their original offering prices as capital has flooded into the stock market & conspicuous consumption is looking less appealing during a time when many people are hurting and politicians are proposing wealth and income taxes.

The COVID-19 Crisis Led to Record Income Inequality
American income inequality was at a 50-year high before the COVID-19 crisis took hold. Wealthier people with higher incomes have a higher likelihood of being able to continue to work from home, whereas many low-wage hospitality workers were hit hard by lockdowns. Some small business owners without access to credit saw their businesses fall apart due to the impacts of lockdowns and demonstrations.
Central bank intervention has led the domestic stock market to recover quickly from the COVID-19 crisis, but many middle class and lower class consumers hold little stock and are still struggling with unemployment. The country has reached record wealth and income inequality which exceeds both that of the gilded age and many third world countries.
Large Metropolitan Areas
| CA Rank |
US Rank |
Metropolitan Area |
2016 Pop |
2010 Pop |
Change |
% △ |
| 1 |
2 |
Los Angeles-Long Beach-Anaheim |
13,310,447 |
12,828,837 |
481,610 |
3.75% |
| 2 |
11 |
San Francisco-Oakland-Hayward |
4,679,166 |
4,335,391 |
343,775 |
7.93% |
| 3 |
13 |
Riverside-San Bernardino-Ontario |
4,527,837 |
4,224,851 |
302,986 |
7.17% |
| 4 |
17 |
San Diego-Carlsbad |
3,317,749 |
3,095,313 |
222,436 |
7.19% |
| 5 |
27 |
Sacramento-Roseville-Arden-Arcade |
2,296,418 |
2,149,127 |
147,291 |
6.85% |
| 6 |
35 |
San Jose-Sunnyvale-Santa Clara |
1,978,816 |
1,836,911 |
141,905 |
7.73% |
| 7 |
56 |
Fresno |
979,915 |
930,450 |
49,465 |
5.32% |
| 8 |
62 |
Bakersfield |
884,788 |
839,631 |
45,157 |
5.38% |
| 9 |
67 |
Oxnard-Thousand Oaks-Ventura |
849,738 |
823,318 |
26,420 |
3.21% |
| 10 |
77 |
Stockton-Lodi |
733,709 |
685,306 |
48,403 |
7.06% |
| 11 |
102 |
Modesto |
541,560 |
514,453 |
27,107 |
5.27% |
| 12 |
107 |
Santa Rosa |
503,070 |
483,878 |
19,192 |
3.97% |
| 13 |
112 |
Visalia-Porterville |
460,437 |
442,179 |
18,258 |
4.13% |
| 14 |
119 |
Santa Maria-Santa Barbara |
446,170 |
423,895 |
22,275 |
5.25% |
| 15 |
122 |
Vallejo-Fairfield |
440,207 |
413,344 |
26,863 |
6.50% |
| 16 |
124 |
Salinas |
435,232 |
415,057 |
20,175 |
4.86% |
| 17 |
166 |
San Luis Obispo-Paso Robles-Arroyo Grande |
282,887 |
269,637 |
13,250 |
4.91% |
| 18 |
174 |
Santa Cruz-Watsonville |
274,673 |
262,382 |
12,291 |
4.68% |
| 19 |
178 |
Merced |
268,672 |
255,793 |
12,879 |
5.03% |
| 20 |
197 |
Chico |
226,864 |
220,000 |
6,864 |
3.12% |
| 21 |
233 |
El Centro |
180,883 |
174,528 |
6,355 |
3.64% |
| 22 |
234 |
Redding |
179,631 |
177,223 |
2,408 |
1.36% |
| 23 |
243 |
Yuba City |
171,926 |
166,892 |
5,034 |
3.02% |
| 24 |
266 |
Madera |
154,697 |
150,865 |
3,832 |
2.54% |
| 25 |
279 |
Hanford-Corcoran |
149,785 |
152,982 |
-3,197 |
-2.09% |
| 26 |
297 |
Napa |
142,166 |
136,484 |
5,682 |
4.16% |
| 27 |
303 |
Eureka-Arcata-Fortuna |
136,646 |
134,623 |
2,023 |
1.50% |
| 28 |
385 |
Truckee-Grass Valley |
99,107 |
98,764 |
343 |
0.35% |
| 29 |
417 |
Ukiah |
87,628 |
87,841 |
-213 |
-0.24% |
| 30 |
506 |
Clearlake |
64,116 |
64,665 |
-549 |
-0.85% |
| 31 |
512 |
Red Bluff |
63,276 |
63,463 |
-187 |
-0.29% |
| 32 |
565 |
Sonora |
53,804 |
55,365 |
-1,561 |
-2.82% |
| 33 |
809 |
Susanville |
30,870 |
34,895 |
-4,025 |
-11.53% |
| 34 |
839 |
Crescent City |
27,540 |
28,610 |
-1,070 |
-3.74% |
Popular Cities in California
Not many states in America have as many fashionable, trendy and expensive cities available to choose from as California. Not many states also see as much variation in price from place to place as the Golden State.
Los Angeles

The Los Angeles metro area is the largest populated region in the state, and the second largest in the country, behind only New York City. It encompasses not only L.A., but also Anaheim, Santa Ana, Irvine, and Long Beach; all five of which are contained within Los Angeles and Orange counties.
There is a vibrant economy in the L.A. metro area, with Anaheim being home to Disneyland, and Los Angeles of course having the entertainment capital of the world, among other industries.
Sports fans have many options to choose from. Both the Lakers and the Clippers play at the Staples Center. The Los Angeles Dodgers are one of the most storied baseball franchises in history & Anaheim is home to the Los Angeles Angels. Hockey fans can watch both the Los Angeles Kings and the Anaheim Ducks. Multiple pro football teams also call the city home. The Rams are based in Los Angeles & the Chargers play in Carson.
The sky is the limit on housing prices in Beverly Hills. Long Beach has a large shipping port and significant oil reserves, while Irvine is known for its high median incomes and low crime rates.

The U.S. Census Bureau reports a median household income of roughly $91,000 for Irvine, which is significantly higher than the state average. The average home value in the city is $795,000, who also reports a median list price of $897,000.
For Los Angeles, median household income relative to housing prices looks much different. The Census Bureau's latest figure is slightly more than $50,000 for median income, while home values are around $630,000. The ratio between median income and average real estate prices doesn't look overly tempting in California's biggest metro area. In August of 2017 California Association of Realtors stated the median Los Angeles county home price was $575,130.
San Diego

San Diego is the second most populous city in California with an estimated population of 1,406,630 in 2016. The city is known for have a great mild year-round climate, which helps drive tourism. Cruise lines are operated out of San Diego and the the city hosts many popular tourist attractions including the San Diego Zoo and SeaWorld San Diego. San Diego is also home to the Padres baseball team.
The deepwater port enables the city to have a strong shipbuilding yard and a naval base. The city is also a hub for international trade. Wireless technology firms including Qualcomm, LG and Cricket Communications operate locally. The local university system & research institutions makes the city a leader in biotechnology.
The median local home value was $555,000 in July of 2017, yielding a price per square foot of $416. Local home prices are over 10% above where they were during the prior peak before the Great Recession.
San Francisco

In August of 2017 California Association of Realtors stated the median San Francisco home price was $1.38 million. San Francisco has some of the most expensive real estate in the world, requiring people with typical jobs to live with roommates or commute hours to work. High real estate prices have led to a domestic net outflow from San Francisco & the surrounding Bay Area region.

“The San Francisco Bay Area lost more than 600,000 net domestic migrants between 2000 and 2009 before experiencing a five-year respite. … In 2016, some 26,000 more people left the Bay Area than arrived. San Francisco net migration went from a high of 16,000 positive in 2013 to 12,000 negative three years later.”
Other parts of the Bay Area have also seen increasing real estate prices causing a broad-based home affordability issue, which increases congestion as people who can't afford to live in San Francisco commute to work daily.
San Francisco is home to the Giants MLB team & the San Francisco 49ers play about 40 miles south in Santa Clara.
Oakland

Oakland has a large marine cargo port and is home to a number of large corporations including Kaiser Permanente, Dryer's & Clorox.
Being a bit further from the Pacific Ocean, Oakland is a bit warmer than San Francisco. Many tech workers & others who can't afford San Francisco rents commute across the bay each day using either the BART subway system or the Bay Bridge.
Oakland was home to the Golden State Warriors, the Raiders, and the Athletics, though high crime caused the Warriors to move to San Francisco and both the Raiders and Athletics to move to Las Vegas.
Median home sale prices in Oakland were $680,000 in June of 2017 yielding a price per square foot of $555.
San Jose & Silicon Valley

The broader Silicon Valley area has high real estate prices due to the massive wealth of tech firms like Apple, Google & Facebook along with thousands of tech start ups. Some of the employees for these firms live in temporary housing or company dorms, but it is not uncommon for their cafeteria workers to live in a garage.
The Sharks NHL team is based in San Jose.
Sacramento

According to the California Department of Finance, the state's fastest growing city is Sacramento. What is attracting so many people? The city is home to California's state capital plus a major branch of the University of California. The median home price in the city rose from $329,500 to $342,500 in just one year. Local real estate appraiser Ryan Lundquist says that Sacramento has a shortage of housing. Besides the region's pleasant climate, Intel and Kaiser Permanente provide jobs. Basketball fans can watch Kings games.
Fresno

If you're willing to live inland away from the coast, Fresno has some of the best home values in the state. Located off of State Route 99 between L.A. and San Francisco, Fresno leaves the big cities behind, but still has a population of half a million inhabitants. The city offers a large hospital and a branch of the University of California.
The median home value in Fresno is estimated to be around $226,000. With a median income of over $45,000, the city offers a home value-to-salary ratio of 5.0, much lower than will be found in other cities in the state. The Fresno Bee, a local newspaper, reports that the city was hit hard by the Great Recession, but improvements in employment are now translating into more mortgage applications.
California Census Data
As of July 1, 2016 the state of California has an estimated population of 39,250,017 across 155,779.2 mi² yielding a population density of 251.959 people per mi² across the state.
The following table highlights the July 1, 2016 populations of cities with over 10,000 residents based on United States Census Bureau estimates. For Census Designated Places (CDP) where there was no population estimate available for 2016, the 2011-2015 American Community Survey 5-Year Estimates data was used.
All table columns are sortable. Click on the column headers to sort by that column. Click again to sort low to high. Cities with higher levels of population growth typically see the increased demand drive faster real estate price appreciation.
| Rank |
Geography |
County |
2016 Pop |
2010 Pop |
Change |
% △ |
Land mi² |
Pop Den mi² |
| 1 |
Los Angeles |
Los Angeles |
3,976,322 |
3,792,621 |
183,701 |
4.84% |
468.67 |
8,484.27 |
| 2 |
San Diego |
San Diego |
1,406,630 |
1,307,402 |
99,228 |
7.59% |
325.19 |
4,325.56 |
| 3 |
San Jose |
Santa Clara |
1,025,350 |
945,942 |
79,408 |
8.39% |
176.53 |
5,808.36 |
| 4 |
San Francisco |
San Francisco |
870,887 |
805,235 |
65,652 |
8.15% |
46.87 |
18,580.90 |
| 5 |
Fresno |
Fresno |
522,053 |
494,665 |
27,388 |
5.54% |
111.96 |
4,662.85 |
| 6 |
Sacramento |
Sacramento |
495,234 |
466,488 |
28,746 |
6.16% |
97.92 |
5,057.54 |
| 7 |
Long Beach |
Los Angeles |
470,130 |
462,257 |
7,873 |
1.70% |
50.29 |
9,348.38 |
| 8 |
Oakland |
Alameda |
420,005 |
390,724 |
29,281 |
7.49% |
55.79 |
7,528.32 |
| 9 |
Bakersfield |
Kern |
376,380 |
347,483 |
28,897 |
8.32% |
142.16 |
2,647.58 |
| 10 |
Anaheim |
Orange |
351,043 |
336,265 |
14,778 |
4.39% |
49.84 |
7,043.40 |
| 11 |
Santa Ana |
Orange |
334,217 |
324,528 |
9,689 |
2.99% |
27.27 |
12,255.85 |
| 12 |
Riverside |
Riverside |
324,722 |
303,871 |
20,851 |
6.86% |
81.14 |
4,002.00 |
| 13 |
Stockton |
San Joaquin |
307,072 |
291,707 |
15,365 |
5.27% |
61.67 |
4,979.28 |
| 14 |
Chula Vista |
San Diego |
267,172 |
243,916 |
23,256 |
9.53% |
49.63 |
5,383.28 |
| 15 |
Irvine |
Orange |
266,122 |
212,375 |
53,747 |
25.31% |
66.11 |
4,025.44 |
| 16 |
Fremont |
Alameda |
233,136 |
214,089 |
19,047 |
8.90% |
77.46 |
3,009.76 |
| 17 |
San Bernardino |
San Bernardino |
216,239 |
209,924 |
6,315 |
3.01% |
59.2 |
3,652.69 |
| 18 |
Modesto |
Stanislaus |
212,175 |
201,165 |
11,010 |
5.47% |
36.87 |
5,754.68 |
| 19 |
Fontana |
San Bernardino |
209,665 |
196,069 |
13,596 |
6.93% |
42.43 |
4,941.43 |
| 20 |
Oxnard |
Ventura |
207,906 |
197,899 |
10,007 |
5.06% |
26.89 |
7,731.72 |
| 21 |
Moreno Valley |
Riverside |
205,499 |
193,365 |
12,134 |
6.28% |
51.27 |
4,008.17 |
| 22 |
Glendale |
Los Angeles |
200,831 |
191,719 |
9,112 |
4.75% |
30.45 |
6,595.44 |
| 23 |
Huntington Beach |
Orange |
200,652 |
189,992 |
10,660 |
5.61% |
26.75 |
7,501.01 |
| 24 |
Santa Clarita |
Los Angeles |
181,972 |
176,320 |
5,652 |
3.21% |
52.72 |
3,451.67 |
| 25 |
Rancho Cucamonga |
San Bernardino |
176,534 |
165,269 |
11,265 |
6.82% |
39.85 |
4,429.96 |
| 26 |
Oceanside |
San Diego |
175,464 |
167,086 |
8,378 |
5.01% |
41.23 |
4,255.74 |
| 27 |
Santa Rosa |
Sonoma |
175,155 |
167,815 |
7,340 |
4.37% |
41.29 |
4,242.07 |
| 28 |
Garden Grove |
Orange |
174,858 |
170,883 |
3,975 |
2.33% |
17.94 |
9,746.82 |
| 29 |
Ontario |
San Bernardino |
173,212 |
163,924 |
9,288 |
5.67% |
49.94 |
3,468.40 |
| 30 |
Elk Grove |
Sacramento |
169,743 |
153,015 |
16,728 |
10.93% |
42.19 |
4,023.30 |
| 31 |
Corona |
Riverside |
166,785 |
152,374 |
14,411 |
9.46% |
38.83 |
4,295.26 |
| 32 |
Lancaster |
Los Angeles |
160,106 |
156,633 |
3,473 |
2.22% |
94.28 |
1,698.20 |
| 33 |
Hayward |
Alameda |
158,937 |
144,186 |
14,751 |
10.23% |
45.32 |
3,506.99 |
| 34 |
Palmdale |
Los Angeles |
157,356 |
152,750 |
4,606 |
3.02% |
105.96 |
1,485.05 |
| 35 |
Salinas |
Monterey |
157,218 |
150,441 |
6,777 |
4.50% |
23.18 |
6,782.48 |
| 36 |
Sunnyvale |
Santa Clara |
152,771 |
140,081 |
12,690 |
9.06% |
21.99 |
6,947.29 |
| 37 |
Pomona |
Los Angeles |
152,494 |
149,058 |
3,436 |
2.31% |
22.95 |
6,644.62 |
| 38 |
Escondido |
San Diego |
151,613 |
143,911 |
7,702 |
5.35% |
36.81 |
4,118.80 |
| 39 |
Torrance |
Los Angeles |
147,195 |
145,438 |
1,757 |
1.21% |
20.48 |
7,187.26 |
| 40 |
Pasadena |
Los Angeles |
142,059 |
137,122 |
4,937 |
3.60% |
22.97 |
6,184.55 |
| 41 |
Fullerton |
Orange |
140,721 |
135,161 |
5,560 |
4.11% |
22.35 |
6,296.24 |
| 42 |
Orange |
Orange |
140,504 |
136,416 |
4,088 |
3.00% |
24.8 |
5,665.48 |
| 43 |
Roseville |
Placer |
132,671 |
118,788 |
13,883 |
11.69% |
36.22 |
3,662.92 |
| 44 |
Visalia |
Tulare |
131,074 |
124,442 |
6,632 |
5.33% |
36.25 |
3,615.83 |
| 45 |
Thousand Oaks |
Ventura |
128,888 |
126,683 |
2,205 |
1.74% |
55.03 |
2,342.14 |
| 46 |
Concord |
Contra Costa |
128,726 |
122,067 |
6,659 |
5.46% |
30.55 |
4,213.62 |
| 47 |
Simi Valley |
Ventura |
126,327 |
124,237 |
2,090 |
1.68% |
41.48 |
3,045.49 |
| 48 |
Santa Clara |
Santa Clara |
125,948 |
116,468 |
9,480 |
8.14% |
18.41 |
6,841.28 |
|
East Los Angeles CDP |
Los Angeles |
125,415 |
126,496 |
-1,081 |
-0.85% |
7.45 |
16,834.23 |
| 49 |
Victorville |
San Bernardino |
122,265 |
115,903 |
6,362 |
5.49% |
73.18 |
1,670.74 |
| 50 |
Vallejo |
Solano |
121,299 |
115,942 |
5,357 |
4.62% |
30.67 |
3,954.97 |
| 51 |
Berkeley |
Alameda |
121,240 |
112,580 |
8,660 |
7.69% |
10.47 |
11,579.75 |
| 52 |
El Monte |
Los Angeles |
115,807 |
113,475 |
2,332 |
2.06% |
9.56 |
12,113.70 |
| 53 |
Fairfield |
Solano |
114,756 |
105,321 |
9,435 |
8.96% |
37.39 |
3,069.16 |
| 54 |
Carlsbad |
San Diego |
113,952 |
105,328 |
8,624 |
8.19% |
37.72 |
3,021.00 |
| 55 |
Downey |
Los Angeles |
113,267 |
111,772 |
1,495 |
1.34% |
12.41 |
9,127.07 |
| 56 |
Temecula |
Riverside |
113,054 |
100,097 |
12,957 |
12.94% |
30.15 |
3,749.72 |
| 57 |
Costa Mesa |
Orange |
112,822 |
109,960 |
2,862 |
2.60% |
15.65 |
7,209.07 |
| 58 |
Murrieta |
Riverside |
111,674 |
103,466 |
8,208 |
7.93% |
33.58 |
3,325.61 |
| 59 |
Antioch |
Contra Costa |
110,898 |
102,372 |
8,526 |
8.33% |
28.35 |
3,911.75 |
| 60 |
Inglewood |
Los Angeles |
110,654 |
109,673 |
981 |
0.89% |
9.07 |
12,200.00 |
| 61 |
Richmond |
Contra Costa |
109,813 |
103,701 |
6,112 |
5.89% |
30.07 |
3,651.91 |
| 62 |
San Buenaventura |
Ventura |
109,592 |
106,433 |
3,159 |
2.97% |
21.65 |
5,061.99 |
| 63 |
West Covina |
Los Angeles |
107,847 |
106,098 |
1,749 |
1.65% |
16.04 |
6,723.63 |
| 64 |
Clovis |
Fresno |
106,583 |
95,631 |
10,952 |
11.45% |
23.28 |
4,578.31 |
| 65 |
Daly City |
San Mateo |
106,472 |
101,123 |
5,349 |
5.29% |
7.66 |
13,899.74 |
| 66 |
Santa Maria |
Santa Barbara |
106,290 |
99,553 |
6,737 |
6.77% |
22.76 |
4,670.04 |
| 67 |
Norwalk |
Los Angeles |
106,178 |
105,549 |
629 |
0.60% |
9.71 |
10,934.91 |
| 68 |
Burbank |
Los Angeles |
104,447 |
103,340 |
1,107 |
1.07% |
17.34 |
6,023.47 |
| 69 |
San Mateo |
San Mateo |
103,959 |
97,207 |
6,752 |
6.95% |
12.13 |
8,570.40 |
| 70 |
El Cajon |
San Diego |
103,768 |
99,478 |
4,290 |
4.31% |
14.43 |
7,191.13 |
| 71 |
Jurupa Valley |
Riverside |
103,541 |
95,005 |
8,536 |
8.98% |
42.94 |
2,411.29 |
| 72 |
Rialto |
San Bernardino |
103,314 |
99,171 |
4,143 |
4.18% |
22.35 |
4,622.55 |
| 73 |
Vista |
San Diego |
101,659 |
93,834 |
7,825 |
8.34% |
18.68 |
5,442.13 |
| 74 |
Vacaville |
Solano |
98,303 |
92,428 |
5,875 |
6.36% |
28.37 |
3,465.03 |
| 75 |
Compton |
Los Angeles |
97,550 |
96,455 |
1,095 |
1.14% |
10.01 |
9,745.25 |
| 76 |
Mission Viejo |
Orange |
96,396 |
93,305 |
3,091 |
3.31% |
17.74 |
5,433.82 |
| 77 |
South Gate |
Los Angeles |
95,538 |
94,396 |
1,142 |
1.21% |
7.24 |
13,195.86 |
| 78 |
San Marcos |
San Diego |
95,261 |
83,781 |
11,480 |
13.70% |
24.37 |
3,908.95 |
|
Arden-Arcade CDP |
Sacramento |
93,993 |
92,186 |
1,807 |
1.96% |
17.83 |
5,271.62 |
| 79 |
Hesperia |
San Bernardino |
93,724 |
90,173 |
3,551 |
3.94% |
73.1 |
1,282.13 |
| 80 |
Carson |
Los Angeles |
92,797 |
91,714 |
1,083 |
1.18% |
18.72 |
4,957.10 |
| 81 |
Santa Monica |
Los Angeles |
92,478 |
89,736 |
2,742 |
3.06% |
8.41 |
10,996.20 |
| 82 |
Santa Barbara |
Santa Barbara |
91,930 |
88,410 |
3,520 |
3.98% |
19.47 |
4,721.62 |
| 83 |
Redding |
Shasta |
91,808 |
89,861 |
1,947 |
2.17% |
59.65 |
1,539.11 |
| 84 |
Chico |
Butte |
91,567 |
86,187 |
5,380 |
6.24% |
32.92 |
2,781.50 |
| 85 |
Westminster |
Orange |
91,565 |
89,701 |
1,864 |
2.08% |
10.05 |
9,110.95 |
| 86 |
San Leandro |
Alameda |
90,465 |
84,950 |
5,515 |
6.49% |
13.34 |
6,781.48 |
| 87 |
Tracy |
San Joaquin |
89,274 |
82,922 |
6,352 |
7.66% |
22 |
4,057.91 |
| 88 |
Livermore |
Alameda |
89,115 |
80,968 |
8,147 |
10.06% |
25.17 |
3,540.52 |
| 89 |
Menifee |
Riverside |
88,531 |
77,519 |
11,012 |
14.21% |
46.47 |
1,905.12 |
| 90 |
Indio |
Riverside |
88,488 |
76,036 |
12,452 |
16.38% |
29.18 |
3,032.49 |
| 91 |
Hawthorne |
Los Angeles |
88,031 |
84,293 |
3,738 |
4.43% |
6.08 |
14,478.78 |
| 92 |
Chino |
San Bernardino |
87,776 |
77,983 |
9,793 |
12.56% |
29.64 |
2,961.40 |
| 93 |
Citrus Heights |
Sacramento |
87,432 |
83,301 |
4,131 |
4.96% |
14.23 |
6,144.20 |
| 94 |
Whittier |
Los Angeles |
86,883 |
85,331 |
1,552 |
1.82% |
14.65 |
5,930.58 |
| 95 |
Newport Beach |
Orange |
86,688 |
85,186 |
1,502 |
1.76% |
23.8 |
3,642.35 |
| 96 |
Alhambra |
Los Angeles |
85,474 |
83,089 |
2,385 |
2.87% |
7.63 |
11,202.36 |
| 97 |
Redwood City |
San Mateo |
84,950 |
76,815 |
8,135 |
10.59% |
19.42 |
4,374.36 |
| 98 |
Hemet |
Riverside |
84,281 |
78,657 |
5,624 |
7.15% |
27.85 |
3,026.25 |
| 99 |
Lake Forest |
Orange |
83,240 |
77,264 |
5,976 |
7.73% |
17.82 |
4,671.16 |
| 100 |
Buena Park |
Orange |
83,156 |
80,530 |
2,626 |
3.26% |
10.52 |
7,904.56 |
| 101 |
Merced |
Merced |
82,594 |
78,958 |
3,636 |
4.60% |
23.32 |
3,541.77 |
| 102 |
Pleasanton |
Alameda |
82,270 |
70,285 |
11,985 |
17.05% |
24.11 |
3,412.28 |
| 103 |
Lakewood |
Los Angeles |
81,138 |
80,048 |
1,090 |
1.36% |
9.41 |
8,622.53 |
| 104 |
Mountain View |
Santa Clara |
80,447 |
74,066 |
6,381 |
8.62% |
12 |
6,703.92 |
| 105 |
Napa |
Napa |
80,416 |
76,915 |
3,501 |
4.55% |
17.84 |
4,507.62 |
| 106 |
Tustin |
Orange |
80,395 |
75,540 |
4,855 |
6.43% |
11.08 |
7,255.87 |
| 107 |
Alameda |
Alameda |
78,906 |
73,812 |
5,094 |
6.90% |
10.61 |
7,436.95 |
| 108 |
Chino Hills |
San Bernardino |
78,822 |
74,799 |
4,023 |
5.38% |
44.68 |
1,764.15 |
| 109 |
Bellflower |
Los Angeles |
77,790 |
76,616 |
1,174 |
1.53% |
6.12 |
12,710.78 |
| 110 |
Milpitas |
Santa Clara |
77,528 |
66,790 |
10,738 |
16.08% |
13.59 |
5,704.78 |
| 111 |
Folsom |
Sacramento |
77,271 |
72,203 |
5,068 |
7.02% |
21.95 |
3,520.32 |
| 112 |
Manteca |
San Joaquin |
76,908 |
67,096 |
9,812 |
14.62% |
17.73 |
4,337.73 |
| 113 |
Upland |
San Bernardino |
76,684 |
73,732 |
2,952 |
4.00% |
15.62 |
4,909.35 |
| 114 |
Baldwin Park |
Los Angeles |
76,464 |
75,390 |
1,074 |
1.42% |
6.63 |
11,533.03 |
| 115 |
Perris |
Riverside |
76,331 |
68,386 |
7,945 |
11.62% |
31.39 |
2,431.70 |
| 116 |
San Ramon |
Contra Costa |
75,639 |
72,148 |
3,491 |
4.84% |
18.06 |
4,188.21 |
| 117 |
Union City |
Alameda |
75,322 |
69,516 |
5,806 |
8.35% |
19.47 |
3,868.62 |
| 118 |
Turlock |
Stanislaus |
72,796 |
68,549 |
4,247 |
6.20% |
16.93 |
4,299.82 |
| 119 |
Apple Valley |
San Bernardino |
72,553 |
69,135 |
3,418 |
4.94% |
73.19 |
991.30 |
| 120 |
Rancho Cordova |
Sacramento |
72,326 |
64,776 |
7,550 |
11.66% |
33.51 |
2,158.34 |
| 121 |
Redlands |
San Bernardino |
71,288 |
68,747 |
2,541 |
3.70% |
36.13 |
1,973.10 |
| 122 |
Lynwood |
Los Angeles |
71,187 |
69,772 |
1,415 |
2.03% |
4.84 |
14,708.06 |
| 123 |
Pittsburg |
Contra Costa |
70,679 |
63,264 |
7,415 |
11.72% |
17.22 |
4,104.47 |
| 124 |
Walnut Creek |
Contra Costa |
69,122 |
64,173 |
4,949 |
7.71% |
19.76 |
3,498.08 |
| 125 |
Yorba Linda |
Orange |
68,235 |
64,234 |
4,001 |
6.23% |
19.48 |
3,502.82 |
| 126 |
Davis |
Yolo |
68,111 |
65,622 |
2,489 |
3.79% |
9.89 |
6,886.86 |
| 127 |
Redondo Beach |
Los Angeles |
67,867 |
66,748 |
1,119 |
1.68% |
6.2 |
10,946.29 |
| 128 |
Camarillo |
Ventura |
67,363 |
65,201 |
2,162 |
3.32% |
19.53 |
3,449.21 |
| 129 |
Palo Alto |
Santa Clara |
67,024 |
64,403 |
2,621 |
4.07% |
23.88 |
2,806.70 |
| 130 |
South San Francisco |
San Mateo |
66,980 |
63,632 |
3,348 |
5.26% |
9.14 |
7,328.23 |
| 131 |
Yuba City |
Sutter |
66,845 |
64,925 |
1,920 |
2.96% |
14.58 |
4,584.71 |
| 132 |
Laguna Niguel |
Orange |
65,328 |
62,979 |
2,349 |
3.73% |
14.83 |
4,405.12 |
| 133 |
San Clemente |
Orange |
65,309 |
63,522 |
1,787 |
2.81% |
18.71 |
3,490.59 |
| 134 |
Lodi |
San Joaquin |
64,641 |
62,134 |
2,507 |
4.03% |
13.61 |
4,749.52 |
| 135 |
Santa Cruz |
Santa Cruz |
64,465 |
59,946 |
4,519 |
7.54% |
12.74 |
5,060.05 |
| 136 |
Madera |
Madera |
64,444 |
61,416 |
3,028 |
4.93% |
15.79 |
4,081.32 |
| 137 |
Lake Elsinore |
Riverside |
64,205 |
51,821 |
12,384 |
23.90% |
36.21 |
1,773.13 |
|
Carmichael CDP |
Sacramento |
63,712 |
61,762 |
1,950 |
3.16% |
13.53 |
4,708.94 |
| 138 |
Pico Rivera |
Los Angeles |
63,635 |
62,942 |
693 |
1.10% |
8.3 |
7,666.87 |
| 139 |
Montebello |
Los Angeles |
63,335 |
62,500 |
835 |
1.34% |
8.33 |
7,603.24 |
|
Florence-Graham CDP |
Los Angeles |
63,177 |
63,387 |
-210 |
-0.33% |
3.58 |
17,647.21 |
| 140 |
Encinitas |
San Diego |
63,131 |
59,518 |
3,613 |
6.07% |
18.81 |
3,356.25 |
| 141 |
Rocklin |
Placer |
62,787 |
56,974 |
5,813 |
10.20% |
19.54 |
3,213.25 |
| 142 |
Tulare |
Tulare |
62,779 |
59,278 |
3,501 |
5.91% |
20.93 |
2,999.47 |
|
Castro Valley CDP |
Alameda |
62,044 |
61,388 |
656 |
1.07% |
16.63 |
3,730.85 |
| 143 |
La Habra |
Orange |
61,664 |
60,239 |
1,425 |
2.37% |
7.37 |
8,366.89 |
| 144 |
Eastvale |
Riverside |
61,151 |
53,668 |
7,483 |
13.94% |
12.66 |
4,830.25 |
| 145 |
National City |
San Diego |
61,147 |
58,582 |
2,565 |
4.38% |
7.28 |
8,399.31 |
| 146 |
Monterey Park |
Los Angeles |
61,075 |
60,269 |
806 |
1.34% |
7.67 |
7,962.84 |
| 147 |
Cupertino |
Santa Clara |
60,643 |
58,302 |
2,341 |
4.02% |
11.26 |
5,385.70 |
| 148 |
Brentwood |
Contra Costa |
60,532 |
51,481 |
9,051 |
17.58% |
14.79 |
4,092.77 |
| 149 |
Petaluma |
Sonoma |
60,530 |
57,941 |
2,589 |
4.47% |
14.38 |
4,209.32 |
| 150 |
Gardena |
Los Angeles |
60,048 |
58,829 |
1,219 |
2.07% |
5.83 |
10,299.83 |
| 151 |
La Mesa |
San Diego |
59,948 |
57,065 |
2,883 |
5.05% |
9.08 |
6,602.20 |
| 152 |
Dublin |
Alameda |
59,583 |
46,036 |
13,547 |
29.43% |
14.91 |
3,996.18 |
|
South Whittier CDP |
Los Angeles |
59,358 |
57,156 |
2,202 |
3.85% |
5.34 |
11,115.73 |
| 153 |
Woodland |
Yolo |
59,068 |
55,468 |
3,600 |
6.49% |
15.3 |
3,860.65 |
| 154 |
Porterville |
Tulare |
58,978 |
54,165 |
4,813 |
8.89% |
17.61 |
3,349.12 |
| 155 |
San Rafael |
Marin |
58,954 |
57,713 |
1,241 |
2.15% |
16.47 |
3,579.48 |
| 156 |
Huntington Park |
Los Angeles |
58,879 |
58,114 |
765 |
1.32% |
3.01 |
19,561.13 |
| 157 |
Arcadia |
Los Angeles |
58,523 |
56,364 |
2,159 |
3.83% |
10.93 |
5,354.35 |
| 158 |
Santee |
San Diego |
57,834 |
53,413 |
4,421 |
8.28% |
16.24 |
3,561.21 |
| 159 |
Diamond Bar |
Los Angeles |
56,793 |
55,544 |
1,249 |
2.25% |
14.88 |
3,816.73 |
| 160 |
Fountain Valley |
Orange |
56,529 |
55,313 |
1,216 |
2.20% |
9.02 |
6,267.07 |
| 161 |
Novato |
Marin |
56,004 |
51,904 |
4,100 |
7.90% |
27.44 |
2,040.96 |
| 162 |
Hanford |
Kings |
55,547 |
53,967 |
1,580 |
2.93% |
16.59 |
3,348.22 |
|
Hacienda Heights CDP |
Los Angeles |
55,158 |
54,038 |
1,120 |
2.07% |
11.18 |
4,933.63 |
| 163 |
Gilroy |
Santa Clara |
55,069 |
48,821 |
6,248 |
12.80% |
16.15 |
3,409.85 |
| 164 |
Highland |
San Bernardino |
54,939 |
53,104 |
1,835 |
3.46% |
18.76 |
2,928.52 |
| 165 |
Paramount |
Los Angeles |
54,909 |
54,098 |
811 |
1.50% |
4.73 |
11,608.67 |
| 166 |
Colton |
San Bernardino |
54,712 |
52,154 |
2,558 |
4.90% |
15.32 |
3,571.28 |
| 167 |
Rosemead |
Los Angeles |
54,500 |
53,764 |
736 |
1.37% |
5.16 |
10,562.02 |
| 168 |
Cathedral City |
Riverside |
54,056 |
51,200 |
2,856 |
5.58% |
21.5 |
2,514.23 |
| 169 |
Watsonville |
Santa Cruz |
53,796 |
51,199 |
2,597 |
5.07% |
6.69 |
8,041.26 |
| 170 |
Yucaipa |
San Bernardino |
53,309 |
51,367 |
1,942 |
3.78% |
27.89 |
1,911.40 |
| 171 |
West Sacramento |
Yolo |
52,981 |
48,744 |
4,237 |
8.69% |
21.43 |
2,472.28 |
| 172 |
Delano |
Kern |
52,707 |
53,041 |
-334 |
-0.63% |
14.3 |
3,685.80 |
| 173 |
Palm Desert |
Riverside |
52,231 |
48,445 |
3,786 |
7.82% |
26.81 |
1,948.19 |
| 174 |
Placentia |
Orange |
52,228 |
50,533 |
1,695 |
3.35% |
6.57 |
7,949.47 |
| 175 |
Glendora |
Los Angeles |
51,851 |
50,073 |
1,778 |
3.55% |
19.39 |
2,674.11 |
| 176 |
Aliso Viejo |
Orange |
51,424 |
47,823 |
3,601 |
7.53% |
7.47 |
6,884.07 |
|
Florin CDP |
Sacramento |
50,899 |
47,513 |
3,386 |
7.13% |
8.7 |
5,850.46 |
| 177 |
Cerritos |
Los Angeles |
50,555 |
49,041 |
1,514 |
3.09% |
8.73 |
5,790.95 |
|
Rowland Heights CDP |
Los Angeles |
50,440 |
48,993 |
1,447 |
2.95% |
13.08 |
3,856.27 |
| 178 |
Poway |
San Diego |
50,077 |
47,811 |
2,266 |
4.74% |
39.08 |
1,281.40 |
| 179 |
Azusa |
Los Angeles |
49,628 |
46,361 |
3,267 |
7.05% |
9.66 |
5,137.47 |
| 180 |
La Mirada |
Los Angeles |
49,216 |
48,527 |
689 |
1.42% |
7.84 |
6,277.55 |
| 181 |
Rancho Santa Margarita |
Orange |
48,969 |
47,853 |
1,116 |
2.33% |
12.96 |
3,778.47 |
| 182 |
Cypress |
Orange |
48,906 |
47,802 |
1,104 |
2.31% |
6.58 |
7,432.52 |
| 183 |
Covina |
Los Angeles |
48,549 |
47,796 |
753 |
1.58% |
7.03 |
6,905.97 |
| 184 |
Ceres |
Stanislaus |
48,278 |
45,417 |
2,861 |
6.30% |
8.01 |
6,027.22 |
|
Antelope CDP |
Sacramento |
47,763 |
45,770 |
1,993 |
4.35% |
6.84 |
6,982.89 |
| 185 |
Palm Springs |
Riverside |
47,689 |
44,552 |
3,137 |
7.04% |
94.12 |
506.68 |
| 186 |
San Luis Obispo |
San Luis Obispo |
47,536 |
45,119 |
2,417 |
5.36% |
12.78 |
3,719.56 |
| 187 |
San Jacinto |
Riverside |
47,413 |
44,199 |
3,214 |
7.27% |
25.72 |
1,843.43 |
| 188 |
Lincoln |
Placer |
47,030 |
42,819 |
4,211 |
9.83% |
20.11 |
2,338.64 |
|
North Highlands CDP |
Sacramento |
46,376 |
42,694 |
3,682 |
8.62% |
8.83 |
5,252.10 |
| 189 |
Newark |
Alameda |
45,810 |
42,573 |
3,237 |
7.60% |
13.87 |
3,302.81 |
| 190 |
Beaumont |
Riverside |
45,349 |
36,877 |
8,472 |
22.97% |
30.91 |
1,467.13 |
| 191 |
Coachella |
Riverside |
44,953 |
40,704 |
4,249 |
10.44% |
28.95 |
1,552.78 |
| 192 |
Danville |
Contra Costa |
44,631 |
42,039 |
2,592 |
6.17% |
18.03 |
2,475.37 |
|
Altadena CDP |
Los Angeles |
44,621 |
42,777 |
1,844 |
4.31% |
8.71 |
5,122.96 |
| 193 |
El Centro |
Imperial |
44,201 |
42,598 |
1,603 |
3.76% |
11.08 |
3,989.26 |
| 194 |
Morgan Hill |
Santa Clara |
44,155 |
37,882 |
6,273 |
16.56% |
12.88 |
3,428.18 |
| 195 |
Lompoc |
Santa Barbara |
43,712 |
42,434 |
1,278 |
3.01% |
11.6 |
3,768.28 |
|
El Dorado Hills CDP |
El Dorado |
43,264 |
42,108 |
1,156 |
2.75% |
48.45 |
892.96 |
| 196 |
San Bruno |
San Mateo |
42,957 |
41,114 |
1,843 |
4.48% |
5.48 |
7,838.87 |
| 197 |
Bell Gardens |
Los Angeles |
42,806 |
42,072 |
734 |
1.74% |
2.46 |
17,400.81 |
| 198 |
Rohnert Park |
Sonoma |
42,622 |
40,971 |
1,651 |
4.03% |
7 |
6,088.86 |
| 199 |
Brea |
Orange |
42,471 |
39,282 |
3,189 |
8.12% |
12.08 |
3,515.81 |
| 200 |
Rancho Palos Verdes |
Los Angeles |
42,435 |
41,643 |
792 |
1.90% |
13.46 |
3,152.67 |
| 201 |
La Quinta |
Riverside |
40,956 |
37,467 |
3,489 |
9.31% |
35.12 |
1,166.17 |
| 202 |
Campbell |
Santa Clara |
40,939 |
39,349 |
1,590 |
4.04% |
5.8 |
7,058.45 |
| 203 |
Oakley |
Contra Costa |
40,622 |
35,432 |
5,190 |
14.65% |
15.85 |
2,562.90 |
| 204 |
San Gabriel |
Los Angeles |
40,404 |
39,718 |
686 |
1.73% |
4.14 |
9,759.42 |
| 205 |
La Puente |
Los Angeles |
40,377 |
39,816 |
561 |
1.41% |
3.48 |
11,602.59 |
| 206 |
Calexico |
Imperial |
40,232 |
38,572 |
1,660 |
4.30% |
8.39 |
4,795.23 |
| 207 |
Culver City |
Los Angeles |
39,364 |
38,883 |
481 |
1.24% |
5.11 |
7,703.33 |
| 208 |
Pacifica |
San Mateo |
39,062 |
37,234 |
1,828 |
4.91% |
12.66 |
3,085.47 |
| 209 |
Montclair |
San Bernardino |
38,944 |
36,664 |
2,280 |
6.22% |
5.52 |
7,055.07 |
| 210 |
Stanton |
Orange |
38,644 |
38,186 |
458 |
1.20% |
3.15 |
12,267.94 |
| 211 |
Martinez |
Contra Costa |
38,259 |
35,824 |
2,435 |
6.80% |
12.13 |
3,154.08 |
| 212 |
Hollister |
San Benito |
37,833 |
34,928 |
2,905 |
8.32% |
7.29 |
5,189.71 |
| 213 |
Los Banos |
Merced |
37,643 |
35,972 |
1,671 |
4.65% |
9.99 |
3,768.07 |
| 214 |
Monrovia |
Los Angeles |
37,126 |
36,590 |
536 |
1.46% |
13.6 |
2,729.85 |
|
La Presa CDP |
San Diego |
36,875 |
34,169 |
2,706 |
7.92% |
5.5 |
6,704.55 |
| 215 |
West Hollywood |
Los Angeles |
36,698 |
34,399 |
2,299 |
6.68% |
1.89 |
19,416.93 |
| 216 |
Moorpark |
Ventura |
36,481 |
34,421 |
2,060 |
5.98% |
12.58 |
2,899.92 |
| 217 |
Temple City |
Los Angeles |
36,365 |
35,558 |
807 |
2.27% |
4.01 |
9,068.58 |
| 218 |
San Juan Capistrano |
Orange |
36,276 |
34,593 |
1,683 |
4.87% |
14.12 |
2,569.12 |
| 219 |
Claremont |
Los Angeles |
36,059 |
34,926 |
1,133 |
3.24% |
13.35 |
2,701.05 |
| 220 |
Wildomar |
Riverside |
36,042 |
32,176 |
3,866 |
12.02% |
23.69 |
1,521.40 |
| 221 |
Bell |
Los Angeles |
35,864 |
35,477 |
387 |
1.09% |
2.5 |
14,345.60 |
| 222 |
Manhattan Beach |
Los Angeles |
35,741 |
35,135 |
606 |
1.72% |
3.94 |
9,071.32 |
| 223 |
Pleasant Hill |
Contra Costa |
34,853 |
33,152 |
1,701 |
5.13% |
7.07 |
4,929.70 |
|
Orangevale CDP |
Sacramento |
34,836 |
33,960 |
876 |
2.58% |
11.52 |
3,023.96 |
| 224 |
Beverly Hills |
Los Angeles |
34,687 |
34,109 |
578 |
1.69% |
5.71 |
6,074.78 |
| 225 |
San Dimas |
Los Angeles |
34,338 |
33,371 |
967 |
2.90% |
15.04 |
2,283.11 |
| 226 |
Seaside |
Monterey |
34,312 |
33,025 |
1,287 |
3.90% |
9.24 |
3,713.42 |
| 227 |
Foster City |
San Mateo |
34,175 |
30,567 |
3,608 |
11.80% |
3.76 |
9,089.10 |
| 228 |
Dana Point |
Orange |
34,012 |
33,351 |
661 |
1.98% |
6.5 |
5,232.62 |
| 229 |
Menlo Park |
San Mateo |
33,888 |
32,026 |
1,862 |
5.81% |
9.79 |
3,461.49 |
|
Oildale CDP |
Kern |
33,842 |
32,684 |
1,158 |
3.54% |
6.53 |
5,182.54 |
| 230 |
Adelanto |
San Bernardino |
33,391 |
31,765 |
1,626 |
5.12% |
56.01 |
596.16 |
| 231 |
Lawndale |
Los Angeles |
33,145 |
32,769 |
376 |
1.15% |
1.97 |
16,824.87 |
|
Foothill Farms CDP |
Sacramento |
33,090 |
33,121 |
-31 |
-0.09% |
4.2 |
7,878.57 |
|
Westmont CDP |
Los Angeles |
32,566 |
31,853 |
713 |
2.24% |
1.85 |
17,603.24 |
| 232 |
La Verne |
Los Angeles |
32,389 |
31,063 |
1,326 |
4.27% |
8.43 |
3,842.11 |
| 233 |
El Paso de Robles (Paso Robles) |
San Luis Obispo |
31,907 |
29,793 |
2,114 |
7.10% |
19.12 |
1,668.78 |
|
Fallbrook CDP |
San Diego |
31,573 |
30,534 |
1,039 |
3.40% |
17.53 |
1,801.08 |
|
Fair Oaks CDP |
Sacramento |
31,537 |
30,912 |
625 |
2.02% |
10.79 |
2,922.80 |
| 234 |
Laguna Hills |
Orange |
31,509 |
30,344 |
1,165 |
3.84% |
6.67 |
4,723.99 |
| 235 |
Banning |
Riverside |
31,026 |
29,603 |
1,423 |
4.81% |
23.1 |
1,343.12 |
| 236 |
Goleta |
Santa Barbara |
30,850 |
29,888 |
962 |
3.22% |
7.9 |
3,905.06 |
| 237 |
Saratoga |
Santa Clara |
30,767 |
29,926 |
841 |
2.81% |
12.38 |
2,485.22 |
| 238 |
Los Altos |
Santa Clara |
30,561 |
28,976 |
1,585 |
5.47% |
6.49 |
4,708.94 |
| 239 |
Los Gatos |
Santa Clara |
30,545 |
29,413 |
1,132 |
3.85% |
11.08 |
2,756.77 |
| 240 |
San Pablo |
Contra Costa |
30,536 |
29,139 |
1,397 |
4.79% |
2.63 |
11,610.65 |
|
Spring Valley CDP |
San Diego |
30,392 |
28,205 |
2,187 |
7.75% |
7.17 |
4,238.77 |
| 241 |
Santa Paula |
Ventura |
30,335 |
29,321 |
1,014 |
3.46% |
4.59 |
6,608.93 |
| 242 |
Atascadero |
San Luis Obispo |
30,330 |
28,310 |
2,020 |
7.14% |
25.64 |
1,182.92 |
| 243 |
Burlingame |
San Mateo |
30,301 |
28,806 |
1,495 |
5.19% |
4.41 |
6,870.98 |
| 244 |
Walnut |
Los Angeles |
30,047 |
29,172 |
875 |
3.00% |
8.99 |
3,342.27 |
|
Orcutt CDP |
Santa Barbara |
29,908 |
28,905 |
1,003 |
3.47% |
11.12 |
2,689.57 |
| 245 |
San Carlos |
San Mateo |
29,797 |
28,406 |
1,391 |
4.90% |
5.54 |
5,378.52 |
| 246 |
East Palo Alto |
San Mateo |
29,684 |
28,155 |
1,529 |
5.43% |
2.51 |
11,826.29 |
| 247 |
Suisun City |
Solano |
29,505 |
28,111 |
1,394 |
4.96% |
4.11 |
7,178.83 |
| 248 |
Atwater |
Merced |
29,270 |
28,168 |
1,102 |
3.91% |
6.09 |
4,806.24 |
| 249 |
Ridgecrest |
Kern |
28,701 |
27,616 |
1,085 |
3.93% |
20.77 |
1,381.85 |
| 250 |
Desert Hot Springs |
Riverside |
28,492 |
25,938 |
2,554 |
9.85% |
23.62 |
1,206.27 |
| 251 |
Monterey |
Monterey |
28,454 |
27,810 |
644 |
2.32% |
8.47 |
3,359.39 |
| 252 |
Benicia |
Solano |
28,174 |
26,997 |
1,177 |
4.36% |
12.93 |
2,178.96 |
|
French Valley CDP |
Riverside |
27,752 |
23,067 |
4,685 |
20.31% |
10.87 |
2,553.08 |
| 253 |
Maywood |
Los Angeles |
27,633 |
27,395 |
238 |
0.87% |
1.18 |
23,417.80 |
| 254 |
Windsor |
Sonoma |
27,555 |
26,801 |
754 |
2.81% |
7.27 |
3,790.23 |
| 255 |
Imperial Beach |
San Diego |
27,418 |
26,324 |
1,094 |
4.16% |
4.16 |
6,590.87 |
| 256 |
Eureka |
Humboldt |
27,226 |
27,191 |
35 |
0.13% |
9.38 |
2,902.56 |
|
West Whittier-Los Nietos CDP |
Los Angeles |
27,114 |
25,540 |
1,574 |
6.16% |
2.52 |
10,759.52 |
| 257 |
Belmont |
San Mateo |
27,081 |
25,835 |
1,246 |
4.82% |
4.62 |
5,861.69 |
| 258 |
Lemon Grove |
San Diego |
26,860 |
25,320 |
1,540 |
6.08% |
3.88 |
6,922.68 |
|
Ladera Ranch CDP |
Orange |
26,714 |
22,980 |
3,734 |
16.25% |
4.9 |
5,451.84 |
| 259 |
Norco |
Riverside |
26,714 |
27,063 |
-349 |
-1.29% |
13.96 |
1,913.61 |
| 260 |
Paradise |
Butte |
26,551 |
26,218 |
333 |
1.27% |
18.31 |
1,450.08 |
|
North Tustin CDP |
Orange |
26,454 |
24,917 |
1,537 |
6.17% |
6.67 |
3,966.12 |
|
Vineyard CDP |
Sacramento |
26,452 |
24,836 |
1,616 |
6.51% |
17.21 |
1,537.01 |
| 261 |
Wasco |
Kern |
26,395 |
25,545 |
850 |
3.33% |
9.43 |
2,799.05 |
|
Isla Vista CDP |
Santa Barbara |
26,275 |
23,096 |
3,179 |
13.76% |
1.85 |
14,202.70 |
| 262 |
Brawley |
Imperial |
26,149 |
24,953 |
1,196 |
4.79% |
7.68 |
3,404.82 |
| 263 |
Lafayette |
Contra Costa |
26,103 |
23,893 |
2,210 |
9.25% |
15.22 |
1,715.05 |
| 264 |
Twentynine Palms |
San Bernardino |
26,049 |
25,048 |
1,001 |
4.00% |
59.14 |
440.46 |
| 265 |
Coronado |
San Diego |
25,952 |
18,912 |
7,040 |
37.23% |
7.93 |
3,272.64 |
| 266 |
South Pasadena |
Los Angeles |
25,913 |
25,619 |
294 |
1.15% |
3.41 |
7,599.12 |
| 267 |
Lemoore |
Kings |
25,785 |
24,531 |
1,254 |
5.11% |
8.52 |
3,026.41 |
| 268 |
Galt |
Sacramento |
25,633 |
23,647 |
1,986 |
8.40% |
5.93 |
4,322.60 |
| 269 |
Soledad |
Monterey |
25,622 |
25,738 |
-116 |
-0.45% |
4.41 |
5,809.98 |
| 270 |
Reedley |
Fresno |
25,582 |
24,194 |
1,388 |
5.74% |
5.08 |
5,035.83 |
| 271 |
El Cerrito |
Contra Costa |
25,400 |
23,549 |
1,851 |
7.86% |
3.69 |
6,883.47 |
| 272 |
Hercules |
Contra Costa |
25,360 |
24,060 |
1,300 |
5.40% |
6.21 |
4,083.74 |
| 273 |
Sanger |
Fresno |
25,007 |
24,270 |
737 |
3.04% |
5.52 |
4,530.25 |
|
San Lorenzo CDP |
Alameda |
24,891 |
23,452 |
1,439 |
6.14% |
2.76 |
9,018.48 |
|
Bloomington CDP |
San Bernardino |
24,864 |
23,851 |
1,013 |
4.25% |
5.99 |
4,150.92 |
| 274 |
San Fernando |
Los Angeles |
24,717 |
23,645 |
1,072 |
4.53% |
2.37 |
10,429.11 |
|
Temescal Valley CDP |
Riverside |
24,654 |
22,535 |
2,119 |
9.40% |
19.3 |
1,277.41 |
| 275 |
Selma |
Fresno |
24,597 |
23,219 |
1,378 |
5.93% |
5.14 |
4,785.41 |
| 276 |
Seal Beach |
Orange |
24,440 |
24,168 |
272 |
1.13% |
11.29 |
2,164.75 |
| 277 |
Riverbank |
Stanislaus |
24,389 |
22,678 |
1,711 |
7.54% |
4.09 |
5,963.08 |
|
Ashland CDP |
Alameda |
24,226 |
21,925 |
2,301 |
10.49% |
1.84 |
13,166.30 |
| 278 |
Calabasas |
Los Angeles |
24,176 |
23,058 |
1,118 |
4.85% |
12.9 |
1,874.11 |
| 279 |
Loma Linda |
San Bernardino |
24,129 |
23,261 |
868 |
3.73% |
7.52 |
3,208.64 |
| 280 |
Cudahy |
Los Angeles |
24,098 |
23,805 |
293 |
1.23% |
1.18 |
20,422.03 |
|
West Puente Valley CDP |
Los Angeles |
24,077 |
22,636 |
1,441 |
6.37% |
1.76 |
13,680.11 |
|
Valinda CDP |
Los Angeles |
24,026 |
22,822 |
1,204 |
5.28% |
2.01 |
11,953.23 |
| 281 |
Dinuba |
Tulare |
23,961 |
21,453 |
2,508 |
11.69% |
6.47 |
3,703.40 |
| 282 |
Barstow |
San Bernardino |
23,835 |
22,639 |
1,196 |
5.28% |
41.38 |
576.00 |
|
Rosemont CDP |
Sacramento |
23,515 |
22,681 |
834 |
3.68% |
4.35 |
5,405.75 |
| 283 |
Laguna Beach |
Orange |
23,190 |
22,723 |
467 |
2.06% |
8.85 |
2,620.34 |
| 284 |
Millbrae |
San Mateo |
22,661 |
21,532 |
1,129 |
5.24% |
3.25 |
6,972.62 |
| 285 |
Corcoran |
Kings |
22,626 |
24,813 |
-2,187 |
-8.81% |
7.47 |
3,028.92 |
|
West Rancho Dominguez CDP |
Los Angeles |
22,605 |
5,669 |
16,936 |
298.75% |
1.652 |
13,683.41 |
| 286 |
Oakdale |
Stanislaus |
22,564 |
20,675 |
1,889 |
9.14% |
6.04 |
3,735.76 |
|
Bay Point CDP |
Contra Costa |
22,473 |
21,349 |
1,124 |
5.26% |
6.55 |
3,430.99 |
|
Granite Bay CDP |
Placer |
22,387 |
20,402 |
1,985 |
9.73% |
21.53 |
1,039.80 |
| 287 |
Port Hueneme |
Ventura |
22,277 |
21,723 |
554 |
2.55% |
4.45 |
5,006.07 |
| 288 |
Lathrop |
San Joaquin |
22,073 |
18,023 |
4,050 |
22.47% |
21.93 |
1,006.52 |
|
Rancho San Diego CDP |
San Diego |
22,062 |
21,208 |
854 |
4.03% |
8.7 |
2,535.86 |
|
Lennox CDP |
Los Angeles |
21,850 |
22,753 |
-903 |
-3.97% |
1.09 |
20,045.87 |
|
Ramona CDP |
San Diego |
21,824 |
20,292 |
1,532 |
7.55% |
38.41 |
568.19 |
| 289 |
Duarte |
Los Angeles |
21,801 |
21,321 |
480 |
2.25% |
6.69 |
3,258.74 |
| 290 |
Patterson |
Stanislaus |
21,776 |
20,413 |
1,363 |
6.68% |
5.95 |
3,659.83 |
| 291 |
South Lake Tahoe |
El Dorado |
21,717 |
21,403 |
314 |
1.47% |
10.16 |
2,137.50 |
| 292 |
Marina |
Monterey |
21,688 |
19,718 |
1,970 |
9.99% |
8.88 |
2,442.34 |
| 293 |
Yucca Valley |
San Bernardino |
21,652 |
20,700 |
952 |
4.60% |
40.02 |
541.03 |
|
West Carson CDP |
Los Angeles |
21,437 |
21,699 |
-262 |
-1.21% |
2.27 |
9,443.61 |
|
Lakeside CDP |
San Diego |
21,413 |
20,648 |
765 |
3.70% |
6.9 |
3,103.33 |
| 294 |
Arvin |
Kern |
21,086 |
19,304 |
1,782 |
9.23% |
4.82 |
4,374.69 |
|
South San Jose Hills CDP |
Los Angeles |
21,015 |
20,551 |
464 |
2.26% |
1.51 |
13,917.22 |
| 295 |
South El Monte |
Los Angeles |
20,883 |
20,116 |
767 |
3.81% |
2.84 |
7,353.17 |
| 296 |
Agoura Hills |
Los Angeles |
20,745 |
20,330 |
415 |
2.04% |
7.79 |
2,663.03 |
|
Winter Gardens CDP |
San Diego |
20,703 |
20,631 |
72 |
0.35% |
4.43 |
4,673.36 |
| 297 |
Lomita |
Los Angeles |
20,693 |
20,256 |
437 |
2.16% |
1.91 |
10,834.03 |
|
Willowbrook CDP |
Los Angeles |
20,685 |
35,983 |
-15,298 |
-42.51% |
3.76 |
5,501.33 |
| 298 |
American Canyon |
Napa |
20,452 |
19,454 |
998 |
5.13% |
4.84 |
4,225.62 |
| 299 |
La Cañada Flintridge |
Los Angeles |
20,447 |
20,246 |
201 |
0.99% |
8.63 |
2,369.29 |
|
Casa de Oro-Mount Helix CDP |
San Diego |
20,222 |
18,762 |
1,460 |
7.78% |
6.85 |
2,952.12 |
|
La Crescenta-Montrose CDP |
Los Angeles |
19,940 |
19,653 |
287 |
1.46% |
3.43 |
5,813.41 |
| 300 |
Dixon |
Solano |
19,806 |
18,351 |
1,455 |
7.93% |
7 |
2,829.43 |
| 301 |
Hermosa Beach |
Los Angeles |
19,789 |
19,506 |
283 |
1.45% |
1.43 |
13,838.46 |
| 302 |
Blythe |
Riverside |
19,693 |
20,817 |
-1,124 |
-5.40% |
26.19 |
751.93 |
| 303 |
Albany |
Alameda |
19,688 |
18,539 |
1,149 |
6.20% |
1.79 |
10,998.88 |
|
Rosamond CDP |
Kern |
19,540 |
18,150 |
1,390 |
7.66% |
52.12 |
374.90 |
| 304 |
Orinda |
Contra Costa |
19,470 |
17,643 |
1,827 |
10.36% |
12.68 |
1,535.49 |
|
Cameron Park CDP |
El Dorado |
19,437 |
18,228 |
1,209 |
6.63% |
11.11 |
1,749.50 |
|
Stevenson Ranch CDP |
Los Angeles |
19,408 |
17,557 |
1,851 |
10.54% |
6.36 |
3,051.57 |
|
Castaic CDP |
Los Angeles |
19,369 |
19,015 |
354 |
1.86% |
7.26 |
2,667.91 |
| 305 |
Pinole |
Contra Costa |
19,293 |
18,390 |
903 |
4.91% |
5.32 |
3,626.50 |
|
East Hemet CDP |
Riverside |
19,180 |
17,418 |
1,762 |
10.12% |
5.21 |
3,681.38 |
|
Mead Valley CDP |
Riverside |
19,110 |
18,510 |
600 |
3.24% |
19.17 |
996.87 |
| 306 |
Oroville |
Butte |
19,033 |
15,546 |
3,487 |
22.43% |
12.99 |
1,465.20 |
| 307 |
Shafter |
Kern |
18,945 |
16,988 |
1,957 |
11.52% |
27.94 |
678.06 |
|
Prunedale CDP |
Monterey |
18,932 |
17,560 |
1,372 |
7.81% |
46.05 |
411.12 |
|
Linda CDP |
Yuba |
18,256 |
17,773 |
483 |
2.72% |
8.55 |
2,135.20 |
| 308 |
Chowchilla |
Madera |
18,236 |
18,720 |
-484 |
-2.59% |
7.66 |
2,380.68 |
| 309 |
Rancho Mirage |
Riverside |
18,194 |
17,218 |
976 |
5.67% |
24.45 |
744.13 |
| 310 |
Arroyo Grande |
San Luis Obispo |
18,097 |
17,252 |
845 |
4.90% |
5.84 |
3,098.80 |
|
Live Oak CDP |
Santa Cruz |
18,038 |
17,158 |
880 |
5.13% |
3.24 |
5,567.28 |
| 311 |
Santa Fe Springs |
Los Angeles |
18,027 |
16,223 |
1,804 |
11.12% |
8.87 |
2,032.36 |
| 312 |
Arcata |
Humboldt |
17,974 |
17,231 |
743 |
4.31% |
9.1 |
1,975.16 |
| 313 |
Greenfield |
Monterey |
17,428 |
16,330 |
1,098 |
6.72% |
2.14 |
8,143.93 |
| 314 |
Moraga |
Contra Costa |
17,416 |
16,016 |
1,400 |
8.74% |
9.43 |
1,846.87 |
| 315 |
Imperial |
Imperial |
17,203 |
14,758 |
2,445 |
16.57% |
5.86 |
2,935.67 |
|
Vincent CDP |
Los Angeles |
17,006 |
15,922 |
1,084 |
6.81% |
1.47 |
11,568.71 |
| 316 |
El Segundo |
Los Angeles |
16,893 |
16,654 |
239 |
1.44% |
5.46 |
3,093.96 |
| 317 |
Artesia |
Los Angeles |
16,874 |
16,522 |
352 |
2.13% |
1.62 |
10,416.05 |
|
Bostonia CDP |
San Diego |
16,787 |
15,379 |
1,408 |
9.16% |
1.93 |
8,697.93 |
|
Nipomo CDP |
San Luis Obispo |
16,727 |
16,714 |
13 |
0.08% |
14.85 |
1,126.40 |
| 318 |
Coalinga |
Fresno |
16,598 |
13,380 |
3,218 |
24.05% |
6.12 |
2,712.09 |
| 319 |
Truckee |
Nevada |
16,391 |
16,180 |
211 |
1.30% |
32.32 |
507.15 |
|
Alamo CDP |
Contra Costa |
16,301 |
14,570 |
1,731 |
11.88% |
9.67 |
1,685.73 |
|
McKinleyville CDP |
Humboldt |
16,291 |
15,177 |
1,114 |
7.34% |
20.8 |
783.22 |
| 320 |
Laguna Woods |
Orange |
16,272 |
16,192 |
80 |
0.49% |
3.12 |
5,215.38 |
|
Valle Vista CDP |
Riverside |
16,127 |
14,578 |
1,549 |
10.63% |
6.87 |
2,347.45 |
|
Walnut Park CDP |
Los Angeles |
16,054 |
15,966 |
88 |
0.55% |
0.75 |
21,405.33 |
|
Woodcrest CDP |
Riverside |
16,049 |
14,347 |
1,702 |
11.86% |
11.41 |
1,406.57 |
|
East San Gabriel CDP |
Los Angeles |
15,980 |
14,874 |
1,106 |
7.44% |
1.56 |
10,243.59 |
|
Lamont CDP |
Kern |
15,941 |
15,120 |
821 |
5.43% |
4.59 |
3,472.98 |
|
Avocado Heights CDP |
Los Angeles |
15,917 |
15,411 |
506 |
3.28% |
2.71 |
5,873.43 |
| 321 |
Ukiah |
Mendocino |
15,882 |
16,075 |
-193 |
-1.20% |
4.67 |
3,400.86 |
|
El Sobrante CDP |
Riverside |
15,788 |
12,723 |
3,065 |
24.09% |
7.21 |
2,189.74 |
| 322 |
La Palma |
Orange |
15,774 |
15,568 |
206 |
1.32% |
1.81 |
8,714.92 |
| 323 |
Pacific Grove |
Monterey |
15,624 |
15,041 |
583 |
3.88% |
2.86 |
5,462.94 |
|
East Rancho Dominguez CDP |
Los Angeles |
15,615 |
15,135 |
480 |
3.17% |
0.82 |
19,042.68 |
| 324 |
Fillmore |
Ventura |
15,610 |
15,002 |
608 |
4.05% |
3.36 |
4,645.83 |
|
Rosedale CDP |
Kern |
15,509 |
14,058 |
1,451 |
10.32% |
33.96 |
456.68 |
|
Cherryland CDP |
Alameda |
15,470 |
14,728 |
742 |
5.04% |
1.2 |
12,891.67 |
| 325 |
Ripon |
San Joaquin |
15,463 |
14,297 |
1,166 |
8.16% |
5.3 |
2,917.55 |
|
Los Osos CDP |
San Luis Obispo |
15,388 |
14,276 |
1,112 |
7.79% |
12.76 |
1,205.96 |
|
Parkway CDP |
Sacramento |
15,369 |
14,670 |
699 |
4.76% |
2.42 |
6,350.83 |
| 326 |
Parlier |
Fresno |
15,179 |
14,494 |
685 |
4.73% |
2.19 |
6,931.05 |
|
Oak Park CDP |
Ventura |
15,087 |
13,811 |
1,276 |
9.24% |
5.29 |
2,851.98 |
| 327 |
Clearlake |
Lake |
15,053 |
15,250 |
-197 |
-1.29% |
10.13 |
1,485.98 |
| 328 |
Susanville |
Lassen |
14,843 |
17,947 |
-3,104 |
-17.30% |
7.93 |
1,871.75 |
|
Alpine CDP |
San Diego |
14,830 |
14,236 |
594 |
4.17% |
26.78 |
553.77 |
|
North Fair Oaks CDP |
San Mateo |
14,793 |
14,687 |
106 |
0.72% |
1.2 |
12,327.50 |
|
Rio Linda CDP |
Sacramento |
14,688 |
15,106 |
-418 |
-2.77% |
9.9 |
1,483.64 |
|
Discovery Bay CDP |
Contra Costa |
14,650 |
13,352 |
1,298 |
9.72% |
6.22 |
2,355.31 |
| 329 |
Kerman |
Fresno |
14,594 |
13,544 |
1,050 |
7.75% |
3.23 |
4,518.27 |
|
Coto de Caza CDP |
Orange |
14,554 |
14,866 |
-312 |
-2.10% |
7.95 |
1,830.69 |
| 330 |
McFarland |
Kern |
14,544 |
12,707 |
1,837 |
14.46% |
2.67 |
5,447.19 |
|
North Auburn CDP |
Placer |
14,496 |
13,022 |
1,474 |
11.32% |
7.8 |
1,858.46 |
| 331 |
Hawaiian Gardens |
Los Angeles |
14,473 |
14,254 |
219 |
1.54% |
0.95 |
15,234.74 |
| 332 |
Mill Valley |
Marin |
14,350 |
13,903 |
447 |
3.22% |
4.76 |
3,014.71 |
|
Olivehurst CDP |
Yuba |
14,293 |
13,656 |
637 |
4.66% |
7.47 |
1,913.39 |
|
Stanford CDP |
Santa Clara |
14,213 |
13,809 |
404 |
2.93% |
2.73 |
5,206.23 |
| 333 |
Red Bluff |
Tehama |
14,158 |
14,076 |
82 |
0.58% |
7.56 |
1,872.75 |
| 334 |
Auburn |
Placer |
13,963 |
13,330 |
633 |
4.75% |
7.14 |
1,955.60 |
| 335 |
Livingston |
Merced |
13,961 |
13,058 |
903 |
6.92% |
3.72 |
3,752.96 |
| 336 |
King City |
Monterey |
13,869 |
12,874 |
995 |
7.73% |
3.84 |
3,611.72 |
|
Phelan CDP |
San Bernardino |
13,719 |
14,304 |
-585 |
-4.09% |
60.1 |
228.27 |
| 337 |
California City |
Kern |
13,707 |
14,120 |
-413 |
-2.92% |
203.52 |
67.35 |
| 338 |
Carpinteria |
Santa Barbara |
13,684 |
13,040 |
644 |
4.94% |
2.59 |
5,283.40 |
| 339 |
Grover Beach |
San Luis Obispo |
13,641 |
13,156 |
485 |
3.69% |
2.31 |
5,905.19 |
| 340 |
Palos Verdes Estates |
Los Angeles |
13,586 |
13,438 |
148 |
1.10% |
4.77 |
2,848.22 |
|
Big Bear City CDP |
San Bernardino |
13,535 |
12,304 |
1,231 |
10.00% |
31.95 |
423.63 |
|
Salida CDP |
Stanislaus |
13,501 |
13,722 |
-221 |
-1.61% |
5.32 |
2,537.78 |
| 341 |
Solana Beach |
San Diego |
13,449 |
12,867 |
582 |
4.52% |
3.52 |
3,820.74 |
|
El Sobrante CDP |
Contra Costa |
13,388 |
12,669 |
719 |
5.68% |
2.77 |
4,833.21 |
| 342 |
San Marino |
Los Angeles |
13,365 |
13,147 |
218 |
1.66% |
3.77 |
3,545.09 |
| 343 |
Lindsay |
Tulare |
13,245 |
11,768 |
1,477 |
12.55% |
2.61 |
5,074.71 |
|
Lemon Hill CDP |
Sacramento |
13,128 |
13,729 |
-601 |
-4.38% |
1.63 |
8,053.99 |
| 344 |
Commerce |
Los Angeles |
12,973 |
12,823 |
150 |
1.17% |
6.54 |
1,983.64 |
| 345 |
Grass Valley |
Nevada |
12,934 |
12,860 |
74 |
0.58% |
4.74 |
2,728.69 |
|
Bonita CDP |
San Diego |
12,931 |
12,538 |
393 |
3.13% |
5 |
2,586.20 |
|
Mountain House CDP |
San Joaquin |
12,916 |
9,675 |
3,241 |
33.50% |
3.192 |
4,046.37 |
| 346 |
Malibu |
Los Angeles |
12,879 |
12,645 |
234 |
1.85% |
19.78 |
651.11 |
| 347 |
Half Moon Bay |
San Mateo |
12,697 |
11,324 |
1,373 |
12.12% |
6.42 |
1,977.73 |
| 348 |
San Anselmo |
Marin |
12,599 |
12,336 |
263 |
2.13% |
2.68 |
4,701.12 |
| 349 |
Grand Terrace |
San Bernardino |
12,509 |
12,040 |
469 |
3.90% |
3.5 |
3,574.00 |
| 350 |
Tehachapi |
Kern |
12,495 |
14,414 |
-1,919 |
-13.31% |
9.87 |
1,265.96 |
| 351 |
Avenal |
Kings |
12,466 |
15,505 |
-3,039 |
-19.60% |
19.42 |
641.92 |
|
Diamond Springs CDP |
El Dorado |
12,459 |
11,037 |
1,422 |
12.88% |
16.64 |
748.74 |
|
Muscoy CDP |
San Bernardino |
12,417 |
10,644 |
1,773 |
16.66% |
3.14 |
3,954.46 |
| 352 |
Larkspur |
Marin |
12,382 |
11,926 |
456 |
3.82% |
3.03 |
4,086.47 |
| 353 |
Marysville |
Yuba |
12,249 |
12,072 |
177 |
1.47% |
3.46 |
3,540.17 |
|
Lake Los Angeles CDP |
Los Angeles |
12,136 |
12,328 |
-192 |
-1.56% |
9.74 |
1,246.00 |
| 354 |
Fortuna |
Humboldt |
12,122 |
11,926 |
196 |
1.64% |
4.85 |
2,499.38 |
|
Lakeland Village CDP |
Riverside |
11,995 |
11,541 |
454 |
3.93% |
8.68 |
1,381.91 |
| 355 |
Clayton |
Contra Costa |
11,992 |
10,897 |
1,095 |
10.05% |
3.84 |
3,122.92 |
| 356 |
Scotts Valley |
Santa Cruz |
11,928 |
11,580 |
348 |
3.01% |
4.59 |
2,598.69 |
| 357 |
Healdsburg |
Sonoma |
11,827 |
11,254 |
573 |
5.09% |
4.46 |
2,651.79 |
| 358 |
Kingsburg |
Fresno |
11,807 |
11,382 |
425 |
3.73% |
2.83 |
4,172.08 |
| 359 |
Emeryville |
Alameda |
11,671 |
10,080 |
1,591 |
15.78% |
1.25 |
9,336.80 |
|
Winton CDP |
Merced |
11,669 |
10,613 |
1,056 |
9.95% |
3.04 |
3,838.49 |
| 360 |
Signal Hill |
Los Angeles |
11,649 |
11,016 |
633 |
5.75% |
2.19 |
5,319.18 |
|
View Park-Windsor Hills CDP |
Los Angeles |
11,648 |
11,075 |
573 |
5.17% |
1.84 |
6,330.43 |
| 361 |
Los Alamitos |
Orange |
11,636 |
11,449 |
187 |
1.63% |
4.05 |
2,873.09 |
|
Citrus CDP |
Los Angeles |
11,460 |
10,866 |
594 |
5.47% |
0.89 |
12,876.40 |
| 362 |
Hillsborough |
San Mateo |
11,431 |
10,825 |
606 |
5.60% |
6.19 |
1,846.69 |
|
Home Gardens CDP |
Riverside |
11,420 |
11,570 |
-150 |
-1.30% |
1.56 |
7,320.51 |
| 363 |
Mendota |
Fresno |
11,418 |
11,014 |
404 |
3.67% |
3.28 |
3,481.10 |
|
Camp Pendleton South CDP |
San Diego |
11,394 |
10,616 |
778 |
7.33% |
3.91 |
2,914.07 |
| 364 |
Piedmont |
Alameda |
11,353 |
10,667 |
686 |
6.43% |
1.68 |
6,757.74 |
|
Lake Arrowhead CDP |
San Bernardino |
11,333 |
12,424 |
-1,091 |
-8.78% |
17.73 |
639.20 |
|
Sun Village CDP |
Los Angeles |
11,322 |
11,565 |
-243 |
-2.10% |
10.69 |
1,059.12 |
|
Magalia CDP |
Butte |
11,306 |
11,310 |
-4 |
-0.04% |
14.01 |
807.00 |
|
Garden Acres CDP |
San Joaquin |
11,278 |
10,648 |
630 |
5.92% |
2.59 |
4,354.44 |
| 365 |
Canyon Lake |
Riverside |
11,137 |
10,561 |
576 |
5.45% |
3.93 |
2,833.84 |
| 366 |
Newman |
Stanislaus |
11,123 |
10,224 |
899 |
8.79% |
2.1 |
5,296.67 |
|
La Riviera CDP |
Sacramento |
11,062 |
10,802 |
260 |
2.41% |
1.85 |
5,979.46 |
| 367 |
Sierra Madre |
Los Angeles |
11,057 |
10,917 |
140 |
1.28% |
2.95 |
3,748.14 |
| 368 |
Sonoma |
Sonoma |
11,054 |
10,648 |
406 |
3.81% |
2.74 |
4,034.31 |
|
Alum Rock CDP |
Santa Clara |
11,051 |
15,536 |
-4,485 |
-28.87% |
1.2 |
9,209.17 |
|
Soquel CDP |
Santa Cruz |
10,827 |
9,644 |
1,183 |
12.27% |
4.598 |
2,354.72 |
| 369 |
Farmersville |
Tulare |
10,735 |
10,588 |
147 |
1.39% |
2.26 |
4,750.00 |
|
Del Aire CDP |
Los Angeles |
10,692 |
10,001 |
691 |
6.91% |
1.01 |
10,586.14 |
| 370 |
Placerville |
El Dorado |
10,681 |
10,389 |
292 |
2.81% |
5.81 |
1,838.38 |
| 371 |
Morro Bay |
San Luis Obispo |
10,648 |
10,234 |
414 |
4.05% |
5.3 |
2,009.06 |
|
Quartz Hill CDP |
Los Angeles |
10,619 |
10,912 |
-293 |
-2.69% |
3.76 |
2,824.20 |
|
Fairview CDP |
Alameda |
10,568 |
10,003 |
565 |
5.65% |
2.76 |
3,828.99 |
|
Tamalpais-Homestead Valley CDP |
Marin |
10,542 |
10,735 |
-193 |
-1.80% |
4.64 |
2,271.98 |
| 372 |
Exeter |
Tulare |
10,506 |
10,334 |
172 |
1.66% |
2.46 |
4,270.73 |
|
Rossmoor CDP |
Orange |
10,461 |
10,244 |
217 |
2.12% |
1.54 |
6,792.86 |
|
East Whittier CDP |
Las Angeles |
10,440 |
9,757 |
683 |
7.00% |
1.09 |
9,577.98 |
|
Valley Center CDP |
San Diego |
10,261 |
9,277 |
984 |
10.61% |
27.426 |
374.13 |
| 373 |
Anderson |
Shasta |
10,232 |
9,932 |
300 |
3.02% |
6.37 |
1,606.28 |
|
San Diego Country Estates CDP |
San Diego |
10,215 |
10,109 |
106 |
1.05% |
16.85 |
606.23 |
| 374 |
Capitola |
Santa Cruz |
10,180 |
9,918 |
262 |
2.64% |
1.59 |
6,402.52 |
| 375 |
Shasta Lake |
Shasta |
10,162 |
10,164 |
-2 |
-0.02% |
10.92 |
930.59 |
|
Delhi CDP |
Merced |
10,026 |
10,755 |
-729 |
-6.78% |
3.51 |
2,856.41 |
Annual Estimates of the Resident Population: April 1, 2010 to July 1, 2016
Source: U.S. Census Bureau, Population Division
Release Date: May 2017.

Qualifying for a Home Loan in California
Conforming Mortgages
Several different loan types are available in the Golden State. These include 15-year fixed-rate mortgages, 30-year fixed, ARM loans, and refinancing loans. Also available are FHA, VA, and piggyback loans.
The most popular loan in California is the 30-year fixed-rate mortgage. This loan has an interest rate that does not change (it is fixed) over the life of the mortgage. Thirty-year mortgages carry a higher interest rate than 15-year loans, as the lender is guaranteeing a fixed rate for twice as long. Switching from a 30-year mortgage to its 15-year cousin will increase monthly payments, but can cut the amount of interest owed by tens of thousands of dollars over the lifetime of the loan.
The relatively high real estate prices across the state makes the loans jumbo mortgages, as they exceed the conforming limit. Adjustable-rate mortgages are relatively rare in most states, but ARMs are far more common in California, especially among jumbo mortgages. As of 2026 the conforming loan limit across the United States is set to $832,750, with a ceiling of 150% that amount in areas where median home values are higher. Jumbo loans typically have a slightly higher rate of interest than conforming mortgages, though spreads vary based on credit market conditions. Here is a list of counties which have higher conforming loan limits.
| County |
Metropolitan Designation |
1 Unit Limit |
2 Unit Limit |
3 Unit Limit |
4 Unit Limit |
| Alameda |
San Francisco-Oakland-Hayward, Ca |
$1,249,125 |
$1,599,375 |
$1,933,200 |
$2,402,625 |
| Contra Costa |
San Francisco-Oakland-Hayward, Ca |
$1,249,125 |
$1,599,375 |
$1,933,200 |
$2,402,625 |
| Los Angeles |
Los Angeles-Long Beach-Anaheim, Ca |
$1,249,125 |
$1,599,375 |
$1,933,200 |
$2,402,625 |
| Marin |
San Francisco-Oakland-Hayward, Ca |
$1,249,125 |
$1,599,375 |
$1,933,200 |
$2,402,625 |
| Monterey |
Salinas, Ca |
$994,750 |
$1,273,450 |
$1,539,350 |
$1,913,000 |
| Napa |
Napa, Ca |
$1,017,750 |
$1,302,900 |
$1,574,900 |
$1,957,250 |
| Orange |
Los Angeles-Long Beach-Anaheim, Ca |
$1,249,125 |
$1,599,375 |
$1,933,200 |
$2,402,625 |
| San Benito |
San Jose-Sunnyvale-Santa Clara, Ca |
$1,249,125 |
$1,599,375 |
$1,933,200 |
$2,402,625 |
| San Diego |
San Diego-Carlsbad, Ca |
$1,104,000 |
$1,413,350 |
$1,708,400 |
$2,123,100 |
| San Francisco |
San Francisco-Oakland-Hayward, Ca |
$1,249,125 |
$1,599,375 |
$1,933,200 |
$2,402,625 |
| San Luis Obispo |
San Luis Obispo-Paso Robles-Arroyo Gran |
$1,000,500 |
$1,280,850 |
$1,548,250 |
$1,924,100 |
| San Mateo |
San Francisco-Oakland-Hayward, Ca |
$1,249,125 |
$1,599,375 |
$1,933,200 |
$2,402,625 |
| Santa Barbara |
Santa Maria-Santa Barbara, Ca |
$941,850 |
$1,205,750 |
$1,457,450 |
$1,811,300 |
| Santa Clara |
San Jose-Sunnyvale-Santa Clara, Ca |
$1,249,125 |
$1,599,375 |
$1,933,200 |
$2,402,625 |
| Santa Cruz |
Santa Cruz-Watsonville, Ca |
$1,249,125 |
$1,599,375 |
$1,933,200 |
$2,402,625 |
| Sonoma |
Santa Rosa, Ca |
$897,000 |
$1,148,350 |
$1,388,050 |
$1,725,050 |
| Ventura |
Oxnard-Thousand Oaks-Ventura, Ca |
$1,035,000 |
$1,325,000 |
$1,601,600 |
$1,990,450 |
| All Others |
Rest of State |
$832,750 |
$1,066,250 |
$1,288,800 |
$1,601,750 |
ARM loans are adjustable-rate mortgages. These products have a fixed introductory rate for a specified number of years and then typically change once per year in subsequent years. Although adjustable-rate mortgages usually have a lower initial rate than 30-year fixed loans, interest rates on ARM loans can rise later in the loan if the reference interest rate rises significantly. ARM loans are not particularly popular on a nationwide basis as most homeowners prefer the security of a locked-in rate. ARM loans are much more common in states with expensive real estate like California where a buyer is attracted to the lower upfront monthly payment & then figures either the real estate will appreciate or they will get a raise which helps them improve their financial position before rates rise. Balloon loans are similar to ARM loans in terms of charging a floating or variable rate, but they do not fully amortize. Instead they require repayment in full at a set date, or refinancing into another loan.
Most private banks give their best rates to borrowers with credit scores above 740, but loans with higher interest rates can be obtained with lower scores. Mortgage underwriters prefer debt-to-income ratios to be below 40%, but other factors are considered on the loan application.
The piggyback loan is another type of mortgage available to California residents. This is simply two mortgages in one. The piggyback loan can eliminate the need for private mortgage insurance by covering 80% of the home's value with the first loan, while the second loan helps to pay for part of the down payment. This mortgage is a common way to avoid the standard 20% down payment, which is required by most private banks issuing loans.
Due to high property prices across the states & high local living costs refinancing is widely used along with home equity lines of credit (HELOC).

Government Programs
California is a community property state, which means all property purchased when married becomes the property of the couple. A non-borrowing spouse's credit report in a community property state must be submitted when applying for a VA or FHA loan, and both of these institutions require debts from both spouses when figuring debt-to-income ratios. A mortgage secured through Fannie Mae or Freddie Mac does not need to consider both spouse's credit histories.
Mortgages can also be secured through the Federal Housing Administration. The FHA requires only a 3.5% down payment with a credit score of 580 or higher. Mortgage insurance premiums must be paid for most FHA loans, however, because the down payment is under 20%.
The Veterans Administration also offers home loans, and the VA can do it without requiring any down payment. The loans come from private banks, which the VA insures. You do have to be a qualified veteran to get a VA loan.
USDA loans can help people with low incomes in rural parts of the state qualify for a subsidized low-interest loan.
The piggyback loan is another type of mortgage available to California residents. This is simply two mortgages in one. The piggyback loan can eliminate the need for private mortgage insurance by covering 80% of the home's value with the first loan, while the second loan helps to pay for part of the down payment. This mortgage is a good way to avoid the standard 20% down payment, which is required by most private banks issuing loans to Golden State residents. The California Housing Finance Agency offers assistance with down payments for first-time buyers and low-income families.

Natural Disasters
Flood Insurance
Homeowner's insurance policies typically do not cover flooding. Most of the state of California is considered to have a very low to moderate flooding risk. Here are counties which have a relatively elevated risk.
- low flooding risk: Amadot, Calaveras, Contra Costa, Del Norte, El Dorado, Monterey, Riverside, San Bernardino, San Luis Obispo, San Mateo, Sonoma, Sutter
- moderate flooding risk: Butte, Colusa, Inyo, Kern, Lassen, Mendocino, Napa, Orange, Plumas, Sacramento, San Joaquin, Santa Barbera, Santa Clara, Santa Cruz, Shasta, Siskiyou, Solano, Ventura, Yolo
- high flooding risk: Glenn, Lake, Marin, Tehama
- very high flooding risk: Merced, Modoc, Sierra, Trinity, Tulare
- low hurricane storm surge risk: Mendocino, Ventura
- moderate hurricane storm surge risk: Marin, Santa Barbera, Santa Cruz
Home buyers with mortgages in high-risk areas are required to buy flood insurance. Most flood insurance policies are sold by the United States federal government through The National Flood Insurance Program. Under-priced flood insurance in high-risk areas act as a subsidy to wealthy homeowners.
“The NFIP does not charge nearly enough to cover the expected costs of its liabilities. The assessments are not sufficient to build any buffer to cover an extraordinary year, such as what occurred with Hurricane Katrina in 2005 or Hurricane Sandy in 2012. Because homeowners don't incur the full cost of building in a flood zone we end up with more houses there than if homeowners incurred the full cost of the flood risk, which exacerbates the government's costs in the next disaster.”
Homeowners who live in lower risk areas & are not required to purchase flood insurance heavily cross-subsidize homeowners who are in areas where floods are more common.
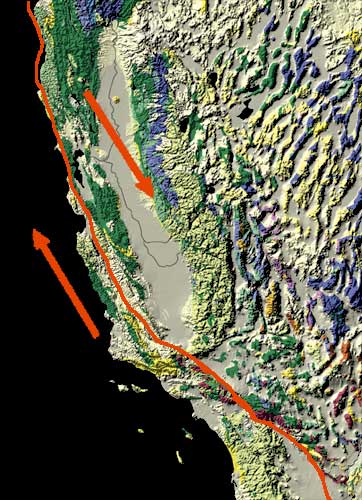
Earthquakes
California has a very high earthquake risk from the San Andreas Fault, which forms the tectonic boundary between the North American Plate & the Pacific Plate.
There is a 76% chance of a magnitude 7.2 earthquake hitting the Bay Area in the next 30 years. While construction quality has improved greatly in the past century, large portions of San Francisco are built on landfill and hundreds of buildings scheduled for retrofits have not begun much needed upgrades.
Standard rental and homeowner insurance policies typically do not cover earthquake damage, though they usually cover losses caused by fires which resulted from an earthquake. If you live near a fault line it is important to carry a policy endorsed by the California Earthquake Authority (CEA).
On October 17, 1989 a 6.9 magnitude earthqake struck near Loma Prieta Peak. It interrupted the World Series game which was about to begin in Candlestick Park, collapsed a portion of the upper deck of the San Francisco-Oakland Bay Bridge, killed 67 people & caused over $6 billion in damages.
On April 18, 1906 a massive earthquake - estimated at 8.3 on the the richter scale - struck city of San Francisco. Initial damages from the quake & subsequent fires killed an estimated 3,000 people and left half of the residents of San Francisco homeless.
Wildfires
The risk of wildfires is considered moderate to very high across much of the state. Many of the worst wildfires in the country happen across the state of California. Fire damages from wildfires & other types of fires are typically covered in most homeowner's insurance policies. If you own expensive items you may want to keep an up-to-date household inventory list which lists specific valuables, such as fine art & jewelry.
Laws Particular to the Golden State

Taxes
While state income taxes are quite high in California, real estate taxes are far more reasonable. Across the state the average assessment was 0.77% in 2016.
Proposition 13 is an amendment to the California constitution that limits the state's property tax at 1% of a home's value. The rate that the tax can increase is subject to an inflation factor limited to a maximum increase of 2% per year. Before this measure was enacted, real estate tax bills could, and oftentimes did, increase substantially in just a few years. With Prop 13, home owners can more easily predict what their property tax will be in the future. If property taxes do not keep up with property prices then the cost of property taxes can jump dramatically whenever the property is acquired by a new buyer.
Foreclosures
In California, mortgages can be either recourse or non-recourse loan. A recourse loan is one in which the lender can pursue the amount owed on the debt even after taking collateral. A non-recourse mortgage prohibits the lender from pursuing anything besides the collateral, which in a mortgage is usually the home itself.
While California's laws on this issue tend to be somewhat complex, generally speaking a first mortgage for a residence is typically a non-recourse loan. Second mortgages could be recourse loans under some circumstances, such as when the second mortgage is taken out after the initial purchase of the house and is on a 2nd deed.
Foreclosures in California typically are handled outside of the court system, meaning that they are non-judicial foreclosures. The trustee, at the request of the lender, sells the home to pay off the mortgage's balance if the borrower defaults. Under judicial foreclosures, a lawsuit is filed to obtain a court order to sell the property, usually in an auction. This type of foreclosure is uncommon in California, largely because non-judicial foreclosures are quicker and cheaper.
Learn More

Although California's property market isn't the easiest in the Union, the state does have the advantage of being large with a wide selection of areas, some of which are affordable. With a very owner-friendly property tax law and a variety of mortgage options, it may be possible, although it probably won't be easy, to find a house you can afford.
Many cities and counties in California have Public Housing Agencies (PHA's) that help low-income families find affordable housing, oftentimes using federal government programs through the Department of Housing and Urban Development. Most PHA's have websites and weekday office hours.
To learn more about California's real estate market and the specific resources available to home buyers, check out the following web sites:

El Monte Homeowners May Want to Lock-in While Rates Are Low
The Federal Reserve has begun lowering interest rates. Lock in today's low rates and save on your loan.
Are you paying too much for your mortgage?
Find Out What You Qualify For
Check your mortgage options with a trusted El Monte lender.
Answer a few questions below and connect with a lender who can help save you money today!