
The following table shows current 30-year El Monte mortgage rates. You can use the menus to select other loan durations, alter the loan amount. or change your location.

New York State is the fourth most populous state in the country and covers almost 55,000 square miles. The landscape across the state, however, could not be more diverse. New York City is the most-populated city in the United States, and about 60% of New York State's citizens live in the New York City metropolitan area. Most of the state's area, however, lies to the north of New York City. This part of the state includes mountains, rural villages, college towns, and industrial cities.
The New York City Long Island metropolitan area is referred to as Downstate New York, with the rest of the state comprising Upstate New York. Sometimes, New York real estate agents might refer to downstate properties based on the county the property is located in (i.e. Nassau or Westchester). Manhattan is just to the west of Long Island and includes some of the most expensive real estate in the world.
The median home price is New York State is $303,300. In the last year, the median home price has increased by over 12%, and values are expected to continue increasing at a rate of around 6% annually.
Home ownership across the state of New York is lower than most of the country due to high housing costs in NYC. In the mid to late 1980s the homeownership rate across the state held between 50% and 52%. This rate jumped to a high of 55.9% in 2005 before sliding back to 51.5% in 2016. The median ownership rate across the nation is about 12% higher, reaching 63.9% in Q3 of 2017.
When evaluating the performance & price of New York real estate, it is worth considering Upstate New York and Downstate New York as two separate entities.

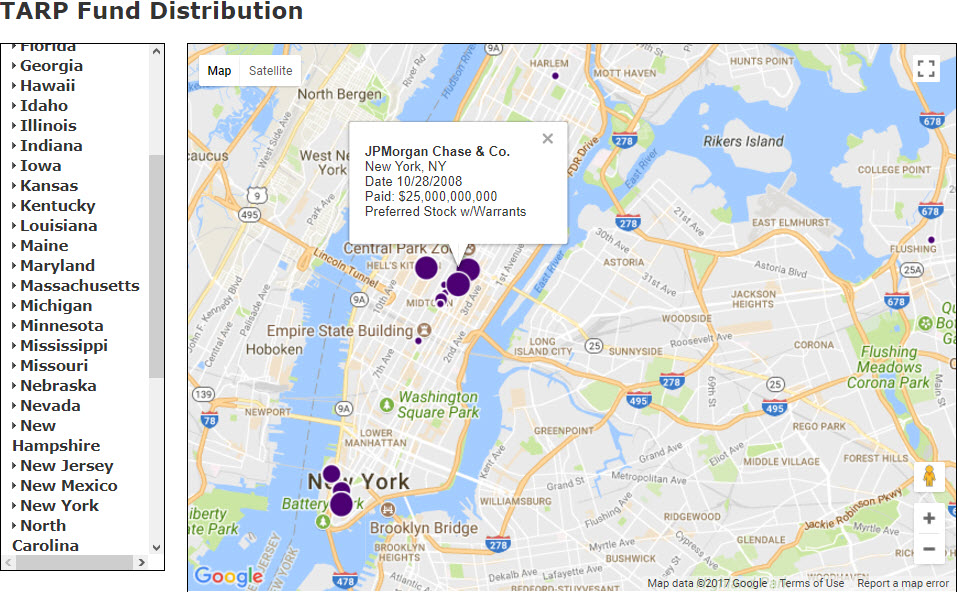
After the Great Recession hit condo prices in the NYC metro area fell about 15% between May of 2008 and August of 2009. Prices then quickly stablized and as of 2017 are about 20% above their prior peak. Sales volume fell more rapidly than prices as homeowners and property investors took their properties off the market. Even at the 2009 market bottoms, the average NYC apartment sold for $1.39 million while the median apartment went for $850,000. Many wealthy people invest in and are heavily invested in the success of the city:
The crash was supposed to send real-estate values plummeting throughout the city, and prices did dip. But today Manhattan and nearby sections of Brooklyn not only are booming, they have surpassed pre-crisis peaks. And as anyone who has noticed how many windows are dark in Manhattan’s luxury high-rises might have guessed, New York is not just a playground for the global elite, but a locus for their investments—including high-end properties where they reside for a small part of the year.
The 2018 changes to US tax law will increase the cost of living in areas with expensive property prices & high local taxes. This is anticipated to have a negative impact on the Manhattan property market, though appreciation of other financial assets could offset the impact to some degree.
The Federal Reserve Bank of New York offers an interactive state chart which shows how prices have changed on a county-by-county basis across the state, with data ranging from 2003 to present. In the wake of the Great Recession the state as a whole fell more than the NYC metro area did. Nearly a decade after the Great Recession upstate cities like Buffalo, Syracuse & Rochester are still struggling. In October of 2016 PwC listed Buffalo as the worst real estate market in the United States. Other upstate cities like Albany also suffer from high poverty rates.

Real estate trends in New York City dominate the trends reported for the entire state. So, it is important to note that many of the smaller cities and towns in New York State may react differently to local market conditions over time. New York's housing markets are very sensitive to national economic trends. Housing prices were relatively stable during the 1970s, but the economic boom of the 1980s pushed prices up rapidly. Housing prices in New York doubled between 1980 and 1990. Throughout the 1990s, New York's housing market experienced only a small amount of growth until close to the year 2000. Home prices doubled again between 2000 and 2008.
Home prices in New York peaked in the beginning of 2007. Prices continued to decline as the financial crisis deepened and the financial markets struggled to recover. Home prices in New York finally hit their bottom in the middle of 2012 after declining 13%. The impact of the housing crisis on New York home prices was quite small compared to other areas of the country. States like California and Florida experienced drops of over 40% in home values.
It took the housing markets in New York five years to hit their bottom after the all-time high in 2007. Then, it took another five years to recover from the housing crisis. In the second quarter of 2017, home prices in New York exceeded their previous all-time high (2007) for the first time.
Here are some of the reasons NYC real estate market rebounded faster than other areas of the country:
The Big Short & Too Big to Fail are documentaries which capture the essence of the financial crisis & the impact it had on the broader global economy. While big US banks were bailed out during the 2008 / 2009 financial crisis, growing populism may make it hard for them to receive bailouts in future financial crises, particularly as the last one spawned both the Occupy Wall Street & Tea Party movements. If banks are not treated with deference, then NYC real estate may be more volatile in future recessions.
Through the first 3 quarters of 2020 real estate held up far better than it did during the 2008 housing recession. Central banks and politicians reacted faster and much more aggressively to the COVID-19 crisis than they did to the 2008 recession. Many novel and unconventional policies which began in response to the prior recession were used much more aggressively in this recession. For instance, here are some of the policies which were enacted:
On November 24, 2020 the Federal Housing Finance Agency (FHFA) raised conforming loan limits by 7.42%, reflecting strong annual growth in the nationwide FHFA House Price Index (HPI). 2022 and 2023 saw limit increases of 18.05% and 12.21%, the fastest 2-year growth rates since 1986 & 1987, and inline with the 15.95% growth in 2006. In 2024 and 2025 the limits were increased at more historically normal levels of 5.56% and 5.21%.
| NY Rank | US Rank | Metropolitan Area | 2016 Pop | 2010 Pop | Change | % △ |
|---|---|---|---|---|---|---|
| 1 | 1 | New York-Newark-Jersey City, NY-NJ-PA Metro Area | 20,153,634 | 19,567,410 | 586,224 | 3.00% |
| 2 | 50 | Buffalo-Cheektowaga-Niagara Falls | 1,132,804 | 1,135,509 | -2,705 | -0.24% |
| 3 | 51 | Rochester | 1,078,879 | 1,079,671 | -792 | -0.07% |
| 4 | 63 | Albany-Schenectady-Troy | 881,839 | 870,716 | 11,123 | 1.28% |
| 5 | 84 | Syracuse | 656,510 | 662,577 | -6,067 | -0.92% |
| 6 | 164 | Utica-Rome | 293,803 | 299,397 | -5,594 | -1.87% |
| 7 | 189 | Binghamton | 244,094 | 251,725 | -7,631 | -3.03% |
| 8 | 236 | Kingston | 179,225 | 182,493 | -3,268 | -1.79% |
| 9 | 317 | Jamestown-Dunkirk-Fredonia | 129,504 | 134,905 | -5,401 | -4.00% |
| 10 | 324 | Glens Falls | 126,367 | 128,923 | -2,556 | -1.98% |
| 11 | 352 | Watertown-Fort Drum | 114,006 | 116,229 | -2,223 | -1.91% |
| 12 | 354 | Ogdensburg-Massena | 110,038 | 111,944 | -1,906 | -1.70% |
| 13 | 366 | Ithaca | 104,871 | 101,564 | 3,307 | 3.26% |
| 14 | 397 | Corning | 96,940 | 98,990 | -2,050 | -2.07% |
| 15 | 420 | Elmira | 86,322 | 88,830 | -2,508 | -2.82% |
| 16 | 441 | Plattsburgh | 81,073 | 82,128 | -1,055 | -1.28% |
| 17 | 453 | Auburn | 77,861 | 80,026 | -2,165 | -2.71% |
| 18 | 454 | Olean | 77,677 | 80,317 | -2,640 | -3.29% |
| 19 | 520 | Hudson | 60,989 | 63,096 | -2,107 | -3.34% |
| 20 | 527 | Oneonta | 60,097 | 62,259 | -2,162 | -3.47% |
| 21 | 536 | Batavia | 58,482 | 60,079 | -1,597 | -2.66% |
| 22 | 564 | Gloversville | 53,828 | 55,531 | -1,703 | -3.07% |
| 23 | 592 | Malone | 50,409 | 51,599 | -1,190 | -2.31% |
| 24 | 597 | Amsterdam | 49,276 | 50,219 | -943 | -1.88% |
| 25 | 609 | Cortland | 48,070 | 49,336 | -1,266 | -2.57% |
| 26 | 765 | Seneca Falls | 34,777 | 35,251 | -474 | -1.34% |

Due to its large size & dense population, New York City includes many neighborhoods that have developed their own unique characteristics and have home prices amongst the highest in the world: including Battery Park, Bedford, Belle Harbor, Carnegie Hill, Central Park, Chelsea, Forest Hill Gardens, Greenwich Village, Little Italy, Manhattan Beach, Queens, SoHo and Sutton Place. Here are the population statistics for each of the five boroughs. Nearly all the population growth across the state as a whole is happening in the city.
| Borough | 2016 Pop | 2010 Pop | Change | % △ | Land mi² | Pop Density |
|---|---|---|---|---|---|---|
| New York State | 19,745,289 | 19,378,102 | 367,187 | 1.90% | 47,126.40 | 418.99 |
| New York City | 8,537,673 | 8,175.13 | 362,540 | 4.40% | 302.64 | 28,210.66 |
| Bronx | 1,455,720 | 13,805,108 | 70,612 | 5.10% | 42.1 | 34,577.67 |
| Brooklyn | 2,692,150 | 2,504,700 | 124,450 | 5.00% | 70.82 | 38,013.98 |
| Manhattan | 1,643,734 | 1,585,873 | 57,861 | 3.60% | 22.83 | 71,998.86 |
| Queens | 2,333,054 | 2,230,722 | 102,332 | 4.60% | 108.53 | 21,496.86 |
| Staten Island | 476,015 | 468,730 | 7,285 | 1.60% | 58.37 | 8,155.13 |
| NYC as % NY State | 43.20% | 42.20% | 98.70% | 0.64219% |
Condominiums in New York sell for about $975 per square foot, and single-family homes sell for a median value of $147 per square foot. The median rent list price in New York is $3,200. This large differential in price is due to the fact that rental properties and condominiums dominate the housing market in the New York City metropolitan area.
New York City is the most densely populated city in the United States and has some of the most expensive real estate. The financial services, entertainment, and tourism industries dominate the city's economy. The median sales price in New York City is $1.4 million, and the median rent is $3,900. Penthouse units have sold for over $100 million.
New York City is a leading global financial, fashion, entertainment, media, marketing and sports hub.
Many leading banks & financial firms are headquartered in the city. The New York Stock Exchange and Nasdaq, which are the two largest stock exchanges in the world, are based in the city.
Global ad agencies & many smaller players still line Madison Avenue.
Dozens of world-class museums are located in the city including: The Metropolitan Museum of Art, The Guggenheim New York Museum, American Museum of Natural History, The Brooklyn Museum, The Museum of Modern Art, the New Museum of Contemporary Art, The Whitney Museum of American Art & the Bronx Museum of the Arts.
Other popular locations to visit include the Statue of Liberty, The National 9/11 Memorial Museum and the New York Public Library.
Dozens of compelling Broadway shows play year round.
Many leading colleges & universities have campuses located in the city including the City University of New York, Columbia University, The Juilliard School & The New School.
The city boasts two pro sports teams in each of the four major sports:

Yonkers is a popular NYC suburb just north of the Bronx. It has grown in population quicker than many other parts of the state as people who have been priced out of living in the city choose to live in Yonkers and commute.
Life outside the New York City metropolitan area is considerably more affordable. Four of the next largest cities in New York are Buffalo, Rochester, Syracuse, and Albany.

Buffalo used to be a large manufacturing city and still maintains one of the largest steel manufacturing facilities in the country. The median home price is around $100,000, and median rents are around $950. The city is home to an NFL team, the Buffalo Bills.

Rochester is home to many large, technology firms such as Eastman Kodak and Xerox. The mean home price in Rochester is around $124,000, and median rent is $1,200.

Syracuse recently ranked last out of the 100 largest U.S. metropolitan areas in economic growth. Once a thriving manufacturing city, it has become a victim of the decline in American manufacturing. The largest employers are related to Syracuse University. Median home prices have largely remained flat from 2008 through 2014 but once again began to pick up from 2015 onward.

Albany is the state capital of New York. The state government is a large part of Albany's economy, but it has grown to be a part of New York's tech valley in the past few years. The median home price is around $193,000, and the median rent is $1,500.
Buffalo and Syracuse are considered two of the most affordable cities in New York. Troy, Elmira, and a few other small towns in the Finger Lakes region also make the list. The cost of living is below the national average in all of these cities, and all of the cities have median home prices under $100,000.
Cohoes, Glens Falls, and Oneonta rank among the fastest growing cities in New York. Cohoes and Glens Falls are both suburbs of Albany that have experienced growth as business activity around Albany increases. Oneonta is a small city that is the home of two colleges.
According to the United States Census an estimated 19,745,289 people live in the state of New York. The state has 47,126.40 mi² of land area, which gave it a population density of 418.99 per mi². Here is a list of cities, towns, villages & Census Designated Places with more than 10,000 residents, with their estimated population as of June 2016 & the 2010 United States Census. For Census Designated Places (CDP) where there was no population estimate available for 2016, the 2011-2015 American Community Survey 5-Year Estimates data was used.
All table columns are sortable. Click on the column headers to sort by that column. Click again to sort low to high. Cities with higher levels of population growth typically see the increased demand drive faster real estate price appreciation.
| Rank | Geography | County | 2016 Pop | 2010 Pop | Change | % △ | Land mi² | Pop Den mi² |
|---|---|---|---|---|---|---|---|---|
| 1 | New York City | Bronx, Kings, New York, Queens, and Richmond | 8,537,673 | 8,175,133 | 362,540 | 4.43% | 302.64 | 28,210.66 |
| Brooklyn borough | Kings | 2,629,150 | 2,504,700 | 124,450 | 4.97% | 70.82 | 37,124.40 | |
| Queens borough | Queens | 2,333,054 | 2,230,722 | 102,332 | 4.59% | 108.53 | 21,496.86 | |
| Manhattan borough | New York | 1,643,734 | 1,585,873 | 57,861 | 3.65% | 22.83 | 71,998.86 | |
| Bronx borough | Bronx | 1,455,720 | 1,385,108 | 70,612 | 5.10% | 42.1 | 34,577.67 | |
| Staten Island borough | Richmond | 476,015 | 468,730 | 7,285 | 1.55% | 58.37 | 8,155.13 | |
| 2 | Hempstead | Nassau | 770,367 | 759,757 | 10,610 | 1.40% | 118.59 | 6,496.05 |
| 3 | Brookhaven | Suffolk | 486,599 | 486,040 | 559 | 0.12% | 259.44 | 1,875.57 |
| 4 | Islip | Suffolk | 333,758 | 335,543 | -1,785 | -0.53% | 104.11 | 3,205.82 |
| 5 | Oyster Bay | Nassau | 298,961 | 293,214 | 5,747 | 1.96% | 103.75 | 2,881.55 |
| 6 | Buffalo | Erie | 256,902 | 261,310 | -4,408 | -1.69% | 40.38 | 6,362.11 |
| 7 | North Hempstead | Nassau | 231,114 | 226,322 | 4,792 | 2.12% | 53.51 | 4,319.08 |
| 8 | Babylon | Suffolk | 212,137 | 213,603 | -1,466 | -0.69% | 52.32 | 4,054.61 |
| 9 | Rochester | Monroe | 208,880 | 210,565 | -1,685 | -0.80% | 35.78 | 5,837.90 |
| 10 | Huntington | Suffolk | 203,236 | 203,264 | -28 | -0.01% | 94.12 | 2,159.33 |
| 11 | Yonkers | Westchester | 200,807 | 195,976 | 4,831 | 2.47% | 18.01 | 11,149.75 |
| 12 | Syracuse | Onondaga | 143,378 | 145,170 | -1,792 | -1.23% | 25.04 | 5,725.96 |
| 13 | Ramapo | Rockland | 136,235 | 126,595 | 9,640 | 7.61% | 61.2 | 2,226.06 |
| 14 | Amherst | Erie | 125,786 | 122,366 | 3,420 | 2.79% | 53.2 | 2,364.40 |
| 15 | Smithtown | Suffolk | 117,481 | 117,801 | -320 | -0.27% | 53.7 | 2,187.73 |
| 16 | Albany | Albany | 98,111 | 97,856 | 255 | 0.26% | 21.39 | 4,586.77 |
| 17 | Greece | Monroe | 96,175 | 96,095 | 80 | 0.08% | 47.52 | 2,023.88 |
| 18 | Greenburgh | Westchester | 92,316 | 88,400 | 3,916 | 4.43% | 30.31 | 3,045.73 |
| 19 | Clarkstown | Rockland | 87,332 | 84,187 | 3,145 | 3.74% | 38.48 | 2,269.54 |
| 20 | Cheektowaga | Erie | 86,983 | 88,226 | -1,243 | -1.41% | 29.42 | 2,956.59 |
| 21 | Colonie | Albany | 83,217 | 81,591 | 1,626 | 1.99% | 55.94 | 1,487.61 |
| 22 | New Rochelle | Westchester | 79,557 | 77,062 | 2,495 | 3.24% | 10.35 | 7,686.67 |
| Cheektowaga CDP | Erie | 74,905 | 75,178 | -273 | -0.36% | 25.34 | 2,956.00 | |
| 23 | Tonawanda | Erie | 72,483 | 73,567 | -1,084 | -1.47% | 18.73 | 3,869.89 |
| 24 | Mount Vernon | Westchester | 68,344 | 67,292 | 1,052 | 1.56% | 4.39 | 15,568.11 |
| 25 | Schenectady | Schenectady | 64,913 | 66,135 | -1,222 | -1.85% | 10.78 | 6,021.61 |
| Brentwood CDP | Suffolk | 61,374 | 60,664 | 710 | 1.17% | 10.98 | 5,589.62 | |
| 26 | Utica | Oneida | 60,652 | 62,235 | -1,583 | -2.54% | 16.76 | 3,618.85 |
| 27 | Clay | Onondaga | 59,606 | 58,206 | 1,400 | 2.41% | 47.96 | 1,242.83 |
| 28 | White Plains | Westchester | 58,241 | 56,853 | 1,388 | 2.44% | 9.77 | 5,961.21 |
| Tonawanda CDP | Erie | 58,149 | 58,144 | 5 | 0.01% | 17.3 | 3,361.21 | |
| 29 | Southampton | Suffolk | 58,119 | 56,790 | 1,329 | 2.34% | 139.19 | 417.55 |
| 30 | Hamburg | Erie | 58,097 | 56,936 | 1,161 | 2.04% | 41.32 | 1,406.03 |
| 31 | Hempstead village | Nassau | 55,555 | 53,891 | 1,664 | 3.09% | 3.68 | 15,096.47 |
| 32 | Union | Broome | 54,790 | 56,346 | -1,556 | -2.76% | 35.45 | 1,545.56 |
| Levittown CDP | Nassau | 51,593 | 51,881 | -288 | -0.56% | 6.81 | 7,576.06 | |
| Irondequoit CDP | Monroe | 51,337 | 51,692 | -355 | -0.69% | 15 | 3,422.47 | |
| 33 | Irondequoit | Monroe | 50,556 | 51,692 | -1,136 | -2.20% | 15 | 3,370.40 |
| 34 | Orangetown | Rockland | 50,324 | 49,212 | 1,112 | 2.26% | 24.1 | 2,088.13 |
| 35 | Troy | Rensselaer | 49,702 | 50,129 | -427 | -0.85% | 10.36 | 4,797.49 |
| 36 | Niagara Falls | Niagara | 48,632 | 50,193 | -1,561 | -3.11% | 14.09 | 3,451.53 |
| 37 | Rye | Westchester | 46,881 | 45,928 | 953 | 2.07% | 6.92 | 6,774.71 |
| 38 | Perinton | Monroe | 46,713 | 46,462 | 251 | 0.54% | 34.19 | 1,366.28 |
| 39 | Binghamton | Broome | 45,672 | 47,376 | -1,704 | -3.60% | 10.49 | 4,353.86 |
| 40 | West Seneca | Erie | 45,463 | 44,711 | 752 | 1.68% | 21.36 | 2,128.42 |
| West Seneca CDP | Erie | 45,089 | 44,711 | 378 | 0.85% | 21.36 | 2,110.91 | |
| 41 | Webster | Monroe | 44,743 | 42,641 | 2,102 | 4.93% | 33.53 | 1,334.42 |
| 42 | Mount Pleasant | Westchester | 44,556 | 43,724 | 832 | 1.90% | 27.42 | 1,624.95 |
| 43 | Poughkeepsie | Dutchess | 44,201 | 43,341 | 860 | 1.98% | 28.51 | 1,550.37 |
| 44 | Monroe | Orange | 43,819 | 39,912 | 3,907 | 9.79% | 19.98 | 2,193.14 |
| 45 | Henrietta | Monroe | 43,690 | 42,581 | 1,109 | 2.60% | 35.35 | 1,235.93 |
| 46 | Freeport village | Nassau | 43,279 | 42,860 | 419 | 0.98% | 4.63 | 9,347.52 |
| 47 | Lancaster | Erie | 43,158 | 41,604 | 1,554 | 3.74% | 37.7 | 1,144.77 |
| 48 | Cortlandt | Westchester | 42,821 | 41,592 | 1,229 | 2.95% | 39.25 | 1,090.98 |
| West Babylon CDP | Suffolk | 42,664 | 43,213 | -549 | -1.27% | 7.77 | 5,490.86 | |
| Hicksville CDP | Nassau | 42,333 | 41,547 | 786 | 1.89% | 6.79 | 6,234.61 | |
| Coram CDP | Suffolk | 40,685 | 39,113 | 1,572 | 4.02% | 13.82 | 2,943.92 | |
| 49 | Ossining | Westchester | 38,303 | 37,674 | 629 | 1.67% | 11.56 | 3,313.41 |
| East Meadow CDP | Nassau | 37,836 | 38,132 | -296 | -0.78% | 6.3 | 6,005.71 | |
| 50 | Valley Stream village | Nassau | 37,673 | 37,511 | 162 | 0.43% | 3.48 | 10,825.57 |
| 51 | Haverstraw | Rockland | 37,414 | 36,634 | 780 | 2.13% | 22.16 | 1,688.36 |
| Elmont CDP | Nassau | 37,388 | 33,198 | 4,190 | 12.62% | 3.37 | 11,094.36 | |
| 52 | Penfield | Monroe | 37,329 | 36,242 | 1,087 | 3.00% | 37.21 | 1,003.20 |
| 53 | Yorktown | Westchester | 36,996 | 36,081 | 915 | 2.54% | 36.64 | 1,009.72 |
| Brighton CDP | Monroe | 36,929 | 36,609 | 320 | 0.87% | 15.42 | 2,394.88 | |
| 54 | Clifton Park | Saratoga | 36,755 | 36,705 | 50 | 0.14% | 48.2 | 762.55 |
| 55 | Brighton | Monroe | 36,598 | 36,609 | -11 | -0.03% | 15.42 | 2,373.41 |
| Commack CDP | Suffolk | 35,914 | 36,124 | -210 | -0.58% | 11.97 | 3,000.33 | |
| 56 | Guilderland | Albany | 35,745 | 35,303 | 442 | 1.25% | 57.9 | 617.36 |
| 57 | Bethlehem | Albany | 35,324 | 33,656 | 1,668 | 4.96% | 49.03 | 720.46 |
| Central Islip CDP | Suffolk | 34,960 | 34,450 | 510 | 1.48% | 7.11 | 4,917.02 | |
| 58 | Carmel | Putnam | 34,225 | 34,305 | -80 | -0.23% | 35.91 | 953.08 |
| Huntington Station CDP | Suffolk | 34,088 | 33,029 | 1,059 | 3.21% | 5.47 | 6,231.81 | |
| New City CDP | Rockland | 33,722 | 33,559 | 163 | 0.49% | 15.58 | 2,164.44 | |
| 59 | Long Beach | Nassau | 33,717 | 33,275 | 442 | 1.33% | 2.21 | 15,256.56 |
| 60 | Riverhead | Suffolk | 33,637 | 33,506 | 131 | 0.39% | 67.43 | 498.84 |
| 61 | Salina | Onondaga | 33,149 | 33,710 | -561 | -1.66% | 13.75 | 2,410.84 |
| 62 | Eastchester | Westchester | 33,006 | 32,363 | 643 | 1.99% | 4.85 | 6,805.36 |
| Centereach CDP | Suffolk | 32,649 | 31,578 | 1,071 | 3.39% | 8.71 | 3,748.45 | |
| 63 | Spring Valley village | Rockland | 32,603 | 31,347 | 1,256 | 4.01% | 2.02 | 16,140.10 |
| 64 | Rome | Oneida | 32,415 | 33,725 | -1,310 | -3.88% | 74.79 | 433.41 |
| 65 | Clarence | Erie | 32,328 | 30,673 | 1,655 | 5.40% | 53.5 | 604.26 |
| 66 | Manlius | Onondaga | 32,210 | 32,370 | -160 | -0.49% | 49.22 | 654.41 |
| Franklin Square CDP | Nassau | 31,544 | 29,320 | 2,224 | 7.59% | 2.88 | 10,952.78 | |
| 67 | Warwick | Orange | 31,282 | 32,065 | -783 | -2.44% | 101.34 | 308.68 |
| 68 | Cicero | Onondaga | 31,212 | 31,632 | -420 | -1.33% | 48.27 | 646.61 |
| 69 | Ithaca | Tompkins | 30,756 | 30,014 | 742 | 2.47% | 5.39 | 5,706.12 |
| 70 | Newburgh | Orange | 30,704 | 29,801 | 903 | 3.03% | 42.68 | 719.40 |
| 71 | North Tonawanda | Niagara | 30,607 | 31,568 | -961 | -3.04% | 10.1 | 3,030.40 |
| Oceanside CDP | Nassau | 30,371 | 32,109 | -1,738 | -5.41% | 4.94 | 6,147.98 | |
| 72 | Poughkeepsie | Dutchess | 30,267 | 32,736 | -2,469 | -7.54% | 5.14 | 5,888.52 |
| 73 | Mamaroneck | Westchester | 29,878 | 29,156 | 722 | 2.48% | 6.65 | 4,492.93 |
| 74 | Jamestown | Chautauqua | 29,775 | 31,146 | -1,371 | -4.40% | 8.93 | 3,334.27 |
| Bay Shore CDP | Suffolk | 29,670 | 26,337 | 3,333 | 12.66% | 5.37 | 5,525.14 | |
| 75 | Orchard Park | Erie | 29,629 | 29,054 | 575 | 1.98% | 38.44 | 770.79 |
| 76 | Port Chester village | Westchester | 29,524 | 28,967 | 557 | 1.92% | 2.33 | 12,671.24 |
| 77 | Rotterdam | Schenectady | 29,519 | 29,094 | 425 | 1.46% | 35.69 | 827.09 |
| 78 | Pittsford | Monroe | 29,463 | 29,405 | 58 | 0.20% | 23.18 | 1,271.05 |
| 79 | East Fishkill | Dutchess | 29,439 | 29,029 | 410 | 1.41% | 56.5 | 521.04 |
| 80 | Glenville | Schenectady | 29,337 | 29,480 | -143 | -0.49% | 49.19 | 596.40 |
| 81 | Chili | Monroe | 28,794 | 28,625 | 169 | 0.59% | 39.5 | 728.96 |
| 82 | Wallkill | Orange | 28,710 | 27,426 | 1,284 | 4.68% | 62.11 | 462.24 |
| 83 | Gates | Monroe | 28,691 | 28,400 | 291 | 1.02% | 15.2 | 1,887.57 |
| 84 | Harrison village | Westchester | 28,340 | 27,472 | 868 | 3.16% | 16.77 | 1,689.92 |
| 85 | Newburgh | Orange | 28,200 | 28,866 | -666 | -2.31% | 3.8 | 7,421.05 |
| 86 | Vestal | Broome | 28,082 | 28,043 | 39 | 0.14% | 51.74 | 542.75 |
| 87 | Elmira | Chemung | 27,962 | 29,200 | -1,238 | -4.24% | 7.25 | 3,856.83 |
| 88 | Saratoga Springs | Saratoga | 27,763 | 26,586 | 1,177 | 4.43% | 28.06 | 989.42 |
| 89 | Queensbury | Warren | 27,675 | 27,901 | -226 | -0.81% | 62.83 | 440.47 |
| 90 | Middletown | Orange | 27,653 | 28,086 | -433 | -1.54% | 5.08 | 5,443.50 |
| Holbrook CDP | Suffolk | 27,533 | 27,195 | 338 | 1.24% | 7.18 | 3,834.68 | |
| Dix Hills CDP | Suffolk | 27,374 | 26,892 | 482 | 1.79% | 15.95 | 1,716.24 | |
| Deer Park CDP | Suffolk | 27,346 | 27,745 | -399 | -1.44% | 6.17 | 4,432.09 | |
| 91 | Glen Cove | Nassau | 27,341 | 26,964 | 377 | 1.40% | 6.65 | 4,111.43 |
| 92 | New Windsor | Orange | 27,272 | 25,244 | 2,028 | 8.03% | 34.07 | 800.47 |
| West Islip CDP | Suffolk | 27,224 | 28,335 | -1,111 | -3.92% | 6.33 | 4,300.79 | |
| 93 | Lindenhurst village | Suffolk | 27,074 | 27,253 | -179 | -0.66% | 3.76 | 7,200.53 |
| 94 | Auburn | Cayuga | 26,821 | 27,687 | -866 | -3.13% | 8.34 | 3,215.95 |
| 95 | Wappinger | Dutchess | 26,780 | 27,048 | -268 | -0.99% | 27.05 | 990.02 |
| Plainview CDP | Nassau | 26,199 | 26,217 | -18 | -0.07% | 5.73 | 4,572.25 | |
| Smithtown CDP | Suffolk | 25,974 | 26,470 | -496 | -1.87% | 11.63 | 2,233.36 | |
| 96 | Watertown | Jefferson | 25,900 | 27,023 | -1,123 | -4.16% | 9.02 | 2,871.40 |
| Shirley CDP | Suffolk | 25,691 | 27,854 | -2,163 | -7.77% | 11.46 | 2,241.80 | |
| 97 | De Witt | Onondaga | 25,467 | 25,838 | -371 | -1.44% | 33.77 | 754.13 |
| 98 | Ossining village | Westchester | 25,360 | 25,060 | 300 | 1.20% | 3.15 | 8,050.79 |
| Uniondale CDP | Nassau | 25,092 | 24,759 | 333 | 1.34% | 2.71 | 9,259.04 | |
| Medford CDP | Suffolk | 24,793 | 24,142 | 651 | 2.70% | 10.8 | 2,295.65 | |
| 99 | Camillus | Onondaga | 24,624 | 24,167 | 457 | 1.89% | 34.42 | 715.40 |
| 100 | Rockville Centre village | Nassau | 24,571 | 24,023 | 548 | 2.28% | 3.25 | 7,560.31 |
| Baldwin CDP | Nassau | 24,481 | 24,033 | 448 | 1.86% | 2.96 | 8,270.61 | |
| 101 | Peekskill | Westchester | 24,053 | 23,583 | 470 | 1.99% | 4.37 | 5,504.12 |
| 102 | Halfmoon | Saratoga | 23,898 | 21,535 | 2,363 | 10.97% | 32.58 | 733.52 |
| 103 | Montgomery | Orange | 23,763 | 22,606 | 1,157 | 5.12% | 50.26 | 472.80 |
| 104 | Fishkill | Dutchess | 23,553 | 22,107 | 1,446 | 6.54% | 27.34 | 861.49 |
| 105 | Kingston | Ulster | 23,210 | 23,893 | -683 | -2.86% | 7.49 | 3,098.80 |
| 106 | Kiryas Joel village | Orange | 23,094 | 20,175 | 2,919 | 14.47% | 1.11 | 20,805.41 |
| 107 | Onondaga | Onondaga | 22,958 | 23,101 | -143 | -0.62% | 57.74 | 397.61 |
| 108 | Lysander | Onondaga | 22,877 | 21,759 | 1,118 | 5.14% | 61.71 | 370.72 |
| Copiague CDP | Suffolk | 22,772 | 22,993 | -221 | -0.96% | 3.22 | 7,072.05 | |
| 109 | Garden City village | Nassau | 22,545 | 22,371 | 174 | 0.78% | 5.33 | 4,229.83 |
| East Patchogue CDP | Suffolk | 22,452 | 22,469 | -17 | -0.08% | 8.35 | 2,688.86 | |
| 110 | Niskayuna | Schenectady | 22,436 | 21,781 | 655 | 3.01% | 14.15 | 1,585.58 |
| 111 | Southold | Suffolk | 22,165 | 21,968 | 197 | 0.90% | 53.78 | 412.14 |
| Massapequa CDP | Nassau | 22,128 | 21,685 | 443 | 2.04% | 3.56 | 6,215.73 | |
| 112 | East Hampton | Suffolk | 22,009 | 21,457 | 552 | 2.57% | 74.33 | 296.10 |
| 113 | New Hartford | Oneida | 21,992 | 22,166 | -174 | -0.78% | 25.36 | 867.19 |
| 114 | Le Ray | Jefferson | 21,693 | 21,782 | -89 | -0.41% | 73.64 | 294.58 |
| 115 | Somers | Westchester | 21,345 | 20,434 | 911 | 4.46% | 29.64 | 720.14 |
| 116 | Hyde Park | Dutchess | 21,048 | 21,571 | -523 | -2.42% | 36.66 | 574.14 |
| Monsey CDP | Rockland | 21,001 | 18,412 | 2,589 | 14.06% | 2.27 | 9,251.54 | |
| Rotterdam CDP | Schenectady | 20,949 | 20,652 | 297 | 1.44% | 6.93 | 3,022.94 | |
| 117 | Grand Island | Erie | 20,829 | 20,374 | 455 | 2.23% | 28.27 | 736.79 |
| Hauppauge CDP | Suffolk | 20,616 | 20,882 | -266 | -1.27% | 10.71 | 1,924.93 | |
| Merrick CDP | Nassau | 20,572 | 22,097 | -1,525 | -6.90% | 4.02 | 5,117.41 | |
| 118 | Ithaca | Tompkins | 20,492 | 19,930 | 562 | 2.82% | 28.95 | 707.84 |
| 119 | Lockport | Niagara | 20,480 | 21,165 | -685 | -3.24% | 8.4 | 2,438.10 |
| 120 | Ogden | Monroe | 20,264 | 19,856 | 408 | 2.05% | 36.48 | 555.48 |
| North Bellmore CDP | Nassau | 20,153 | 19,941 | 212 | 1.06% | 2.62 | 7,691.98 | |
| North Bay Shore CDP | Suffolk | 20,127 | 18,944 | 1,183 | 6.24% | 3.25 | 6,192.92 | |
| Selden CDP | Suffolk | 20,123 | 19,851 | 272 | 1.37% | 4.32 | 4,658.10 | |
| 121 | Lockport | Niagara | 20,094 | 20,529 | -435 | -2.12% | 44.84 | 448.13 |
| Holtsville CDP | Suffolk | 20,081 | 19,714 | 367 | 1.86% | 7.11 | 2,824.33 | |
| Lake Ronkonkoma CDP | Suffolk | 19,943 | 20,155 | -212 | -1.05% | 4.94 | 4,037.04 | |
| North Amityville CDP | Suffolk | 19,895 | 17,862 | 2,033 | 11.38% | 2.35 | 8,465.96 | |
| Eastchester CDP | Westchester | 19,885 | 19,554 | 331 | 1.69% | 3.29 | 6,044.07 | |
| East Massapequa CDP | Nassau | 19,843 | 19,069 | 774 | 4.06% | 3.44 | 5,768.31 | |
| 122 | Plattsburgh | Clinton | 19,780 | 19,989 | -209 | -1.05% | 5.02 | 3,940.24 |
| East Northport CDP | Suffolk | 19,682 | 20,217 | -535 | -2.65% | 5.16 | 3,814.34 | |
| 123 | Lynbrook village | Nassau | 19,567 | 19,427 | 140 | 0.72% | 2.01 | 9,734.83 |
| 124 | Horseheads | Chemung | 19,393 | 19,485 | -92 | -0.47% | 35.61 | 544.59 |
| 125 | Mamaroneck village | Westchester | 19,356 | 18,929 | 427 | 2.26% | 3.17 | 6,105.99 |
| 126 | Mineola village | Nassau | 19,245 | 18,799 | 446 | 2.37% | 1.88 | 10,236.70 |
| 127 | Milton | Saratoga | 19,187 | 18,575 | 612 | 3.29% | 35.69 | 537.60 |
| Syosset CDP | Nassau | 19,157 | 18,829 | 328 | 1.74% | 4.97 | 3,854.53 | |
| 128 | Saugerties | Ulster | 19,097 | 19,482 | -385 | -1.98% | 64.57 | 295.76 |
| West Hempstead CDP | Nassau | 19,012 | 18,862 | 150 | 0.80% | 2.66 | 7,147.37 | |
| 129 | Owego | Tioga | 18,946 | 19,883 | -937 | -4.71% | 104.22 | 181.79 |
| Wantagh CDP | Nassau | 18,939 | 18,871 | 68 | 0.36% | 3.83 | 4,944.91 | |
| 130 | Cortland | Cortland | 18,795 | 19,204 | -409 | -2.13% | 3.89 | 4,831.62 |
| North Massapequa CDP | Nassau | 18,749 | 17,886 | 863 | 4.83% | 3 | 6,249.67 | |
| Melville CDP | Suffolk | 18,682 | 18,985 | -303 | -1.60% | 12.09 | 1,545.24 | |
| Nanuet CDP | Rockland | 18,678 | 17,882 | 796 | 4.45% | 5.43 | 3,439.78 | |
| Ronkonkoma CDP | Suffolk | 18,634 | 19,082 | -448 | -2.35% | 7.83 | 2,379.82 | |
| 131 | Whitestown | Oneida | 18,474 | 18,667 | -193 | -1.03% | 27.32 | 676.21 |
| Islip CDP | Suffolk | 18,433 | 18,689 | -256 | -1.37% | 4.8 | 3,840.21 | |
| 132 | Wheatfield | Niagara | 18,284 | 18,117 | 167 | 0.92% | 27.91 | 655.11 |
| 133 | Southeast | Putnam | 18,168 | 18,404 | -236 | -1.28% | 31.73 | 572.58 |
| 134 | New Castle | Westchester | 18,100 | 17,569 | 531 | 3.02% | 23.24 | 778.83 |
| Huntington CDP | Suffolk | 17,917 | 18,046 | -129 | -0.71% | 7.59 | 2,360.61 | |
| 135 | Scarsdale village | Westchester | 17,909 | 17,166 | 743 | 4.33% | 6.66 | 2,689.04 |
| 136 | Bedford | Westchester | 17,906 | 17,335 | 571 | 3.29% | 37.17 | 481.73 |
| 137 | Lackawanna | Erie | 17,868 | 18,141 | -273 | -1.50% | 6.57 | 2,719.63 |
| 138 | Amsterdam | Montgomery | 17,858 | 18,620 | -762 | -4.09% | 5.86 | 3,047.44 |
| North Valley Stream CDP | Nassau | 17,845 | 16,628 | 1,217 | 7.32% | 1.86 | 9,594.09 | |
| Kings Park CDP | Suffolk | 17,823 | 17,282 | 541 | 3.13% | 6.2 | 2,874.68 | |
| 139 | Blooming Grove | Orange | 17,676 | 18,028 | -352 | -1.95% | 34.74 | 508.81 |
| 140 | Oswego | Oswego | 17,599 | 18,142 | -543 | -2.99% | 7.61 | 2,312.61 |
| North Babylon CDP | Suffolk | 17,228 | 17,509 | -281 | -1.60% | 3.37 | 5,112.17 | |
| Woodmere CDP | Nassau | 17,217 | 17,121 | 96 | 0.56% | 2.55 | 6,751.76 | |
| 141 | Massapequa Park village | Nassau | 17,202 | 17,008 | 194 | 1.14% | 2.21 | 7,783.71 |
| 142 | Cohoes | Albany | 16,883 | 16,168 | 715 | 4.42% | 3.77 | 4,478.25 |
| 143 | Wilton | Saratoga | 16,785 | 16,173 | 612 | 3.78% | 35.83 | 468.46 |
| 144 | Geddes | Onondaga | 16,652 | 17,118 | -466 | -2.72% | 9.16 | 1,817.90 |
| Roosevelt CDP | Nassau | 16,645 | 16,258 | 387 | 2.38% | 1.77 | 9,403.95 | |
| Sayville CDP | Suffolk | 16,621 | 16,853 | -232 | -1.38% | 5.29 | 3,141.97 | |
| 145 | East Greenbush | Rensselaer | 16,462 | 16,473 | -11 | -0.07% | 24.02 | 685.35 |
| Pearl River CDP | Rockland | 16,383 | 15,876 | 507 | 3.19% | 6.8 | 2,409.26 | |
| Bethpage CDP | Nassau | 16,315 | 16,429 | -114 | -0.69% | 3.58 | 4,557.26 | |
| Port Washington CDP | Nassau | 16,233 | 15,846 | 387 | 2.44% | 4.18 | 3,883.49 | |
| 146 | Evans | Erie | 16,191 | 16,356 | -165 | -1.01% | 41.53 | 389.86 |
| 147 | Potsdam | St. Lawrence | 16,159 | 16,041 | 118 | 0.74% | 101.4 | 159.36 |
| Mastic CDP | Suffolk | 16,084 | 15,481 | 603 | 3.90% | 3.9 | 4,124.10 | |
| 148 | Lewiston | Niagara | 16,015 | 16,262 | -247 | -1.52% | 37.12 | 431.44 |
| 149 | Rye | Westchester | 15,980 | 15,720 | 260 | 1.65% | 5.85 | 2,731.62 |
| 150 | Floral Park village | Nassau | 15,951 | 15,863 | 88 | 0.55% | 1.42 | 11,233.10 |
| 151 | Malta | Saratoga | 15,892 | 14,765 | 1,127 | 7.63% | 27.92 | 569.20 |
| Bellmore CDP | Nassau | 15,871 | 16,218 | -347 | -2.14% | 2.36 | 6,725.00 | |
| 152 | Parma | Monroe | 15,771 | 15,633 | 138 | 0.88% | 42.02 | 375.32 |
| Farmingville CDP | Suffolk | 15,690 | 15,481 | 209 | 1.35% | 4.12 | 3,808.25 | |
| Eggertsville CDP | Erie | 15,675 | 15,019 | 656 | 4.37% | 2.85 | 5,500.00 | |
| Seaford CDP | Nassau | 15,656 | 15,294 | 362 | 2.37% | 2.61 | 5,998.47 | |
| 153 | La Grange | Dutchess | 15,634 | 15,730 | -96 | -0.61% | 39.88 | 392.03 |
| 154 | Stony Point | Rockland | 15,475 | 15,059 | 416 | 2.76% | 27.62 | 560.28 |
| 155 | Westbury village | Nassau | 15,384 | 15,146 | 238 | 1.57% | 2.37 | 6,491.14 |
| 156 | Moreau | Saratoga | 15,275 | 14,728 | 547 | 3.71% | 41.92 | 364.38 |
| 157 | Sullivan | Madison | 15,225 | 15,339 | -114 | -0.74% | 73.16 | 208.11 |
| 158 | Depew village | Erie | 15,190 | 15,303 | -113 | -0.74% | 5.07 | 2,996.06 |
| North New Hyde Park CDP | Nassau | 15,177 | 14,899 | 278 | 1.87% | 1.97 | 7,704.06 | |
| 159 | Kenmore village | Erie | 15,143 | 15,423 | -280 | -1.82% | 1.44 | 10,515.97 |
| South Farmingdale CDP | Nassau | 15,130 | 14,486 | 644 | 4.45% | 2.22 | 6,815.32 | |
| 160 | Gloversville | Fulton | 14,940 | 15,665 | -725 | -4.63% | 5.14 | 2,906.61 |
| Jefferson Valley-Yorktown CDP | Westchester | 14,923 | 14,142 | 781 | 5.52% | 6.93 | 2,153.39 | |
| 161 | Dryden | Tompkins | 14,921 | 14,435 | 486 | 3.37% | 93.64 | 159.34 |
| 162 | Thompson | Sullivan | 14,894 | 15,308 | -414 | -2.70% | 84.09 | 177.12 |
| 163 | Tonawanda | Erie | 14,858 | 15,130 | -272 | -1.80% | 3.8 | 3,910.00 |
| 164 | Batavia | Genesee | 14,801 | 15,465 | -664 | -4.29% | 5.2 | 2,846.35 |
| 165 | Victor | Ontario | 14,773 | 14,275 | 498 | 3.49% | 35.92 | 411.28 |
| 166 | Mastic Beach village | Suffolk | 14,760 | 10,936 | 3,824 | 34.97% | 4.2 | 3,514.29 |
| 167 | Johnson City village | Broome | 14,673 | 15,174 | -501 | -3.30% | 4.54 | 3,231.94 |
| Greece CDP | Monroe | 14,568 | 14,519 | 49 | 0.34% | 4.37 | 3,333.64 | |
| Manorville CDP | Suffolk | 14,501 | 14,314 | 187 | 1.31% | 25.47 | 569.34 | |
| Greenlawn CDP | Suffolk | 14,481 | 13,742 | 739 | 5.38% | 3.72 | 3,892.74 | |
| 168 | Beekman | Dutchess | 14,385 | 14,621 | -236 | -1.61% | 29.84 | 482.07 |
| Setauket-East Setauket CDP | Suffolk | 14,346 | 15,477 | -1,131 | -7.31% | 8.52 | 1,683.80 | |
| 169 | Glens Falls | Warren | 14,328 | 14,700 | -372 | -2.53% | 3.85 | 3,721.56 |
| 170 | Beacon | Dutchess | 14,271 | 15,541 | -1,270 | -8.17% | 4.74 | 3,010.76 |
| Riverhead CDP | Suffolk | 14,258 | 13,299 | 959 | 7.21% | 15.08 | 945.49 | |
| 171 | Pomfret | Chautauqua | 14,244 | 14,965 | -721 | -4.82% | 43.85 | 324.83 |
| 172 | Sweden | Monroe | 14,184 | 14,175 | 9 | 0.06% | 33.68 | 421.14 |
| 173 | New Paltz | Ulster | 14,108 | 14,003 | 105 | 0.75% | 33.87 | 416.53 |
| 174 | Malone | Franklin | 14,092 | 14,545 | -453 | -3.11% | 101.52 | 138.81 |
| 175 | Shawangunk | Ulster | 14,063 | 14,332 | -269 | -1.88% | 56.06 | 250.86 |
| Fort Drum CDP | Jefferson | 13,985 | 12,955 | 1,030 | 7.95% | 14.33 | 975.92 | |
| 176 | Goshen | Orange | 13,980 | 13,687 | 293 | 2.14% | 43.64 | 320.35 |
| 177 | Oneonta | Otsego | 13,955 | 13,901 | 54 | 0.39% | 4.36 | 3,200.69 |
| New Cassel CDP | Nassau | 13,903 | 14,059 | -156 | -1.11% | 1.48 | 9,393.92 | |
| Stony Brook CDP | Suffolk | 13,889 | 13,740 | 149 | 1.08% | 5.81 | 2,390.53 | |
| Nesconset CDP | Suffolk | 13,876 | 13,387 | 489 | 3.65% | 3.82 | 3,632.46 | |
| 178 | Aurora | Erie | 13,805 | 13,782 | 23 | 0.17% | 36.39 | 379.36 |
| East Islip CDP | Suffolk | 13,802 | 14,475 | -673 | -4.65% | 3.95 | 3,494.18 | |
| 179 | Olean | Cattaraugus | 13,794 | 14,452 | -658 | -4.55% | 5.91 | 2,334.01 |
| Jericho CDP | Nassau | 13,746 | 13,567 | 179 | 1.32% | 3.94 | 3,488.83 | |
| 180 | Arcadia | Wayne | 13,686 | 14,244 | -558 | -3.92% | 52.03 | 263.04 |
| Rocky Point CDP | Suffolk | 13,593 | 14,014 | -421 | -3.00% | 11.3 | 1,202.92 | |
| St. James CDP | Suffolk | 13,536 | 13,338 | 198 | 1.48% | 4.56 | 2,968.42 | |
| 181 | Van Buren | Onondaga | 13,318 | 13,185 | 133 | 1.01% | 35.41 | 376.11 |
| 182 | Kent | Putnam | 13,283 | 13,507 | -224 | -1.66% | 40.5 | 327.98 |
| 183 | Schodack | Rensselaer | 13,151 | 12,794 | 357 | 2.79% | 61.93 | 212.35 |
| 184 | Endicott village | Broome | 12,992 | 13,392 | -400 | -2.99% | 3.19 | 4,072.73 |
| 185 | Geneva | Ontario & Seneca | 12,988 | 13,261 | -273 | -2.06% | 4.21 | 3,085.04 |
| 186 | Farmington | Ontario | 12,945 | 11,825 | 1,120 | 9.47% | 39.43 | 328.30 |
| Mastic Beach CDP | Suffolk | 12,930 | 12,930 | 0 | 0.00% | 4.71 | 2,745.22 | |
| Stony Point CDP | Rockland | 12,882 | 12,147 | 735 | 6.05% | 5.44 | 2,368.01 | |
| Hampton Bays CDP | Suffolk | 12,866 | 13,603 | -737 | -5.42% | 12.95 | 993.51 | |
| 187 | Fallsburg | Sullivan | 12,845 | 12,870 | -25 | -0.19% | 77.62 | 165.49 |
| Ridge CDP | Suffolk | 12,835 | 13,336 | -501 | -3.76% | 13.21 | 971.61 | |
| 188 | Wawarsing | Ulster | 12,833 | 13,157 | -324 | -2.46% | 130.5 | 98.34 |
| 189 | Brunswick | Rensselaer | 12,778 | 11,941 | 837 | 7.01% | 44.35 | 288.12 |
| 190 | Lewisboro | Westchester | 12,766 | 12,411 | 355 | 2.86% | 27.75 | 460.04 |
| 191 | German Flatts | Herkimer | 12,710 | 13,258 | -548 | -4.13% | 33.7 | 377.15 |
| 192 | Pelham | Westchester | 12,585 | 12,396 | 189 | 1.52% | 2.17 | 5,799.54 |
| 193 | Cornwall | Orange | 12,480 | 12,646 | -166 | -1.31% | 26.65 | 468.29 |
| Salisbury CDP | Nassau | 12,467 | 12,093 | 374 | 3.09% | 1.74 | 7,164.94 | |
| 194 | Ulster | Ulster | 12,455 | 12,327 | 128 | 1.04% | 26.8 | 464.74 |
| 195 | Kingsbury | Washington | 12,453 | 12,671 | -218 | -1.72% | 39.68 | 313.84 |
| Mount Sinai CDP | Suffolk | 12,451 | 12,118 | 333 | 2.75% | 6 | 2,075.17 | |
| 196 | Patchogue village | Suffolk | 12,449 | 11,798 | 651 | 5.52% | 2.26 | 5,508.41 |
| 197 | Massena | St. Lawrence | 12,357 | 12,883 | -526 | -4.08% | 44.37 | 278.50 |
| 198 | North Castle | Westchester | 12,330 | 11,841 | 489 | 4.13% | 23.76 | 518.94 |
| Terryville CDP | Suffolk | 12,296 | 11,849 | 447 | 3.77% | 3.21 | 3,830.53 | |
| 199 | North Greenbush | Rensselaer | 12,212 | 12,075 | 137 | 1.13% | 18.55 | 658.33 |
| 200 | Highlands | Orange | 12,138 | 12,492 | -354 | -2.83% | 30.41 | 399.15 |
| 201 | Haverstraw village | Rockland | 12,129 | 11,910 | 219 | 1.84% | 1.98 | 6,125.76 |
| 202 | Babylon village | Suffolk | 12,079 | 12,166 | -87 | -0.72% | 2.44 | 4,950.41 |
| North Merrick CDP | Nassau | 12,077 | 12,272 | -195 | -1.59% | 1.72 | 7,021.51 | |
| 203 | Bath | Steuben | 12,057 | 12,379 | -322 | -2.60% | 95.32 | 126.49 |
| 204 | Chester | Orange | 11,944 | 11,981 | -37 | -0.31% | 25.05 | 476.81 |
| 205 | Dunkirk | Chautauqua | 11,940 | 12,563 | -623 | -4.96% | 4.5 | 2,653.33 |
| 206 | Patterson | Putnam | 11,909 | 12,023 | -114 | -0.95% | 32.21 | 369.73 |
| 207 | Plattsburgh | Clinton | 11,877 | 11,870 | 7 | 0.06% | 45.92 | 258.65 |
| 208 | Elma | Erie | 11,802 | 11,317 | 485 | 4.29% | 34.52 | 341.89 |
| North Wantagh CDP | Nassau | 11,713 | 11,960 | -247 | -2.07% | 1.9 | 6,164.74 | |
| North Lindenhurst CDP | Suffolk | 11,679 | 11,652 | 27 | 0.23% | 1.92 | 6,082.81 | |
| 209 | Woodbury | Orange | 11,637 | 11,353 | 284 | 2.50% | 36.12 | 322.18 |
| North Bellport CDP | Suffolk | 11,623 | 11,545 | 78 | 0.68% | 4.94 | 2,352.83 | |
| 210 | Putnam Valley | Putnam | 11,616 | 11,809 | -193 | -1.63% | 41.17 | 282.15 |
| 211 | Lansing | Tompkins | 11,608 | 11,033 | 575 | 5.21% | 60.49 | 191.90 |
| Wyandanch CDP | Suffolk | 11,558 | 11,647 | -89 | -0.76% | 4.47 | 2,585.68 | |
| 212 | Tarrytown village | Westchester | 11,532 | 11,277 | 255 | 2.26% | 2.93 | 3,935.84 |
| Endwell CDP | Broome | 11,445 | 11,446 | -1 | -0.01% | 3.74 | 3,060.16 | |
| 213 | Mamakating | Sullivan | 11,426 | 12,085 | -659 | -5.45% | 96.11 | 118.88 |
| 214 | Fulton | Oswego | 11,402 | 11,896 | -494 | -4.15% | 3.75 | 3,040.53 |
| 215 | Catskill | Greene | 11,365 | 11,775 | -410 | -3.48% | 60.44 | 188.04 |
| Miller Place CDP | Suffolk | 11,312 | 12,339 | -1,027 | -8.32% | 6.55 | 1,727.02 | |
| 216 | Red Hook | Dutchess | 11,181 | 11,319 | -138 | -1.22% | 36.17 | 309.12 |
| 217 | Lake Grove village | Suffolk | 11,162 | 11,163 | -1 | -0.01% | 2.95 | 3,783.73 |
| 218 | Canandaigua | Ontario | 11,161 | 10,020 | 1,141 | 11.39% | 56.8 | 196.50 |
| 219 | Canton | St. Lawrence | 11,116 | 10,995 | 121 | 1.10% | 104.76 | 106.11 |
| 220 | Mount Kisco village | Westchester | 11,103 | 10,877 | 226 | 2.08% | 3.04 | 3,652.30 |
| 221 | Dobbs Ferry village | Westchester | 11,093 | 10,875 | 218 | 2.00% | 2.43 | 4,565.02 |
| 222 | Oneida | Madison | 11,080 | 11,393 | -313 | -2.75% | 22.05 | 502.49 |
| 223 | Woodbury village | Orange | 10,986 | 10,686 | 300 | 2.81% | 35.6 | 308.60 |
| 224 | Suffern village | Rockland | 10,948 | 10,723 | 225 | 2.10% | 2.09 | 5,238.28 |
| Elwood CDP | Suffolk | 10,941 | 11,177 | -236 | -2.11% | 4.78 | 2,288.91 | |
| 225 | Chenango | Broome | 10,876 | 11,252 | -376 | -3.34% | 33.83 | 321.49 |
| 226 | Corning | Steuben | 10,812 | 11,183 | -371 | -3.32% | 3.08 | 3,510.39 |
| 227 | Ogdensburg | St. Lawrence | 10,743 | 11,128 | -385 | -3.46% | 4.96 | 2,165.93 |
| 228 | Geneseo | Livingston | 10,726 | 10,483 | 243 | 2.32% | 43.94 | 244.11 |
| 229 | Fredonia village | Chautauqua | 10,639 | 11,230 | -591 | -5.26% | 5.19 | 2,049.90 |
| 230 | Lloyd | Ulster | 10,517 | 10,863 | -346 | -3.19% | 31.27 | 336.33 |
| 231 | Massena village | St. Lawrence | 10,468 | 10,936 | -468 | -4.28% | 4.52 | 2,315.93 |
| 232 | Southport | Chemung | 10,415 | 10,940 | -525 | -4.80% | 46.41 | 224.41 |
| 233 | Canandaigua | Ontario | 10,369 | 10,545 | -176 | -1.67% | 4.59 | 2,259.04 |
| 234 | West Haverstraw village | Rockland | 10,345 | 10,165 | 180 | 1.77% | 1.52 | 6,805.92 |
| 235 | Plattekill | Ulster | 10,219 | 10,499 | -280 | -2.67% | 35.11 | 291.06 |
| 236 | Great Neck village | Nassau | 10,218 | 9,989 | 229 | 2.29% | 1.33 | 7,682.71 |
| 237 | Sleepy Hollow village | Westchester | 10,198 | 9,870 | 328 | 3.32% | 2.16 | 4,721.30 |
| Valley Cottage CDP | Rockland | 10,191 | 9,107 | 1,084 | 11.90% | 4.3 | 2,370.00 | |
| 238 | Lancaster village | Erie | 10,165 | 10,352 | -187 | -1.81% | 2.7 | 3,764.81 |
| 239 | Watervliet | Albany | 10,120 | 10,254 | -134 | -1.31% | 1.35 | 7,496.30 |
| Fairmount CDP | Onondaga | 10,106 | 10,224 | -118 | -1.15% | 3.33 | 3,034.83 | |
| 240 | Kirkland | Oneida | 10,105 | 10,315 | -210 | -2.04% | 33.78 | 299.14 |
| 241 | Ontario | Wayne | 10,064 | 10,136 | -72 | -0.71% | 32.41 | 310.52 |
| Inwood CDP | Nassau | 10,052 | 9,792 | 260 | 2.66% | 1.7 | 5,912.94 | |
| 242 | Alden | Erie | 10,034 | 10,865 | -831 | -7.65% | 34.31 | 292.45 |
| Bohemia CDP | Suffolk | 9,977 | 10,180 | -203 | -1.99% | 8.62 | 1,157.42 | |
| Middle Island CDP | Suffolk | 9,949 | 10,483 | -534 | -5.09% | 8.24 | 1,207.40 | |
| 243 | Herkimer | Herkimer | 9,822 | 10,175 | -353 | -3.47% | 31.66 | 310.23 |
| Fort Salonga CDP | Suffolk | 9,821 | 10,008 | -187 | -1.87% | 9.83 | 999.08 |
Annual Estimates of the Resident Population: April 1, 2010 to July 1, 2016
Source: U.S. Census Bureau, Population Division
Release Date: May 2017.
The 30-year fixed mortgage is the most popular type of mortgage loan in New York. The 15-year fixed rate mortgage is a great way to build equity faster & save money on interest expenses if you can afford the higher monthly loan payment.
NYC has high real estate prices which can make saving for a down payment difficult. The piggyback loan can eliminate the need for private mortgage insurance by covering 80% of the home's value with the first loan, while the second loan helps to pay for part of the down payment. This mortgage is a good way to avoid the standard 20% down payment, which is required by most private banks to bypass PMI.
Most private banks give their best rates to borrowers with credit scores above 740, but loans with higher interest rates can be obtained with lower scores. Mortgage underwriters prefer debt-to-income ratios to be below 40%, but other factors are considered on the loan application.
People in finance who have significant financial assets & can achieve high rates of return may be more inclinded to choose an adjustable rate mortgage or interest-only loan to maximize their income tax write off from the interest payments, though the 2017 TCJA put a cap of $10,000 on state & local taxes (SALT) deductions & limited the cap on mortgage interest deductibility to the interest on $375,000 of principal for people filing individually & $750,000 for married couples filing jointly. Balloon loans have low monthly payments and are required to be paid off with a lump sum or refinanced at a future date. Adjustable rate loans are not widely popular across the United States as most home buyers prefer the security and stability offered by fixed-rate loans. In expensive coastal states like New York an above average share of loans are structured as ARMs. Buyers who anticipate further home price appreciation or raises at work may prefer the lower upfront payments an ARM offers & hope to be able to refinance into a fixed-rate loan before rates reset higher.
Relatively high real estate prices around the New York City metro area make a large portion of loans jumbo mortgages, as they exceed the conforming limit. As of 2026 the conforming loan limit across the United States is set to 832,750, with a ceiling of up to 150% that amount in areas where median home values are higher. Jumbo loans typically have a slightly higher rate of interest than conforming mortgages, though spreads vary based on credit market conditions. Upstate New York homes are typically affordable enough to qualify for the default limit, whereas many downstate areas close to the city tend to be designated as HERA high cost areas. Here are the conforming mortgage limits across the state.
| County | Metropolitan Area | 1 Unit Limit | 2 Unit Limit | 3 Unit Limit | 4 Unit Limit |
|---|---|---|---|---|---|
| Bronx | New York-Newark-Jersey City, Ny-Nj-Pa | $1,209,750 | $1,548,975 | $1,872,225 | $2,326,875 |
| Kings | New York-Newark-Jersey City, Ny-Nj-Pa | $1,209,750 | $1,548,975 | $1,872,225 | $2,326,875 |
| Nassau | New York-Newark-Jersey City, Ny-Nj-Pa | $1,209,750 | $1,548,975 | $1,872,225 | $2,326,875 |
| New York | New York-Newark-Jersey City, Ny-Nj-Pa | $1,209,750 | $1,548,975 | $1,872,225 | $2,326,875 |
| Putnam | New York-Newark-Jersey City, Ny-Nj-Pa | $1,209,750 | $1,548,975 | $1,872,225 | $2,326,875 |
| Queens | New York-Newark-Jersey City, Ny-Nj-Pa | $1,209,750 | $1,548,975 | $1,872,225 | $2,326,875 |
| Richmond | New York-Newark-Jersey City, Ny-Nj-Pa | $1,209,750 | $1,548,975 | $1,872,225 | $2,326,875 |
| Rockland | New York-Newark-Jersey City, Ny-Nj-Pa | $1,209,750 | $1,548,975 | $1,872,225 | $2,326,875 |
| Suffolk | New York-Newark-Jersey City, Ny-Nj-Pa | $1,209,750 | $1,548,975 | $1,872,225 | $2,326,875 |
| Westchester | New York-Newark-Jersey City, Ny-Nj-Pa | $1,209,750 | $1,548,975 | $1,872,225 | $2,326,875 |
| All Others | Rest of the State | $832,750 | $1,066,250 | $1,288,800 | $1,601,750 |
Federal Programs
FHA mortgages are a popular option for some borrowers, but the FHA loan limit varies throughout the state. The FHA loan limit is as low as $524,225 in most of upstate New York but rises to $1,209,750 in the New York City metropolitan area. Mortgage rates in New York tend to be above the national average but still well below the highest rates. USDA loans can help people with low incomes in rural parts of the state qualify for a subsidized low-interest loan. VA loans are a popular choice for veterans.
State & Local Programs
In addition to all of the federal assistance programs for homebuyers, New York State has a variety of its own programs designed to help first-time and lower-income homebuyers. The State of New York Mortgage Agency (SONYMA) administers five mortgage programs. SONYMA received funding for these programs through the sale of tax-exempt bonds.
The Achieving the Dream program offers some of SONYMA's lowest interest rates. The program features a fixed interest rate and is available for the purchase of both one and two-family homes. Achieving the Dream targets first-time and low-income homebuyers who may not otherwise be able to receive financing for a home purchase.
The State of New York has its own mortgage assistance program for military veterans. The Homes For Veterans program provides assistance with a down payment, low interest rate, no points or origination fees, and a 1% minimum borrower cash contribution. Candidates for assistance through the Homes for Veterans program do need to be military veterans but do not have to be first-time homebuyers.
SONYMA has a special loan assistance program for borrowers purchasing homes that require renovation. The Remodel New York program allows borrowers to obtain one loan to finance both the purchase and renovation project costs. Borrowers have to be first-time homebuyers to receive financing through this program. Remodel New York loans have no points or origination fees, low interest rates, and no prepayment penalties. Borrowers are able to have as little as a 3% down payment and can choose either 30-year or 40-year loan maturity.
There is an additional program for first-time homebuyers called the Low Interest Rate loan program. This serves as the standard assistance program in New York for borrowers who meet the income and purchase price restrictions. The Low Interest Rate loan program features low interest rates, low down payment requirements, and no points or origination fees. In addition, these loans offer a special payment protection feature designed to assist borrowers in the event of an accident or temporary job loss.
New York State also features an assistance program that encourages construction of one and two-family homes. The Construction Incentive program provides financing with as little as a 3% down payment. Loans for the Construction Incentive program can only be obtained from one of the select participating lenders throughout the state.
Further information on state programs can be obtained from the State of New York Mortgage Agency, New York City Housing Development Corporation, and the New York State Housing Finance Agency.
Standard homeowner's insurance policies typically cover damages from natural disasters other than earthquakes & flooding. Earthquake and flood coverage require supplemental policies.
The state of New York has a very low risk of tornadoes, with the county of Albany being the only county statewide with a risk of low.
Hail damage is quite common across the state. Here is a list of counties with a risk of hail damage above low.
Homeowner's insurance policies typically do not cover flooding. Here are counties across the state which have a risk profile above very low for either flooding or hurricane storm surges.
Home buyers with mortgages in high-risk areas are required to buy flood insurance. Most flood insurance policies are sold by the United States federal government through The National Flood Insurance Program. Under-priced flood insurance in high-risk areas act as a subsidy to wealthy homeowners.
The NFIP does not charge nearly enough to cover the expected costs of its liabilities. The assessments are not sufficient to build any buffer to cover an extraordinary year, such as what occurred with Hurricane Katrina in 2005 or Hurricane Sandy in 2012. Because homeowners don't incur the full cost of building in a flood zone we end up with more houses there than if homeowners incurred the full cost of the flood risk, which exacerbates the government's costs in the next disaster.
Typically, homes built after 2002, when building code regulations tightened, are subject to lower insurance rates than older homes. On the other hand, homes without hurricane straps, with roofs that do not meet current standards for wind, with older plumbing or with outdated electrical systems may be difficult or very expensive to insure.
Homeowners who live in lower risk areas & are not required to purchase flood insurance heavily cross-subsidize homeowners who are in areas where floods are more common.
Most of the state has a very low eathquake risk, but the northwestern part of New York has a low to moderate earthquake risk. The metro New York City area is considered to have a low earthquake risk. Here are the counties which fall into the low & moderate risk categories.
Standard rental and homeowner insurance policies typically do not cover earthquake damage, though they usually cover losses caused by fires which resulted from an earthquake. You can supplement your homeowner's insurance with an earthquake policy.
The risk of wildfires is very low across most of the state, however it is significantly elevated donwnstate, in the northewest of the state in the southeast parts of the state bordering Connecticut & Massachusettes. Here is a list of counties with risk above very low.
Fire damages from wildfires & other types of fires are typically covered in most homeowner's insurance policies. If you own expensive items you may want to keep an up-to-date household inventory list which lists specific valuables, such as fine art & jewelry.
In 2016 New York homeowners were assessed an average of 1.88% in property taxes, costing $7,013 per year. In the city average property taxes run $9,384. Only the state of New Jersey has a higher average out of pocket expense than the state of New York. The Bridgeport-Stamford-Norwalk are of Connecticut are one of the few areas with higher median property taxes than New York City.
Foreclosure proceedings in New York are accomplished using the judicial foreclosure process. The lender usually initiates foreclosure after two or three months of delinquent payments. Borrower default triggers the acceleration clause, the lender requests full repayment of the loan, and the lender files for foreclosure through the courts. The borrower and lender go before a judge, who decides whether or not to approve the foreclosure request. If the judge upholds the foreclosure, the lender can either hold the property to sell or can sell the property at a foreclosure auction.
It is important to note that New York is what is called a "full recourse" state. This means that the borrower is 100% fully liable for the outstanding mortgage debt. If the lender receives less through the foreclosure and sale of the property than the borrower owed on the mortgage, the lender can take legal action against the borrower for the remaining balance. The lender can seize assets, garnish wages, or obtain a judgment against the borrower until the excess balance gets repaid.
Before a potential buyer submits an offer on a home, the real estate agent must provide a "Real Estate Transfer Disclosure Statement" to the potential buyer. The document includes all equipment (refrigerator, smoke alarm etc.) included in the house, as well as potential hazards.
In July 2002, New York issued a number of anti-predatory lending laws aimed at protecting buyers - prohibiting the charging of points and fees exceeding 6% of the total principal financed amount and prohibiting the use of single-premium credit insurance for financing.
While other forms of debt agreements were contingent upon the flow of goods, services or cash streams that could pay for the accruing interest, the mortgage is a real estate contract based on an unconditional promise by the lender to repay the property loan. In return for this absolute debt repayment promise, the prrevious property owner relinquished many rights to the property, contingent on the continued repayment of the mortgage contract. Homeowners could remodel, refurbish and refurnish the property while making mortgage payments.
New York is a "lien theory" state where the property is the security for the loan. The "mortgage" is the contract document that places the lien on the property. As long as the homeowner continues to make payments, the lender cannot foreclose. If the homeowner fails to make payments, then the lender has the legal right to foreclose the property, which means that it will be resold to repay the original mortgage debt.
New York is primarily a judicial foreclosure state, where the creditor issues a "Filing Complaint" to begin the foreclosure process with the Supreme Court of the county in which the property is located. The "lis pendens" is a legal document giving public notice that the said property is being foreclosed upon. It can take nearly 445 days to process these legal foreclosure documents. A court must authorize the foreclosure by examining the facts, listening to testimony and issuing a final order specifying the property and all conditions and terms of the foreclosure sale. This court ruling might take from seven to nine months to occur. Once the court ruling is issued, a sale is set for four months thereafter.
In New York, a lender can initiate only "One Legal Action" to recover the amount due on a mortgage - either 1.) foreclosure, or 2.) suing to collect the debt. If upon resale of the property, the full original loan amount is not recouped, then the "deficiency judgment" is another remedy open to the creditor if there is an "express promise" to fully repay the full loan amount included in the mortgage document. Then, the creditor can file a "Motion for a Deficiency Judgment" within 90 days of the foreclosure sale to attempt to regain the outstanding mortgage value from the debtor.
The "right of redemption" (which is a last moment action by the debtor to repay the entire mortgage debt, including all interest payments) does not exist in New York.
Visit the following resources to learn more about New York real estate.
The Federal Reserve has begun lowering interest rates. Lock in today's low rates and save on your loan.
Are you paying too much for your mortgage?
Check your mortgage options with a trusted El Monte lender.
Answer a few questions below and connect with a lender who can help save you money today!