
The following table shows current 30-year El Monte mortgage rates. You can use the menus to select other loan durations, alter the loan amount. or change your location.
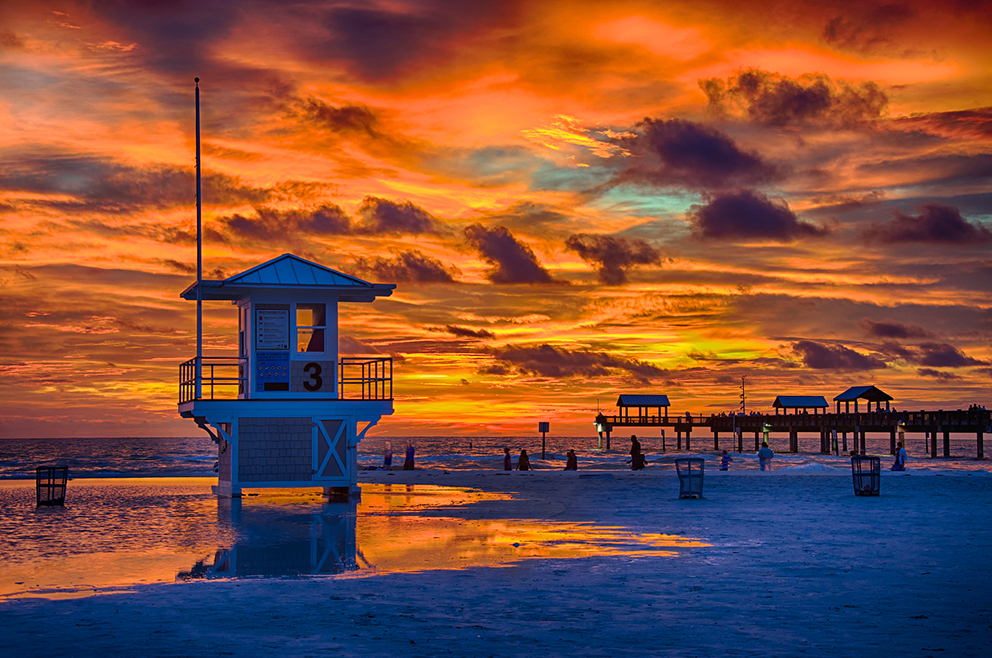
Florida is the 3rd most populous state in the US, and for good reason. With its warm year round temperatures and miles of beaches, there is no doubt as to why it is referred to as the “Sunshine State.” Florida has been a dream destination point for individuals and families for generations. Residents are drawn to the state for its weather, vibrant cities, and quiet coastal areas.
Are you thinking of buying a home (or a second home) in Florida? With its warm sunny climate, its two shores of beachfront property, its theme park attractions and its great cities, Florida has a lot to offer homebuyers.
Long a retirement destination for older Americans, especially those from the Northeast and Midwest, Florida also has become increasingly popular with foreign buyers for investment and recreational opportunities.
In mid-2017, the median value for a Florida home was $209,900, an increase of 8.8 percent over the past year. Real estate analysts predict these values will go up 2.4 percent within the coming year.
The median price per square foot was $157 in Florida, and the median monthly rental price was $1,725. The median price of a home was $279,900 as of mid-2017. As you might expect, real estate costs vary dramatically across the state, with the highest cost of living in the state in the Miami area.
Miami was one of the hottest housing markets in the nation leading up to the 2008 recession. To get a sense of how extreme the bubble was, the movie The Big Short featured a scene with a Florida stripper with 5 homes and a condo which were all financed using adjustable rates.
Florida’s housing market was hit hard by the recession, but is has rebounded nicely. Home prices have been slowing increasing across the state since late 2011.
Even in South Florida, where many home prices lost more than 50 percent of their value during the big housing bust, things have turned around. According to an article in The Washington Post, developers are more cautious, and several factors make real estate growth different this time around.
For example, condominium buyers, who helped fuel the housing boom earlier this century in Miami, are now putting down deposits of 50 percent of the purchase price rather than 10 to 20 percent that was common before the housing bust.
Also, while banks are now back to funding more building projects in South Florida, they often are requiring developers to have a substantial number of pre-construction sales.
Homeownership across the state stood at 64.4% in 1989. It rose rapidly during the tech boom and then rose again during the early years of the housing bubble, peaking at 72.4% in 2006. Florida's homeownership rate led the broader economy, turning south even before the Great Recession happened. In spite of the aggressive stimulus measures, homeownership rates stood at 64.3% in 2016.
Through the first 3 quarters of 2020 real estate held up far better than it did during the 2008 housing recession. Central banks and politicians reacted faster and much more aggressively to the COVID-19 crisis than they did to the 2008 recession. Many novel and unconventional policies which began in response to the prior recession were used much more aggressively in this recession. For instance, here are some of the policies which were enacted:
On November 24, 2020 the Federal Housing Finance Agency (FHFA) raised conforming loan limits by 7.42%, reflecting strong annual growth in the nationwide FHFA House Price Index (HPI). 2022 and 2023 saw limit increases of 18.05% and 12.21%, the fastest 2-year growth rates since 1986 & 1987, and inline with the 15.95% growth in 2006. In 2024 and 2025 the limits were increased at more historically normal levels of 5.56% and 5.21%.
Some bombed out hotels and motels which relied on Disney traffic decended into outright disasters, but most of the MSAs in the state of Florida saw property prices increase by more than 5% year over year through the third quarter of 2020. Taxpayers fleaing high-tax states have also boosted real estate prices in the panhandle region. The St. Joe company owns about 78,000 acres there and their stock through November had doubled off the COVID-19 March low and was up over 50% above the recent 2020 high before the COVID-19 crisis. High earning taxpayers in high-tax states like California, New York and New Jersey have had strong recent net migration into low-tax states like Florida, Nevada, Texas, and Tennessee.
Florida was relatively lax with statewide COVID-19 restrictions.
On June 24, 2021 a 12-story Surfside, Fl beachfront condominium building named Champlain Towers South collapsed, leading to 98 people dying and 11 more to be injured. This has caused the state to look hard at the structural integrity of older buildings, with additional Structural Integrity Reserve Study (SIRS) engineering assessments required for all buildings over 30 years old which are at least 3 stories tall. Some of the remedial work has been quite expensive, with some units having special assessments ranging from 4 to 6 figures.
Risks associated with these special assesments have created a bifrucated market, with newer condos selling well enough for developers to buy buildings to tear them down and launch new luxury residences, even as a glut of older condos hit the market at firesale prices. Miami-Dade County launched a loan program offering up to $50,000 to help condo owners fund the assessments.
The 2017 Tax Cuts and Jobs Acts (TCJA) bill limited a taxpayer's deduction of state and local taxes (SALT) to $10,000. This dramatically increased the cost of state taxes in states with high marginal income tax rates and relatively high property taxes. A home of modest means in a middle-class neighborhood on the outskirts of the Bay Area can cost $7,000 a year in property taxes. While campaigning Joe Biden stated he wanted to set the top marginal tax rate at 39.7% and re-impose FICA taxes on any income above $400,000. This would effectively make the marginal Federal income tax rate 55% for those in the top bracket. Add in the 13.3% top marginal rate in California and taxpayers could pay a 68.3% marginal rate on income above $1,000,000. That income tax rate would be before other taxes and fees like property taxes, vehicle licensing and registration, and sales taxes.
Some high-income earners like bond investor Jeffrey Gundalach have considered moving out of states like California due to escalating income taxes coupled with incompetent government leading to rolling brown outs. Low-tax or no income tax states like Florida, Texas, Tenneessee and Nevada have seen net migration from high-tax states like California, New York and New Jersey. Lockdowns destroyed many small businesses while lowering the appeal of cramped living places in big cities. Those combined with the realization that much work can be done remote has many businesses and successful business owners migrating. California legislators proposed a wealth and exit tax. Some high-end spec homes which were listed for $100 million or more sold at steep discounts to their original offering prices as capital has flooded into the stock market & conspicuous consumption is looking less appealing during a time when many people are hurting and politicians are proposing wealth and income taxes.

The COVID-19 Crisis Led to Record Income Inequality
American income inequality was at a 50-year high before the COVID-19 crisis took hold. Wealthier people with higher incomes have a higher likelihood of being able to continue to work from home, whereas many low-wage hospitality workers were hit hard by lockdowns. Some small business owners without access to credit saw their businesses fall apart due to the impacts of lockdowns and demonstrations.
Central bank intervention has led the domestic stock market to recover quickly from the COVID-19 crisis, but many middle class and lower class consumers hold little stock and are still struggling with unemployment. The country has reached record wealth and income inequality which exceeds both that of the gilded age and many third world countries.
| FL Rank | US Rank | Metropolitan Area | 2016 Pop | 2010 Pop | Change | % △ |
|---|---|---|---|---|---|---|
| 1 | 8 | Miami-Fort Lauderdale-West Palm Beach | 6,066,387 | 5,564,635 | 501,752 | 9.02% |
| 2 | 18 | Tampa-St. Petersburg-Clearwater | 3,032,171 | 2,783,243 | 248,928 | 8.94% |
| 3 | 23 | Orlando-Kissimmee-Sanford | 2,441,257 | 2,134,411 | 306,846 | 14.38% |
| 4 | 40 | Jacksonville | 1,478,212 | 1,345,596 | 132,616 | 9.86% |
| 5 | 73 | North Port-Sarasota-Bradenton | 788,457 | 702,281 | 86,176 | 12.27% |
| 6 | 78 | Cape Coral-Fort Myers | 722,336 | 618,754 | 103,582 | 16.74% |
| 7 | 82 | Lakeland-Winter Haven | 666,149 | 602,095 | 64,054 | 10.64% |
| 8 | 88 | Deltona-Daytona Beach-Ormond Beach | 637,674 | 590,289 | 47,385 | 8.03% |
| 9 | 95 | Palm Bay-Melbourne-Titusville | 579,130 | 543,376 | 35,754 | 6.58% |
| 10 | 109 | Pensacola-Ferry Pass-Brent | 485,684 | 448,991 | 36,693 | 8.17% |
| 11 | 111 | Port St. Lucie | 465,208 | 424,107 | 41,101 | 9.69% |
| 12 | 140 | Tallahassee | 379,627 | 367,413 | 12,214 | 3.32% |
| 13 | 145 | Naples-Immokalee-Marco Island | 365,136 | 321,520 | 43,616 | 13.57% |
| 14 | 149 | Ocala | 349,020 | 331,298 | 17,722 | 5.35% |
| 15 | 170 | Gainesville | 280,708 | 264,275 | 16,433 | 6.22% |
| 16 | 180 | Crestview-Fort Walton Beach-Destin | 267,059 | 235,865 | 31,194 | 13.23% |
| 17 | 221 | Panama City | 199,964 | 184,715 | 15,249 | 8.26% |
| 18 | 237 | Punta Gorda | 178,465 | 159,978 | 18,487 | 11.56% |
| 19 | 274 | Sebastian-Vero Beach | 151,563 | 138,028 | 13,535 | 9.81% |
| 20 | 293 | Homosassa Springs | 143,621 | 141,236 | 2,385 | 1.69% |
| 21 | 329 | The Villages | 123,996 | 93,420 | 30,576 | 32.73% |
| 22 | 380 | Sebring | 100,917 | 98,786 | 2,131 | 2.16% |
| 23 | 450 | Key West | 79,077 | 73,090 | 5,987 | 8.19% |
| 24 | 471 | Palatka | 72,277 | 74,364 | -2,087 | -2.81% |
| 25 | 483 | Lake City | 69,299 | 67,531 | 1,768 | 2.62% |
| 26 | 689 | Okeechobee | 40,314 | 39,996 | 318 | 0.80% |
| 27 | 701 | Clewiston | 39,290 | 39,140 | 150 | 0.38% |
| 28 | 755 | Arcadia | 35,800 | 34,862 | 938 | 2.69% |
| 29 | 841 | Wauchula | 27,360 | 27,731 | -371 | -1.34% |
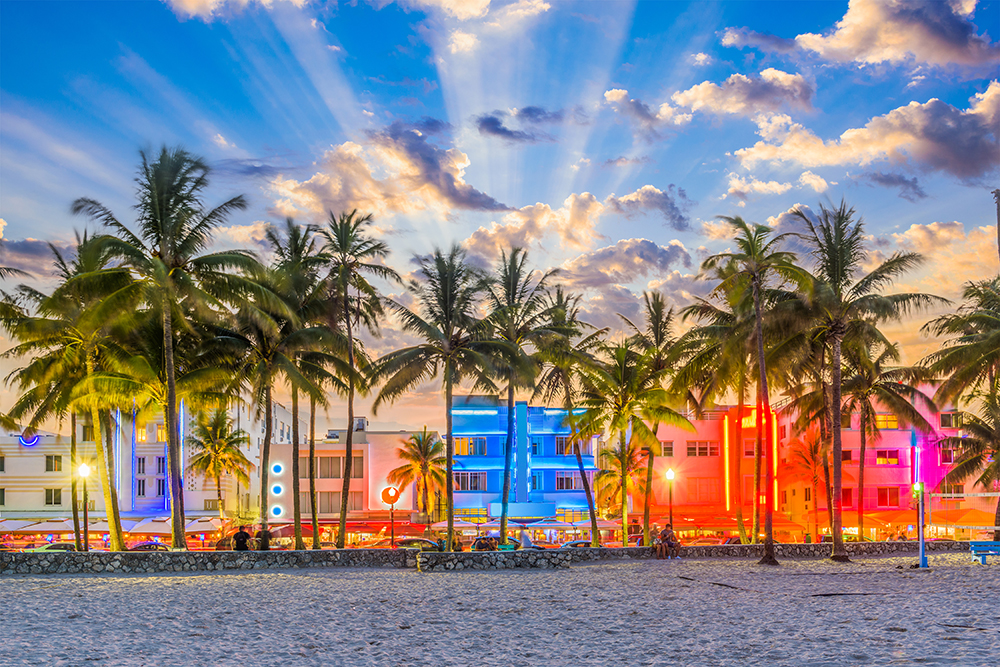
Southeast Florida, which includes the city of Miami, offers diverse cultural, recreational and business opportunities in a subtropical climate.
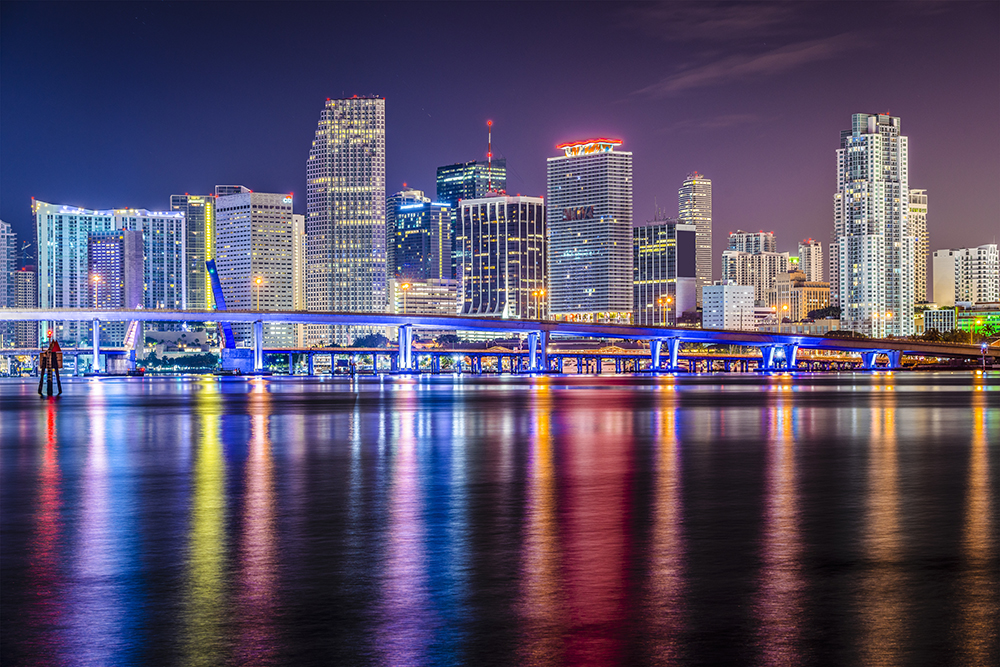
With a population of more than 5.5 million people, the Miami metro area, which includes Fort Lauderdale, is the eighth most populous region in the United States. Miami is a major international trade center and has an economy based upon tourism, media and entertainment and finance. The city is home to professional baseball, basketball, football and hockey teams as the Marlins, Heat, Dolphins and Panthers call the metro area home.
The median home value in Miami in mid-2017 was just over $300,000, an increase of 1.5 percent over the past year. The average list price of a home or condominium in Miami was $449,000.
The median list price per square foot in the city itself was $411, which is nearly double the Miami metropolitan area average of $211 per square foot. The median rental price in the city of Miami was $2,300, which is $300 higher than the Miami metro area median price.
Miami luxury condos have long been a popular destination for illicit hot money from South American drug cartels.
“We don’t come across [money laundering in real estate] once every 10 or 12 cases,” John Tobon, U.S. Homeland Security Investigations Deputy Special Agent in Charge for South Florida, told the Miami Herald in January. “We come across real estate being purchased with illicit funds once every other case.”
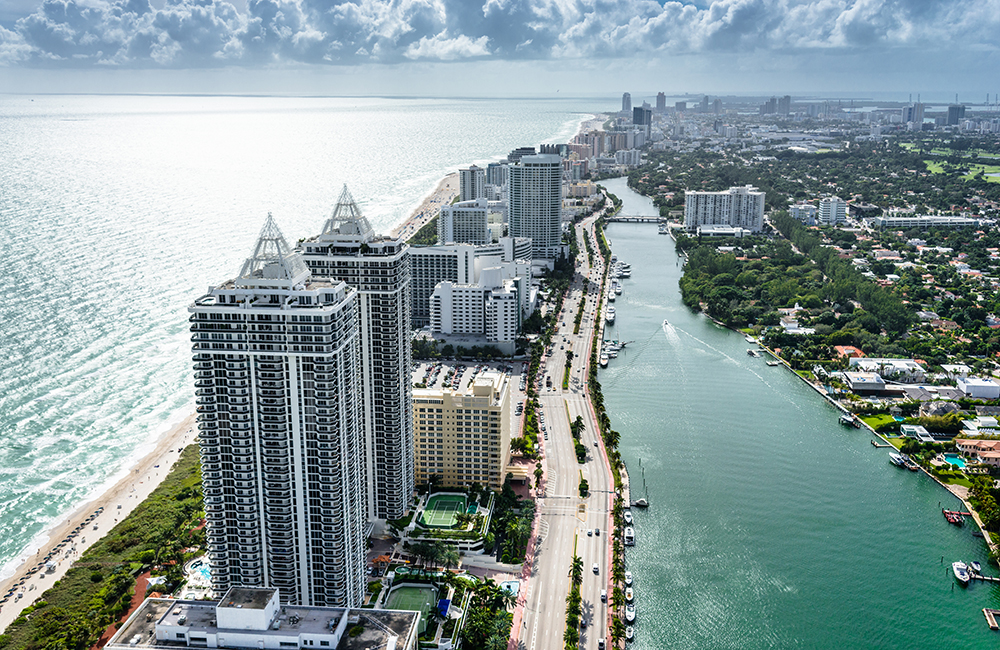
Fort Lauderdale is located about a half-hour north of Miami. In 2016 the city had an estimated population of 178,752 residents. The comfortable climate makes the city is a popular tourist destination. The local economy is heavily reliant on cruise ship visitors and yacht manufacturing.
The local median sales price is $306,000, which comes to $253 per square foot. The median local rent is $2,175.
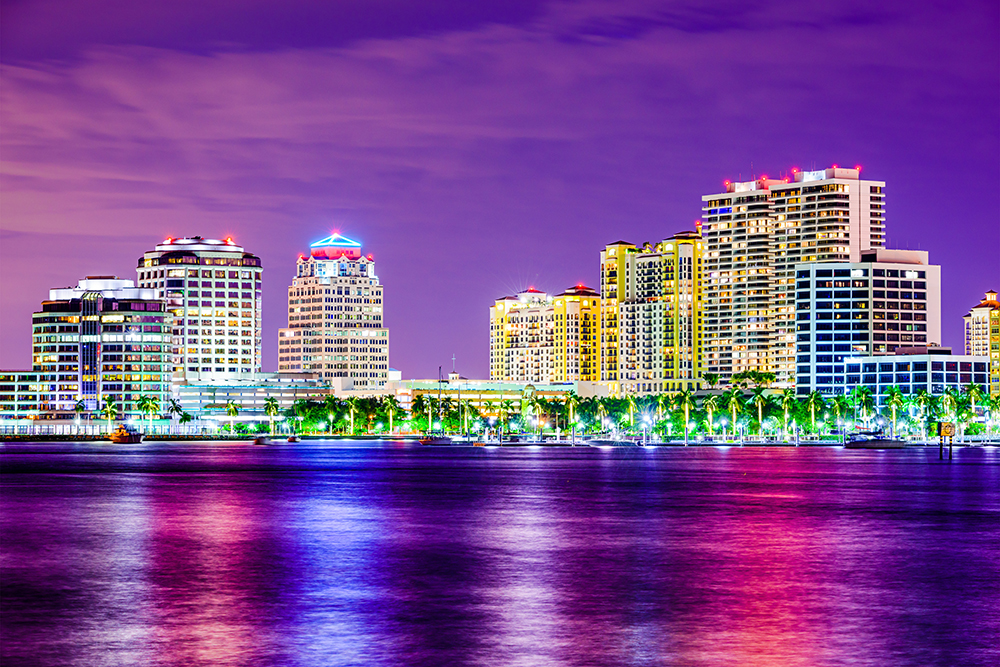
West Palm Beach is about 68 miles north of Miami. Due to the heavy urbanization along the southeast Florida coast the city is considered part of the Miami metropolitan area. As of 2016 the city has an estimated population of 108,161. The city was incorporated in 1894, two years before Miami was. The city has many historic neighborhoods with a median overall home value of $225,300. Median local rents are about $1,750 per month, which is $250 cheaper than the Miami metro area.
If someone were to ask you what is the biggest city in Florida, most people likely would say Miami or maybe Orlando. They would be wrong. Miami would win hands-down if they were considering its entire metro area, but if going by the actual city population, the winner is Jacksonville.
The reason is that the city of Jacksonville is much larger geographically than the city of Miami. Jacksonville’s city borders contain 750 square miles, while Miami is roughly 36 square miles in area.
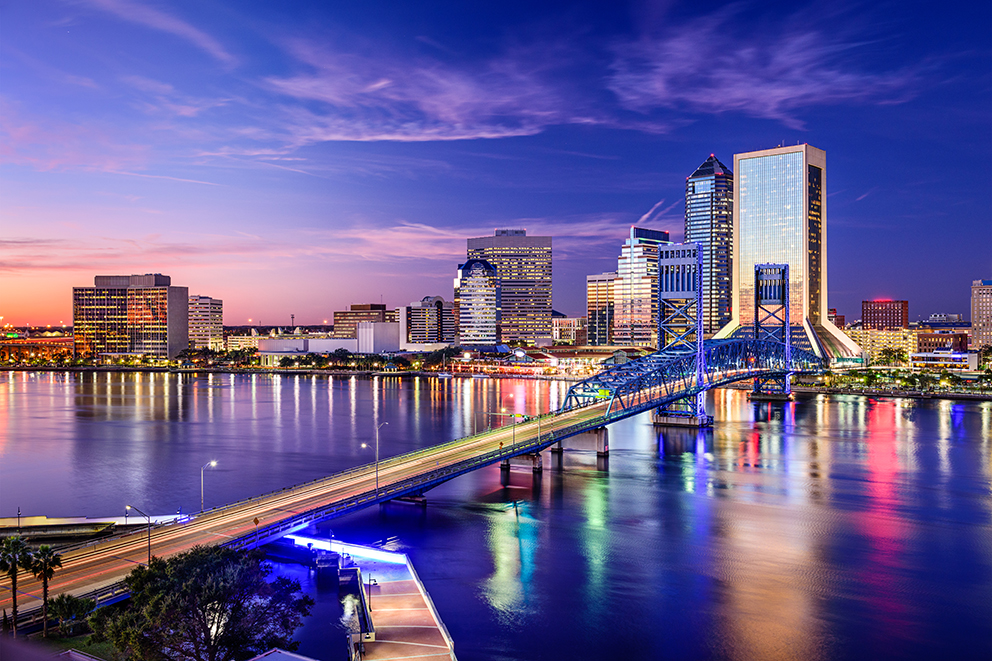
Located in the northeast corner of the state on the shore of the St. Johns River and about 25 miles south of the state border with Georgia, Jacksonville is a financial and commercial center for North Florida, a busy seaport and a U.S. military base. The Jaguars NFL team call the city home,
In 2017, the median home value in Jacksonville was $153,600, an increase of 10.8 percent over the previous year. Home values should continue to increase by about 3.6 percent over the next year. In mid-2017, the median listing price of homes in Jacksonville was $191,000.
The average list price per square foot in the city itself is $111, a price that is less than the Jacksonville metro area average of $127 per square foot. The average rental price in Jacksonville is $1,200, which also is lower than the metro average of $1,325.
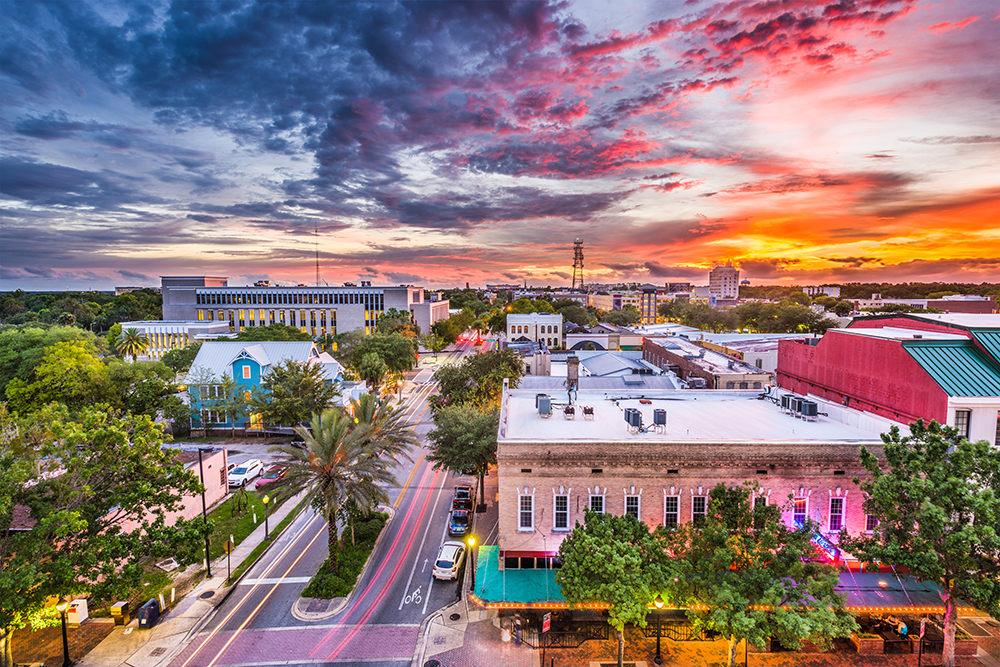
Gainesville has an estimated population of 131,591 and is the home of the University of Florida. The city has a median sales price of $172,000 which comes to $111 per square foot. Local median rent costs $1,300 per month.
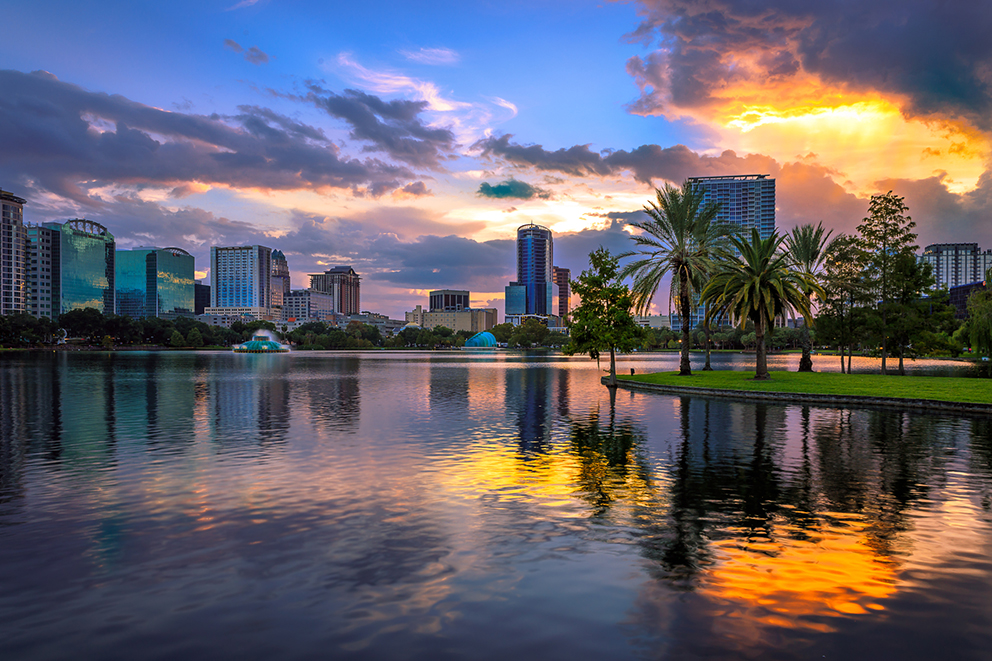
Known as the Theme Park Capital of the World, Orlando is the center of a busy metropolitan area with a population of nearly 2,500,000 people, making it the third largest metro are in Florida.
Through the popularity of Disney World, Universal Studios and other local theme parks, the Orlando area is a world tourist destination and is one of the nation’s busiest convention and conference centers. The Orlando area offers many locations for fine dining, golf and family entertainment. Orlanda is also the home of the Magic NBA team.
The median value for an Orlando home was $169,700 in 2017, an increase of 11.9 percent over the previous year with experts predicting an increase of 4.4 percent over the following year. The average list price is $137 per square foot in Orlando, and the average rental price is $1,500. The 2017 median listing price of homes in Orlando was $265,000.
Tampa is another popular city in central Florda, located on the Western coast. The city began slowly as a cattle and citrus shipping port near the United States Army outpost named Fort Brooke. The broader metro Tampa Bay Area has a population of roughly 2.9 million people & includes the cities of St. Petersburg and Clearwater. The area's economy boasts a strong footprint in financial services, healthcare, tourism, real estate, shipping and professional sports.
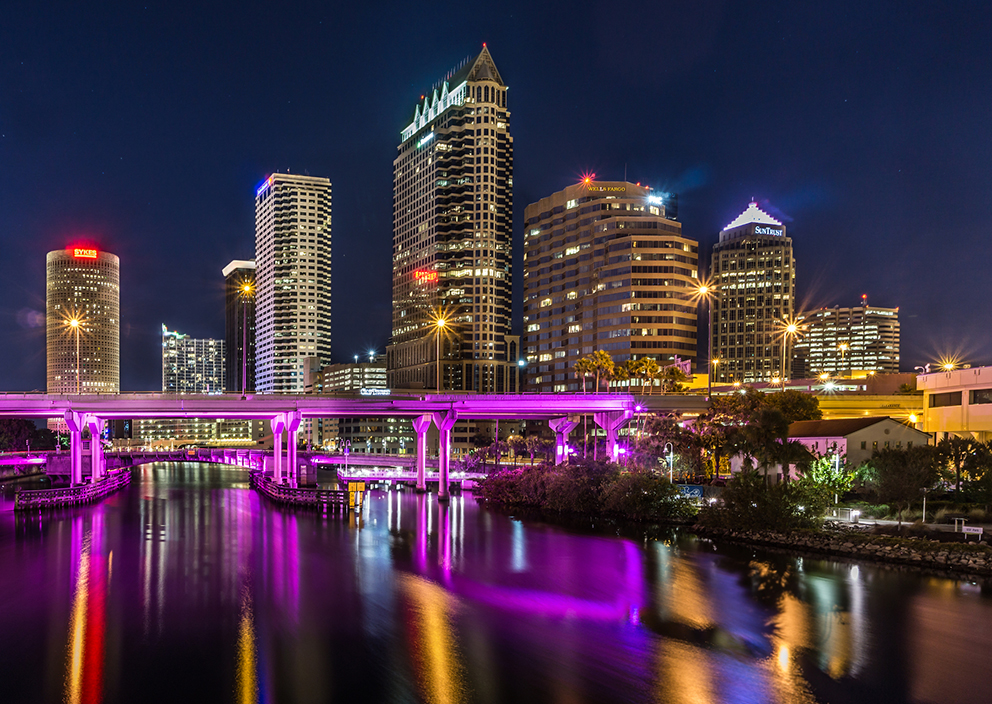
The median home value in Tampa is $185,700 in 2017, a 12.9 percent over the previous year with experts predicting an increase of 3.7 percent over the following year. The median list price is $167 per square foot in Tampa, and the average rental price is $1,500. The 2017 median listing price of homes located in Tampa was $279,995.
Tampa is home to professional baseball, football and hockey teams. The Devil Rays, Buccaneers & Lightning call the city home.
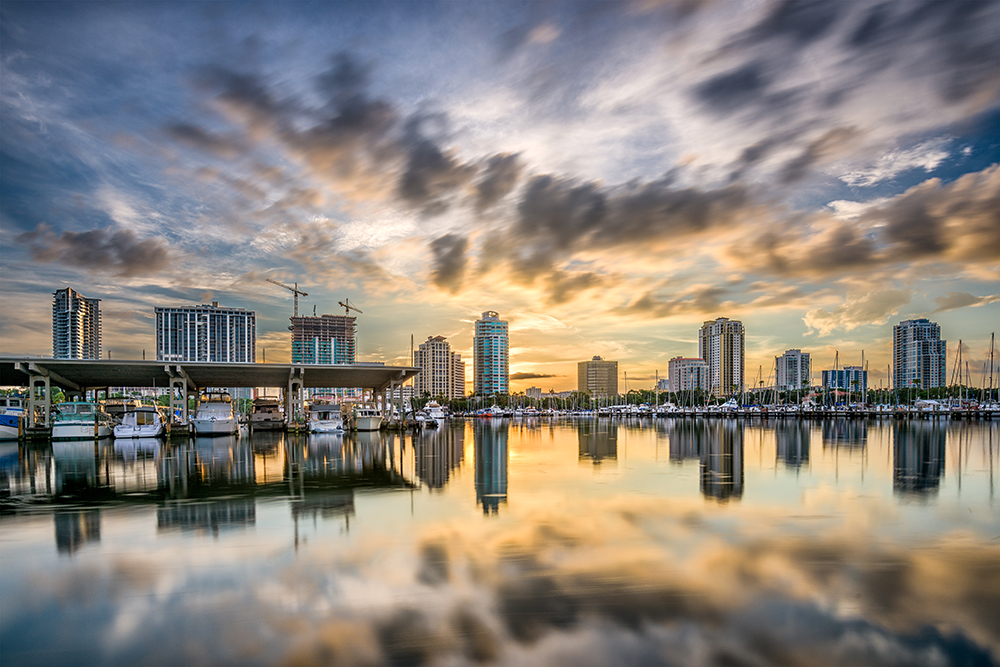
St. Petersburg is the fifth most populous city in the state with 260,999 residents in 2016. It and Clearwater are part of the Tampa Bay Area. Home prices are fairly even across the metro area.
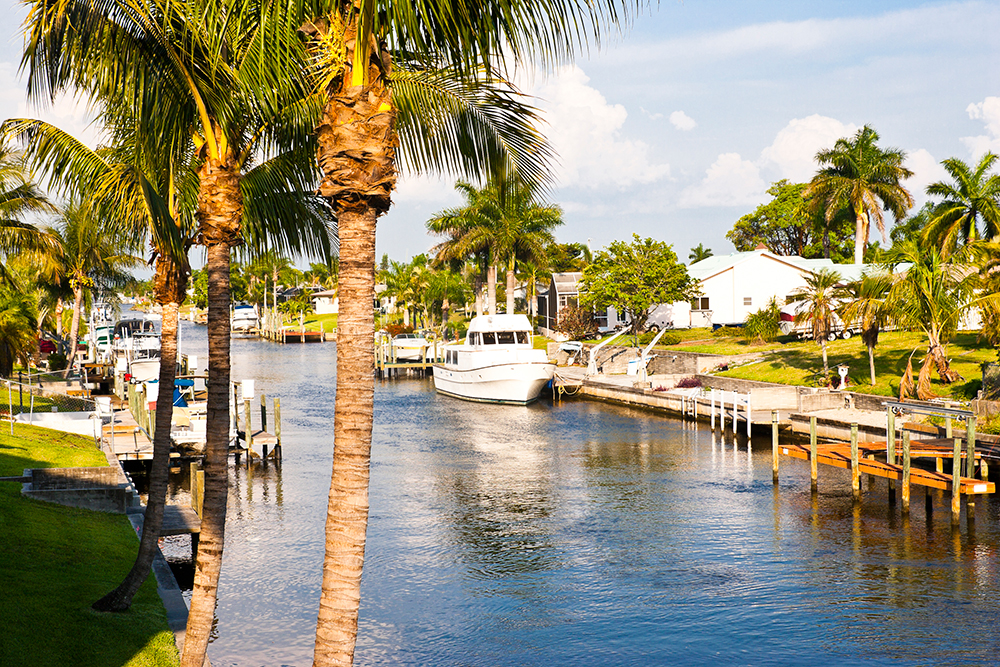
The city of Gainesville began as a planned community in 1957 and had a total population of 179,804 in 2016. Median homes are valued at $217,400 with a median price per square foot of $145.
The northwestern part of Florida, frequently called the Panhandle, offers beaches, fishing, a slight taste of all four seasons and a slower-paced lifestyle than the larger urban areas of the state.
The state capital of Tallahassee, with a 2016 population of 190,894, is the largest city in the region, but Pensacola, a seaport on Pensacola Bay, is the center of a growing metropolitan region.
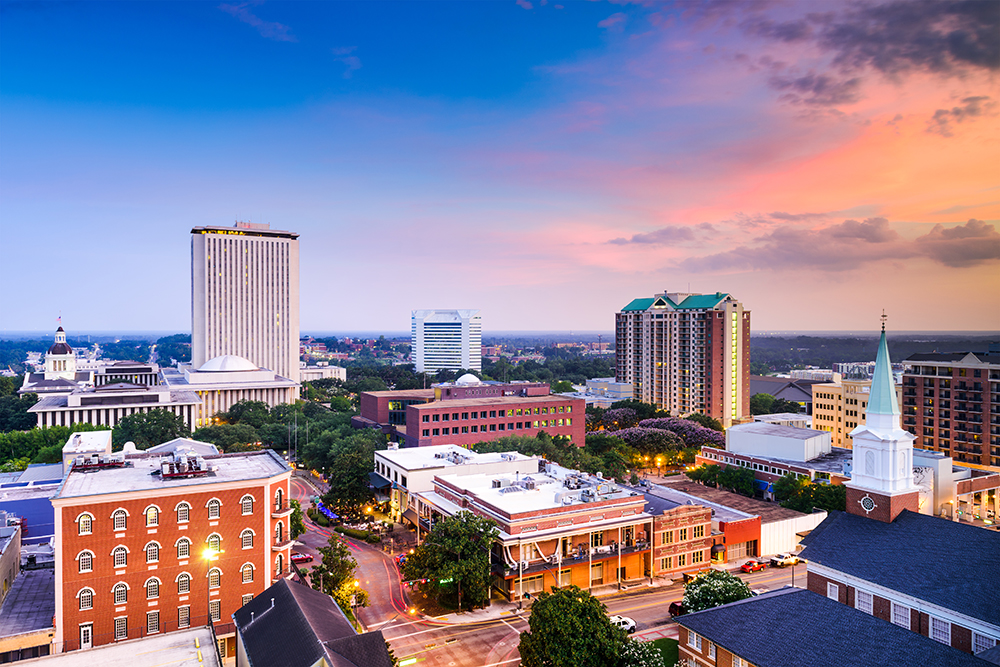
In Tallahassee, the median home value was $167,600 in mid-2017, an increase of 3.7 percent over the past year, and the median listing price was $195,000.
The average price per square foot for a listing in Tallahassee was $123, higher than the Tallahassee metro area average of $121. The median rental price in Tallahassee was $975, which is about the same as the Tallahassee metro rental price.
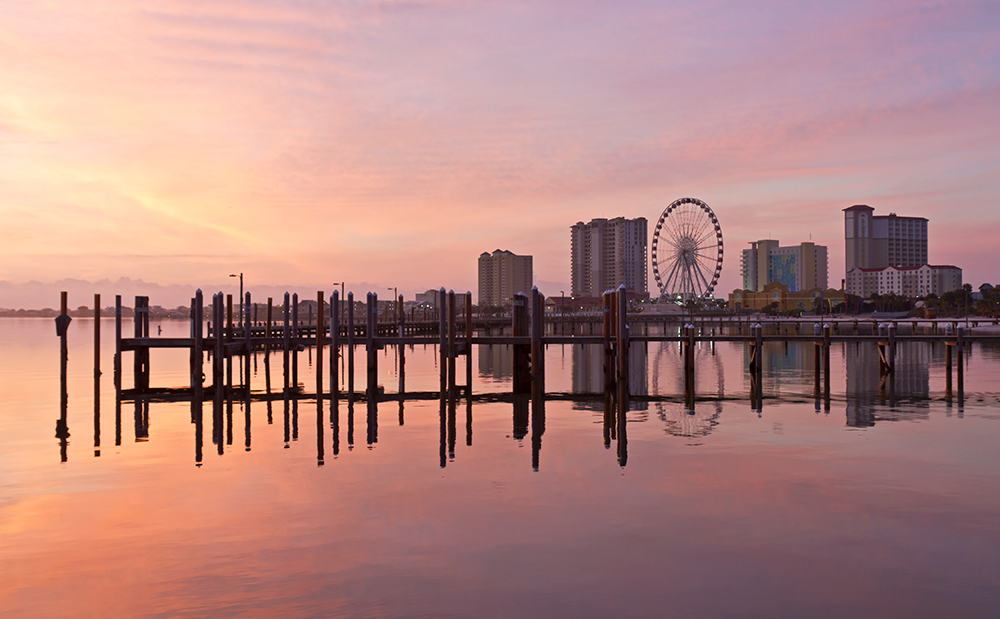
In Pensacola, the median home value was $134,700 in mid-2017, a rise of nearly 10 percent from 2016, and experts predict values will increase about 5 percent over the next year. The median listing price of a home in Pensacola was $182,250 in mid-2017.
The average list price per square foot for a home in Pensacola is $103, lower than the Pensacola metro area median price of $111, and the average rental price in Pensacola is $995, also lower than the metro average price of $1,150.
According to the United States census an estimated 20,612,439 people live in the state of Florida. The state has 65,755 mi² of land area, which gave it a population density of 313.47 per mi². Here is a list of cities with more than 10,000 residents, with their estimated population as of June 2016 & the 2010 United States Census. For Census Designated Places (CDP) where there was no population estimate available for 2016, the 2011-2015 American Community Survey 5-Year Estimates data was used.
All table columns are sortable. Click on the column headers to sort by that column. Click again to sort low to high. Cities with higher levels of population growth typically see the increased demand drive faster real estate price appreciation.
| Rank | Geography | County | 2016 Pop | 2010 Pop | Change | % △ | Land mi² | Pop Den mi² |
|---|---|---|---|---|---|---|---|---|
| 1 | Jacksonville | Duval | 880,619 | 821,784 | 58,835 | 7.16% | 747 | 1,178.87 |
| 2 | Miami | Miami-Dade | 453,579 | 399,457 | 54,122 | 13.55% | 35.87 | 12,645.08 |
| 3 | Tampa | Hillsborough | 377,165 | 335,709 | 41,456 | 12.35% | 113.41 | 3,325.68 |
| 4 | Orlando | Orange | 277,173 | 238,300 | 38,873 | 16.31% | 102.4 | 2,706.77 |
| 5 | St. Petersburg | Pinellas | 260,999 | 244,769 | 16,230 | 6.63% | 61.74 | 4,227.39 |
| 6 | Hialeah | Miami-Dade | 236,387 | 224,669 | 11,718 | 5.22% | 21.45 | 11,020.37 |
| 7 | Tallahassee | Leon | 190,894 | 181,376 | 9,518 | 5.25% | 100.25 | 1,904.18 |
| 8 | Port St. Lucie | St. Lucie | 185,132 | 164,603 | 20,529 | 12.47% | 113.95 | 1,624.68 |
| 9 | Cape Coral | Lee | 179,804 | 154,305 | 25,499 | 16.53% | 105.67 | 1,701.56 |
| 10 | Fort Lauderdale | Broward | 178,752 | 165,521 | 13,231 | 7.99% | 34.77 | 5,140.98 |
| 11 | Pembroke Pines | Broward | 168,587 | 154,750 | 13,837 | 8.94% | 33.12 | 5,090.19 |
| 12 | Hollywood | Broward | 151,998 | 140,768 | 11,230 | 7.98% | 27.37 | 5,553.45 |
| 13 | Miramar | Broward | 138,449 | 122,041 | 16,408 | 13.44% | 29.52 | 4,690.01 |
| 14 | Gainesville | Alachua | 131,591 | 124,354 | 7,237 | 5.82% | 61.3 | 2,146.67 |
| 15 | Coral Springs | Broward | 130,059 | 121,096 | 8,963 | 7.40% | 23.79 | 5,466.96 |
| 16 | Clearwater | Pinellas | 114,361 | 107,685 | 6,676 | 6.20% | 25.56 | 4,474.22 |
| 17 | Miami Gardens | Miami-Dade | 113,058 | 107,167 | 5,891 | 5.50% | 18.23 | 6,201.76 |
| Lehigh Acres CDP | Lee | 110,244 | 86,784 | 23,460 | 27.03% | 92.56 | 1,191.05 | |
| 18 | Palm Bay | Brevard | 110,104 | 103,190 | 6,914 | 6.70% | 65.7 | 1,675.86 |
| 19 | Pompano Beach | Broward | 109,393 | 99,845 | 9,548 | 9.56% | 24 | 4,558.04 |
| Brandon CDP | Hillsborough | 108,287 | 103,483 | 4,804 | 4.64% | 33.1 | 3,271.51 | |
| 20 | West Palm Beach | Palm Beach | 108,161 | 99,919 | 8,242 | 8.25% | 55.29 | 1,956.25 |
| 21 | Lakeland | Polk | 106,420 | 97,422 | 8,998 | 9.24% | 65.27 | 1,630.46 |
| 22 | Davie | Broward | 101,871 | 91,992 | 9,879 | 10.74% | 34.89 | 2,919.78 |
| Spring Hill CDP | Hernando | 101,709 | 98,621 | 3,088 | 3.13% | 59.81 | 1,700.54 | |
| 23 | Boca Raton | Palm Beach | 96,114 | 84,392 | 11,722 | 13.89% | 29.33 | 3,276.99 |
| 24 | Sunrise | Broward | 93,734 | 84,439 | 9,295 | 11.01% | 18.1 | 5,178.67 |
| 25 | Plantation | Broward | 92,706 | 84,955 | 7,751 | 9.12% | 21.74 | 4,264.31 |
| 26 | Miami Beach | Miami-Dade | 91,917 | 87,779 | 4,138 | 4.71% | 7.63 | 12,046.79 |
| 27 | Deltona | Volusia | 90,124 | 85,182 | 4,942 | 5.80% | 37.53 | 2,401.39 |
| Alafaya CDP | Orange | 85,167 | 78,113 | 7,054 | 9.03% | 37.96 | 2,243.60 | |
| 28 | Palm Coast | Flagler | 85,109 | 75,180 | 9,929 | 13.21% | 89.87 | 947.02 |
| 29 | Largo | Pinellas | 83,065 | 77,648 | 5,417 | 6.98% | 17.62 | 4,714.25 |
| Town 'n' Country CDP | Hillsborough | 82,219 | 78,442 | 3,777 | 4.82% | 22.11 | 3,718.63 | |
| 30 | Melbourne | Brevard | 81,185 | 76,068 | 5,117 | 6.73% | 33.86 | 2,397.67 |
| Riverview CDP | Hillsborough | 79,886 | 71,050 | 8,836 | 12.44% | 46.19 | 1,729.51 | |
| 31 | Deerfield Beach | Broward | 79,764 | 75,018 | 4,746 | 6.33% | 15.09 | 5,285.88 |
| 32 | Fort Myers | Lee | 77,146 | 62,298 | 14,848 | 23.83% | 39.96 | 1,930.58 |
| Kendall CDP | Miami-Dade | 76,267 | 75,371 | 896 | 1.19% | 16.08 | 4,742.97 | |
| 33 | Boynton Beach | Palm Beach | 75,569 | 68,217 | 7,352 | 10.78% | 16.17 | 4,673.41 |
| 34 | Lauderhill | Broward | 71,626 | 66,887 | 4,739 | 7.09% | 8.53 | 8,396.95 |
| 35 | Weston | Broward | 70,015 | 65,333 | 4,682 | 7.17% | 25.16 | 2,782.79 |
| 36 | Kissimmee | Osceola | 69,369 | 59,682 | 9,687 | 16.23% | 21.19 | 3,273.67 |
| 37 | Homestead | Miami-Dade | 67,996 | 60,512 | 7,484 | 12.37% | 15.14 | 4,491.15 |
| 38 | Delray Beach | Palm Beach | 67,371 | 60,522 | 6,849 | 11.32% | 15.81 | 4,261.29 |
| Pine Hills CDP | Orange | 66,906 | 60,076 | 6,830 | 11.37% | 12.25 | 5,461.71 | |
| 39 | Daytona Beach | Volusia | 66,645 | 61,005 | 5,640 | 9.25% | 58.41 | 1,140.99 |
| The Villages CDP | Sumter & Marion | 66,083 | 51,442 | 14,641 | 28.46% | 30.81 | 2,144.86 | |
| 40 | Tamarac | Broward | 65,199 | 60,427 | 4,772 | 7.90% | 11.62 | 5,610.93 |
| 41 | North Port | Sarasota | 64,274 | 57,357 | 6,917 | 12.06% | 99.58 | 645.45 |
| 42 | Wellington village | Palm Beach | 63,900 | 56,508 | 7,392 | 13.08% | 45.14 | 1,415.60 |
| 43 | Jupiter | Palm Beach | 63,813 | 55,156 | 8,657 | 15.70% | 21.47 | 2,972.19 |
| 44 | North Miami | Miami-Dade | 62,139 | 58,786 | 3,353 | 5.70% | 8.41 | 7,388.70 |
| 45 | Port Orange | Volusia | 61,105 | 56,048 | 5,057 | 9.02% | 26.66 | 2,292.01 |
| Poinciana CDP | Osceola & Polk | 59,927 | 53,193 | 6,734 | 12.66% | 71.88 | 833.71 | |
| Palm Harbor CDP | Pinellas | 59,769 | 57,439 | 2,330 | 4.06% | 17.38 | 3,438.95 | |
| 46 | Coconut Creek | Broward | 59,405 | 52,909 | 6,496 | 12.28% | 11.85 | 5,013.08 |
| Kendale Lakes CDP | Miami-Dade | 59,354 | 56,148 | 3,206 | 5.71% | 8.1 | 7,327.65 | |
| 47 | Ocala | Marion | 59,253 | 56,315 | 2,938 | 5.22% | 44.83 | 1,321.73 |
| 48 | Sanford | Seminole | 58,605 | 53,570 | 5,035 | 9.40% | 22.96 | 2,552.48 |
| 49 | Doral | Miami-Dade | 57,947 | 45,704 | 12,243 | 26.79% | 13.88 | 4,174.86 |
| 50 | Margate | Broward | 57,870 | 53,284 | 4,586 | 8.61% | 8.85 | 6,538.98 |
| Tamiami CDP | Miami-Dade | 57,195 | 55,271 | 1,924 | 3.48% | 7.07 | 8,089.82 | |
| 51 | Sarasota | Sarasota | 56,610 | 51,917 | 4,693 | 9.04% | 14.66 | 3,861.53 |
| Port Charlotte CDP | Charlotte | 56,434 | 54,392 | 2,042 | 3.75% | 28.43 | 1,985.02 | |
| The Hammocks CDP | Miami-Dade | 55,713 | 51,003 | 4,710 | 9.23% | 7.88 | 7,070.18 | |
| 52 | Bradenton | Manatee | 55,687 | 49,546 | 6,141 | 12.39% | 14.18 | 3,927.15 |
| Fountainebleau CDP | Miami-Dade | 55,596 | 59,764 | -4,168 | -6.97% | 4.26 | 13,050.70 | |
| 53 | Bonita Springs | Lee | 54,198 | 43,914 | 10,284 | 23.42% | 38.6 | 1,404.09 |
| 54 | Pensacola | Escambia | 53,779 | 51,923 | 1,856 | 3.57% | 22.54 | 2,385.94 |
| 55 | Palm Beach Gardens | Palm Beach | 53,778 | 48,452 | 5,326 | 10.99% | 55.09 | 976.18 |
| 56 | Pinellas Park | Pinellas | 52,137 | 49,079 | 3,058 | 6.23% | 15.51 | 3,361.51 |
| 57 | Coral Gables | Miami-Dade | 50,815 | 46,780 | 4,035 | 8.63% | 12.92 | 3,933.05 |
| Wesley Chapel CDP | Pasco | 49,735 | 44,092 | 5,643 | 12.80% | 43.9 | 1,132.92 | |
| 58 | Apopka | Orange | 49,458 | 41,542 | 7,916 | 19.06% | 31.24 | 1,583.16 |
| Country Club CDP | Miami-Dade | 48,622 | 47,105 | 1,517 | 3.22% | 4.14 | 11,744.44 | |
| 59 | St. Cloud | Osceola | 47,809 | 35,183 | 12,626 | 35.89% | 17.76 | 2,691.95 |
| 60 | Titusville | Brevard | 46,019 | 43,761 | 2,258 | 5.16% | 29.37 | 1,566.87 |
| 61 | Fort Pierce | St. Lucie | 45,295 | 41,590 | 3,705 | 8.91% | 20.57 | 2,201.99 |
| 62 | Ocoee | Orange | 44,820 | 35,579 | 9,241 | 25.97% | 14.71 | 3,046.91 |
| 63 | Cutler Bay | Miami-Dade | 44,707 | 40,286 | 4,421 | 10.97% | 9.83 | 4,548.02 |
| 64 | Oakland Park | Broward | 44,326 | 41,363 | 2,963 | 7.16% | 7.46 | 5,941.82 |
| 65 | North Miami Beach | Miami-Dade | 43,891 | 41,523 | 2,368 | 5.70% | 4.83 | 9,087.16 |
| 66 | North Lauderdale | Broward | 43,699 | 41,023 | 2,676 | 6.52% | 4.59 | 9,520.48 |
| 67 | Altamonte Springs | Seminole | 43,492 | 41,496 | 1,996 | 4.81% | 9.01 | 4,827.08 |
| 68 | Ormond Beach | Volusia | 42,162 | 38,137 | 4,025 | 10.55% | 31.93 | 1,320.45 |
| 69 | Winter Garden | Orange | 41,988 | 34,568 | 7,420 | 21.46% | 15.41 | 2,724.72 |
| University CDP | Hillsborough | 41,858 | 41,163 | 695 | 1.69% | 6.42 | 6,519.94 | |
| North Fort Myers CDP | Lee | 40,560 | 39,407 | 1,153 | 2.93% | 49.48 | 819.73 | |
| 70 | Greenacres | Palm Beach | 40,013 | 37,573 | 2,440 | 6.49% | 5.79 | 6,910.71 |
| 71 | Hallandale Beach | Broward | 39,500 | 37,113 | 2,387 | 6.43% | 4.22 | 9,360.19 |
| Kendall West CDP | Miami-Dade | 39,347 | 36,154 | 3,193 | 8.83% | 2.75 | 14,308.00 | |
| 72 | Oviedo | Seminole | 39,337 | 33,342 | 5,995 | 17.98% | 15.21 | 2,586.26 |
| 73 | Winter Haven | Polk | 38,953 | 33,874 | 5,079 | 14.99% | 31.3 | 1,244.50 |
| South Miami Heights CDP | Miami-Dade | 38,255 | 35,696 | 2,559 | 7.17% | 4.89 | 7,823.11 | |
| 74 | Plant City | Hillsborough | 38,200 | 34,721 | 3,479 | 10.02% | 27.18 | 1,405.45 |
| 75 | Royal Palm Beach village | Palm Beach | 38,006 | 34,140 | 3,866 | 11.32% | 11.14 | 3,411.67 |
| The Acreage CDP | Palm Beach | 37,853 | 38,704 | -851 | -2.20% | 40.84 | 926.86 | |
| 76 | Lake Worth | Palm Beach | 37,812 | 34,910 | 2,902 | 8.31% | 5.87 | 6,441.57 |
| 77 | Aventura | Miami-Dade | 37,724 | 35,762 | 1,962 | 5.49% | 2.65 | 14,235.47 |
| 78 | Panama City | Bay | 37,635 | 36,484 | 1,151 | 3.15% | 29.28 | 1,285.35 |
| Egypt Lake-Leto CDP | Hillsborough | 37,408 | 35,282 | 2,126 | 6.03% | 5.91 | 6,329.61 | |
| Valrico CDP | Hillsborough | 36,975 | 35,545 | 1,430 | 4.02% | 13.81 | 2,677.41 | |
| 79 | Dunedin | Pinellas | 36,381 | 35,321 | 1,060 | 3.00% | 10.36 | 3,511.68 |
| Merritt Island CDP | Brevard | 35,900 | 34,743 | 1,157 | 3.33% | 17.51 | 2,050.26 | |
| Richmond West CDP | Miami-Dade | 35,693 | 31,973 | 3,720 | 11.63% | 4.17 | 8,559.47 | |
| 80 | Winter Springs | Seminole | 35,599 | 33,282 | 2,317 | 6.96% | 14.67 | 2,426.65 |
| 81 | Cooper City | Broward | 35,405 | 28,547 | 6,858 | 24.02% | 8.04 | 4,403.61 |
| Carrollwood CDP | Hillsborough | 35,027 | 33,365 | 1,662 | 4.98% | 9.21 | 3,803.15 | |
| 82 | Lauderdale Lakes | Broward | 34,790 | 32,593 | 2,197 | 6.74% | 3.68 | 9,453.80 |
| 83 | Riviera Beach | Palm Beach | 34,244 | 32,488 | 1,756 | 5.41% | 8.53 | 4,014.54 |
| Land O' Lakes CDP | Pasco | 33,812 | 31,996 | 1,816 | 5.68% | 19.04 | 1,775.84 | |
| Golden Glades CDP | Miami-Dade | 33,806 | 33,145 | 661 | 1.99% | 4.88 | 6,927.46 | |
| 84 | Clermont | Lake | 33,549 | 28,742 | 4,807 | 16.72% | 13.63 | 2,461.41 |
| Navarre CDP | Santa Rosa | 32,949 | 31,378 | 1,571 | 5.01% | 23 | 1,432.57 | |
| University CDP | Orange | 32,937 | 31,084 | 1,853 | 5.96% | 9.08 | 3,627.42 | |
| Four Corners CDP | Lake, Polk, Osceola & Orange | 32,727 | 26,116 | 6,611 | 25.31% | 46.36 | 705.93 | |
| 85 | Estero | Lee | 32,140 | 2,325 | 29,815 | 1282.37% | 24.45 | 1,314.52 |
| Ferry Pass CDP | Escambia | 32,077 | 28,921 | 3,156 | 10.91% | 13.94 | 2,301.08 | |
| East Lake CDP | Pinellas | 32,054 | 30,962 | 1,092 | 3.53% | 28.91 | 1,108.75 | |
| 86 | DeLand | Volusia | 31,569 | 27,031 | 4,538 | 16.79% | 17.6 | 1,793.69 |
| 87 | Parkland | Broward | 31,507 | 23,962 | 7,545 | 31.49% | 12.33 | 2,555.31 |
| 88 | Dania Beach | Broward | 31,422 | 29,639 | 1,783 | 6.02% | 8.09 | 3,884.05 |
| Buenaventura Lakes CDP | Osceola | 31,348 | 26,079 | 5,269 | 20.20% | 5.58 | 5,617.92 | |
| Lakeside CDP | Clay | 31,223 | 30,943 | 280 | 0.90% | 13.52 | 2,309.39 | |
| Fruit Cove CDP | St. Johns | 31,146 | 29,362 | 1,784 | 6.08% | 16.06 | 1,939.35 | |
| 89 | Miami Lakes | Miami-Dade | 30,873 | 29,361 | 1,512 | 5.15% | 5.63 | 5,483.66 |
| West Little River CDP | Miami-Dade | 30,749 | 34,699 | -3,950 | -11.38% | 4.56 | 6,743.20 | |
| Westchester CDP | Miami-Dade | 30,585 | 29,862 | 723 | 2.42% | 3.94 | 7,762.69 | |
| Fleming Island CDP | Clay | 30,350 | 27,126 | 3,224 | 11.89% | 15.83 | 1,917.25 | |
| 90 | Winter Park | Orange | 30,208 | 27,852 | 2,356 | 8.46% | 8.68 | 3,480.18 |
| Golden Gate CDP | Collier | 29,258 | 23,961 | 5,297 | 22.11% | 3.9 | 7,502.05 | |
| Meadow Woods CDP | Orange | 28,943 | 25,558 | 3,385 | 13.24% | 11.39 | 2,541.09 | |
| Lake Magdalene CDP | Hillsborough | 28,560 | 28,509 | 51 | 0.18% | 10.23 | 2,791.79 | |
| 91 | Rockledge | Brevard | 27,068 | 24,926 | 2,142 | 8.59% | 11.94 | 2,267.00 |
| 92 | Casselberry | Seminole | 27,053 | 26,241 | 812 | 3.09% | 6.99 | 3,870.24 |
| Princeton CDP | Miami-Dade | 26,992 | 22,038 | 4,954 | 22.48% | 7.38 | 3,657.45 | |
| 93 | Key West | Monroe | 26,990 | 24,649 | 2,341 | 9.50% | 5.59 | 4,828.26 |
| 94 | Temple Terrace | Hillsborough | 26,515 | 24,541 | 1,974 | 8.04% | 6.85 | 3,870.80 |
| Leisure City CDP | Miami-Dade | 25,952 | 22,655 | 3,297 | 14.55% | 3.33 | 7,793.39 | |
| University Park CDP | Miami-Dade | 25,870 | 26,995 | -1,125 | -4.17% | 3.97 | 6,516.37 | |
| 95 | New Smyrna Beach | Volusia | 25,796 | 22,464 | 3,332 | 14.83% | 34.64 | 744.69 |
| Citrus Park CDP | Hillsborough | 25,570 | 24,252 | 1,318 | 5.43% | 10.16 | 2,516.73 | |
| Bayonet Point CDP | Pasco | 25,453 | 23,467 | 1,986 | 8.46% | 5.74 | 4,434.32 | |
| East Lake-Orient Park CDP | Hillsborough | 25,373 | 22,753 | 2,620 | 11.51% | 16.32 | 1,554.72 | |
| Immokalee CDP | Collier | 24,879 | 24,154 | 725 | 3.00% | 22.7 | 1,095.99 | |
| 96 | Tarpon Springs | Pinellas | 24,867 | 23,484 | 1,383 | 5.89% | 9.11 | 2,729.64 |
| Wright CDP | Okaloosa | 24,862 | 23,127 | 1,735 | 7.50% | 5.52 | 4,503.99 | |
| 97 | Sebastian | Indian River | 24,772 | 21,929 | 2,843 | 12.96% | 13.66 | 1,813.47 |
| 98 | Palmetto Bay village | Miami-Dade | 24,570 | 23,410 | 1,160 | 4.96% | 8.29 | 2,963.81 |
| 99 | Palm Springs village | Palm Beach | 24,051 | 18,928 | 5,123 | 27.07% | 4.2 | 5,726.43 |
| Coral Terrace CDP | Miami-Dade | 23,994 | 24,376 | -382 | -1.57% | 3.38 | 7,098.82 | |
| Vero Beach South CDP | Indian River | 23,973 | 23,092 | 881 | 3.82% | 10.25 | 2,338.83 | |
| The Crossings CDP | Miami-Dade | 23,938 | 22,758 | 1,180 | 5.18% | 3.46 | 6,918.50 | |
| 100 | Hialeah Gardens | Miami-Dade | 23,837 | 21,744 | 2,093 | 9.63% | 3.25 | 7,334.46 |
| South Bradenton CDP | Manatee | 23,822 | 22,178 | 1,644 | 7.41% | 4.47 | 5,329.31 | |
| 101 | Crestview | Okaloosa | 23,567 | 20,978 | 2,589 | 12.34% | 16.02 | 1,471.10 |
| Wekiwa Springs CDP | Seminole | 23,500 | 21,998 | 1,502 | 6.83% | 8.59 | 2,735.74 | |
| 102 | Haines City | Polk | 23,454 | 20,535 | 2,919 | 14.21% | 18.39 | 1,275.37 |
| Palm City CDP | Martin | 23,413 | 23,120 | 293 | 1.27% | 13.91 | 1,683.18 | |
| 103 | Jacksonville Beach | Duval | 23,387 | 21,362 | 2,025 | 9.48% | 7.33 | 3,190.59 |
| Keystone CDP | Hillsborough | 23,271 | 24,039 | -768 | -3.19% | 35.13 | 662.43 | |
| Westchase CDP | Hillsborough | 23,222 | 21,747 | 1,475 | 6.78% | 9.87 | 2,352.79 | |
| Oak Ridge CDP | Orange | 23,108 | 22,685 | 423 | 1.86% | 3.57 | 6,472.83 | |
| Oakleaf Plantation CDP | Clay | 23,087 | 20,315 | 2,772 | 13.65% | 16.57 | 1,393.30 | |
| Palm River-Clair Mel CDP | Hillsborough | 23,017 | 21,024 | 1,993 | 9.48% | 11.55 | 1,992.81 | |
| Bloomingdale CDP | Hillsborough | 22,882 | 22,711 | 171 | 0.75% | 8.13 | 2,814.51 | |
| Northdale CDP | Hillsborough | 22,725 | 22,079 | 646 | 2.93% | 8.08 | 2,812.50 | |
| Estero CDP | Lee | 22,612 | 18,176 | 4,436 | 24.41% | 20.02 | 1,129.47 | |
| 104 | Venice | Sarasota | 22,465 | 20,748 | 1,717 | 8.28% | 15.27 | 1,471.19 |
| 105 | Leesburg | Lake | 22,419 | 20,117 | 2,302 | 11.44% | 30.8 | 727.89 |
| Bellview CDP | Escambia | 22,341 | 23,355 | -1,014 | -4.34% | 11.64 | 1,919.33 | |
| Hunters Creek CDP | Orange | 22,327 | 14,321 | 8,006 | 55.90% | 3.83 | 5,829.50 | |
| 106 | Sunny Isles Beach | Miami-Dade | 22,086 | 20,832 | 1,254 | 6.02% | 1.02 | 21,652.94 |
| 107 | Edgewater | Volusia | 22,077 | 20,750 | 1,327 | 6.40% | 22.22 | 993.56 |
| Pace CDP | Santa Rosa | 21,997 | 20,039 | 1,958 | 9.77% | 24.23 | 907.84 | |
| Ensley CDP | Escambia | 21,981 | 20,602 | 1,379 | 6.69% | 12.17 | 1,806.16 | |
| 108 | Fort Walton Beach | Okaloosa | 21,971 | 19,507 | 2,464 | 12.63% | 7.48 | 2,937.30 |
| Brent CDP | Escambia | 21,957 | 21,804 | 153 | 0.70% | 10.38 | 2,115.32 | |
| 109 | Naples | Collier | 21,845 | 19,537 | 2,308 | 11.81% | 12.31 | 1,774.57 |
| Palm Valley CDP | St. Johns | 21,630 | 20,019 | 1,611 | 8.05% | 12.21 | 1,771.50 | |
| 110 | West Melbourne | Brevard | 21,293 | 18,355 | 2,938 | 16.01% | 10.2 | 2,087.55 |
| 111 | Lynn Haven | Bay | 20,850 | 18,493 | 2,357 | 12.75% | 10.37 | 2,010.61 |
| Lealman CDP | Pinellas | 20,783 | 19,879 | 904 | 4.55% | 4.01 | 5,182.79 | |
| 112 | Eustis | Lake | 20,768 | 18,558 | 2,210 | 11.91% | 10.5 | 1,977.90 |
| 113 | Sweetwater | Miami-Dade | 20,701 | 13,499 | 7,202 | 53.35% | 0.79 | 26,203.80 |
| Ruskin CDP | Hillsborough | 20,643 | 17,208 | 3,435 | 19.96% | 18.01 | 1,146.20 | |
| Holiday CDP | Pasco | 20,636 | 22,403 | -1,767 | -7.89% | 5.37 | 3,842.83 | |
| Sun City Center CDP | Hillsborough | 20,554 | 19,258 | 1,296 | 6.73% | 15.74 | 1,305.84 | |
| West Pensacola CDP | Escambia | 20,538 | 21,339 | -801 | -3.75% | 7.18 | 2,860.45 | |
| Ives Estates CDP | Miami-Dade | 20,510 | 19,525 | 985 | 5.04% | 2.5 | 8,204.00 | |
| Lutz CDP | Hillsborough | 20,398 | 19,344 | 1,054 | 5.45% | 24.65 | 827.51 | |
| 114 | DeBary | Volusia | 20,394 | 19,320 | 1,074 | 5.56% | 18.97 | 1,075.07 |
| Horizon West CDP | Orange | 19,706 | 14,000 | 5,706 | 40.76% | 32.94 | 598.24 | |
| Florida Ridge CDP | Indian River | 19,701 | 18,164 | 1,537 | 8.46% | 10.77 | 1,829.25 | |
| Jasmine Estates CDP | Pasco | 19,604 | 18,989 | 615 | 3.24% | 3.55 | 5,522.25 | |
| 115 | Bartow | Polk | 19,499 | 17,298 | 2,201 | 12.72% | 45.87 | 425.09 |
| Bayshore Gardens CDP | Manatee | 19,446 | 16,323 | 3,123 | 19.13% | 3.5 | 5,556.00 | |
| 116 | Pinecrest village | Miami-Dade | 19,444 | 18,223 | 1,221 | 6.70% | 7.45 | 2,609.93 |
| 117 | Belle Glade | Palm Beach | 19,130 | 17,467 | 1,663 | 9.52% | 5.62 | 3,403.91 |
| Ojus CDP | Miami-Dade | 19,030 | 18,036 | 994 | 5.51% | 2.65 | 7,181.13 | |
| 118 | Punta Gorda | Charlotte | 18,796 | 16,641 | 2,155 | 12.95% | 15.01 | 1,252.23 |
| San Carlos Park CDP | Lee | 18,443 | 16,824 | 1,619 | 9.62% | 4.72 | 3,907.42 | |
| 119 | Seminole | Pinellas | 18,334 | 17,233 | 1,101 | 6.39% | 5.1 | 3,594.90 |
| 120 | Cocoa | Brevard | 18,102 | 17,140 | 962 | 5.61% | 13.32 | 1,359.01 |
| Gibsonton CDP | Hillsborough | 18,070 | 14,234 | 3,836 | 26.95% | 12.79 | 1,412.82 | |
| Glenvar Heights CDP | Miami-Dade | 17,881 | 16,898 | 983 | 5.82% | 4.12 | 4,340.05 | |
| 121 | Marco Island | Collier | 17,847 | 16,413 | 1,434 | 8.74% | 12.14 | 1,470.10 |
| 122 | Safety Harbor | Pinellas | 17,606 | 16,884 | 722 | 4.28% | 4.9 | 3,593.06 |
| 123 | Maitland | Orange | 17,519 | 15,751 | 1,768 | 11.22% | 5.27 | 3,324.29 |
| Midway CDP | Santa Rosa | 17,434 | 16,115 | 1,319 | 8.18% | 12.01 | 1,451.62 | |
| Pinewood CDP | Miami-Dade | 16,992 | 16,520 | 472 | 2.86% | 1.76 | 9,654.55 | |
| Lake Butler CDP | Orange | 16,871 | 15,400 | 1,471 | 9.55% | 12.22 | 1,380.61 | |
| 124 | Vero Beach | Indian River | 16,751 | 15,220 | 1,531 | 10.06% | 11.44 | 1,464.25 |
| Three Lakes CDP | Miami-Dade | 16,749 | 15,047 | 1,702 | 11.31% | 3.2 | 5,234.06 | |
| 125 | Stuart | Martin | 16,623 | 15,593 | 1,030 | 6.61% | 6.65 | 2,499.70 |
| Country Walk CDP | Miami-Dade | 16,485 | 15,997 | 488 | 3.05% | 2.58 | 6,389.53 | |
| 126 | Opa-locka | Miami-Dade | 16,457 | 15,219 | 1,238 | 8.13% | 4.3 | 3,827.21 |
| Brownsville CDP | Miami-Dade | 16,410 | 15,313 | 1,097 | 7.16% | 2.27 | 7,229.07 | |
| Apollo Beach CDP | Hillsborough | 16,336 | 14,055 | 2,281 | 16.23% | 19.84 | 823.39 | |
| Fish Hawk CDP | Hillsborough | 16,297 | 14,087 | 2,210 | 15.69% | 16.21 | 1,005.37 | |
| 127 | Lake Mary | Seminole | 16,198 | 13,822 | 2,376 | 17.19% | 9.16 | 1,768.34 |
| Palmetto Estates CDP | Miami-Dade | 16,175 | 13,535 | 2,640 | 19.50% | 2.16 | 7,488.43 | |
| 128 | New Port Richey | Pasco | 16,167 | 14,911 | 1,256 | 8.42% | 4.53 | 3,568.87 |
| Myrtle Grove CDP | Escambia | 16,134 | 15,870 | 264 | 1.66% | 6.64 | 2,429.82 | |
| Sunset CDP | Miami-Dade | 16,069 | 16,389 | -320 | -1.95% | 3.48 | 4,617.53 | |
| 129 | Tavares | Lake | 15,922 | 13,951 | 1,971 | 14.13% | 9.5 | 1,676.00 |
| 130 | Lake Wales | Polk | 15,860 | 14,225 | 1,635 | 11.49% | 18.69 | 848.58 |
| West Lealman CDP | Pinellas | 15,838 | 15,651 | 187 | 1.19% | 3.13 | 5,060.06 | |
| Sarasota Springs CDP | Sarasota | 15,547 | 14,395 | 1,152 | 8.00% | 3.5 | 4,442.00 | |
| 131 | Auburndale | Polk | 15,540 | 13,507 | 2,033 | 15.05% | 13.49 | 1,151.96 |
| 132 | Callaway | Bay | 15,269 | 14,405 | 864 | 6.00% | 9.01 | 1,694.67 |
| Conway CDP | Orange | 15,187 | 13,467 | 1,720 | 12.77% | 3.42 | 4,440.64 | |
| 133 | West Park | Broward | 15,112 | 14,156 | 956 | 6.75% | 2.19 | 6,900.46 |
| 134 | Longwood | Seminole | 15,011 | 13,657 | 1,354 | 9.91% | 5.45 | 2,754.31 |
| Southchase CDP | Orange | 14,987 | 15,921 | -934 | -5.87% | 6.84 | 2,191.08 | |
| 136 | Niceville | Okaloosa | 14,974 | 12,749 | 2,225 | 17.45% | 11.42 | 1,311.21 |
| 135 | Lady Lake | Lake | 14,974 | 13,926 | 1,048 | 7.53% | 8.07 | 1,855.51 |
| Forest City CDP | Seminole | 14,924 | 13,854 | 1,070 | 7.72% | 4.26 | 3,503.29 | |
| 137 | Zephyrhills | Pasco | 14,907 | 13,288 | 1,619 | 12.18% | 8.88 | 1,678.72 |
| South Venice CDP | Sarasota | 14,652 | 13,949 | 703 | 5.04% | 6.02 | 2,433.89 | |
| Olympia Heights CDP | Miami-Dade | 14,645 | 13,488 | 1,157 | 8.58% | 2.65 | 5,526.42 | |
| Englewood CDP | Sarasota & Charlotte | 14,515 | 14,863 | -348 | -2.34% | 9.79 | 1,482.64 | |
| 138 | Miami Springs | Miami-Dade | 14,431 | 13,809 | 622 | 4.50% | 2.88 | 5,010.76 |
| 139 | Oldsmar | Pinellas | 14,397 | 13,591 | 806 | 5.93% | 8.7 | 1,654.83 |
| Lockhart CDP | Orange | 14,312 | 13,060 | 1,252 | 9.59% | 4.42 | 3,238.01 | |
| 140 | St. Augustine | St. Johns | 14,280 | 12,975 | 1,305 | 10.06% | 9.43 | 1,514.32 |
| Upper Grand Lagoon CDP | Bay | 14,216 | 13,963 | 253 | 1.81% | 8.09 | 1,757.23 | |
| Gonzalez CDP | Escambia | 14,187 | 13,273 | 914 | 6.89% | 15.11 | 938.91 | |
| Bellair-Meadowbrook Terrace CDP | Clay | 13,987 | 13,343 | 644 | 4.83% | 4.2 | 3,330.24 | |
| Elfers CDP | Pasco | 13,982 | 13,986 | -4 | -0.03% | 3.54 | 3,949.72 | |
| Iona CDP | Lee | 13,830 | 15,369 | -1,539 | -10.01% | 6.6 | 2,095.45 | |
| 141 | Mount Dora | Lake | 13,818 | 12,370 | 1,448 | 11.71% | 8.02 | 1,722.94 |
| Fruitville CDP | Sarasota | 13,725 | 13,224 | 501 | 3.79% | 6.8 | 2,018.38 | |
| 142 | Destin | Okaloosa | 13,654 | 12,305 | 1,349 | 10.96% | 7.69 | 1,775.55 |
| Hobe Sound CDP | Martin | 13,545 | 11,521 | 2,024 | 17.57% | 5.27 | 2,570.21 | |
| 143 | Atlantic Beach | Duval | 13,452 | 12,655 | 797 | 6.30% | 3.49 | 3,854.44 |
| 144 | Palmetto | Manatee | 13,446 | 12,606 | 840 | 6.66% | 5.37 | 2,503.91 |
| World Golf Village CDP | St. Johns | 13,323 | 12,310 | 1,013 | 8.23% | 26.86 | 496.02 | |
| Thonotosassa CDP | Hillsborough | 13,292 | 13,014 | 278 | 2.14% | 26.5 | 501.58 | |
| Azalea Park CDP | Orange | 13,287 | 12,556 | 731 | 5.82% | 3.18 | 4,178.30 | |
| Middleburg CDP | Clay | 13,062 | 13,008 | 54 | 0.42% | 19.56 | 667.79 | |
| Warrington CDP | Escambia | 13,053 | 14,531 | -1,478 | -10.17% | 6.93 | 1,883.55 | |
| 145 | Key Biscayne village | Miami-Dade | 13,019 | 12,344 | 675 | 5.47% | 1.25 | 10,415.20 |
| Homosassa Springs CDP | Citrus | 13,012 | 13,791 | -779 | -5.65% | 25.14 | 517.58 | |
| 146 | North Palm Beach village | Palm Beach | 12,993 | 12,015 | 978 | 8.14% | 3.6 | 3,609.17 |
| 147 | South Daytona | Volusia | 12,789 | 12,252 | 537 | 4.38% | 3.71 | 3,447.17 |
| 148 | Panama City Beach | Bay | 12,776 | 12,018 | 758 | 6.31% | 18.39 | 694.73 |
| 149 | Wilton Manors | Broward | 12,682 | 11,632 | 1,050 | 9.03% | 1.96 | 6,470.41 |
| Goldenrod CDP | Orange & Seminole | 12,603 | 12,039 | 564 | 4.68% | 2.52 | 5,001.19 | |
| Gladeview CDP | Miami-Dade | 12,525 | 11,535 | 990 | 8.58% | 2.56 | 4,892.58 | |
| 150 | Groveland | Lake | 12,493 | 8,729 | 3,764 | 43.12% | 14.98 | 833.98 |
| East Milton CDP | Santa Rosa | 12,490 | 11,074 | 1,416 | 12.79% | 28.81 | 433.53 | |
| 151 | Fernandina Beach | Nassau | 12,459 | 11,487 | 972 | 8.46% | 11.13 | 1,119.41 |
| Westwood Lakes CDP | Miami-Dade | 12,449 | 11,838 | 611 | 5.16% | 1.64 | 7,590.85 | |
| 152 | Gulfport | Pinellas | 12,407 | 12,029 | 378 | 3.14% | 2.76 | 4,495.29 |
| 153 | Lake City | Columbia | 12,285 | 12,046 | 239 | 1.98% | 12.02 | 1,022.05 |
| Mango CDP | Hillsborough | 12,267 | 11,313 | 954 | 8.43% | 4.66 | 2,632.40 | |
| Jensen Beach CDP | Martin | 12,266 | 11,707 | 559 | 4.77% | 6.76 | 1,814.50 | |
| 154 | South Miami | Miami-Dade | 12,207 | 11,657 | 550 | 4.72% | 2.27 | 5,377.53 |
| 155 | Holly Hill | Volusia | 12,142 | 11,659 | 483 | 4.14% | 3.93 | 3,089.57 |
| 156 | Florida City | Miami-Dade | 12,078 | 11,245 | 833 | 7.41% | 5.95 | 2,029.92 |
| Hudson CDP | Pasco | 12,033 | 12,158 | -125 | -1.03% | 6.32 | 1,903.96 | |
| Cypress Lake CDP | Lee | 11,964 | 11,846 | 118 | 1.00% | 3.86 | 3,099.48 | |
| 157 | Cocoa Beach | Brevard | 11,761 | 11,231 | 530 | 4.72% | 4.66 | 2,523.82 |
| Lakeland Highlands CDP | Polk | 11,728 | 11,056 | 672 | 6.08% | 4.85 | 2,418.14 | |
| Yulee CDP | Nassau | 11,672 | 11,491 | 181 | 1.58% | 23.16 | 503.97 | |
| Jupiter Farms CDP | Palm Beach | 11,514 | 11,994 | -480 | -4.00% | 14.98 | 768.62 | |
| Lakewood Park CDP | St. Lucie | 11,511 | 11,323 | 188 | 1.66% | 6.65 | 1,730.98 | |
| Doctor Phillips CDP | Orange | 11,501 | 10,981 | 520 | 4.74% | 3.39 | 3,392.63 | |
| 158 | Orange City | Volusia | 11,403 | 10,599 | 804 | 7.59% | 7.08 | 1,610.59 |
| Port St. John CDP | Brevard | 11,335 | 12,267 | -932 | -7.60% | 3.87 | 2,928.94 | |
| Viera East CDP | Brevard | 11,264 | 10,757 | 507 | 4.71% | 5.07 | 2,221.70 | |
| 159 | Lantana | Palm Beach | 11,221 | 10,423 | 798 | 7.66% | 2.29 | 4,900.00 |
| 160 | Lighthouse Point | Broward | 11,143 | 10,344 | 799 | 7.72% | 2.31 | 4,823.81 |
| 161 | Minneola | Lake | 11,078 | 9,403 | 1,675 | 17.81% | 10.34 | 1,071.37 |
| Goulds CDP | Miami-Dade | 10,909 | 10,103 | 806 | 7.98% | 2.91 | 3,748.80 | |
| Cheval CDP | Hillsborough | 10,833 | 10,702 | 131 | 1.22% | 5.96 | 1,817.62 | |
| 162 | Satellite Beach | Brevard | 10,832 | 10,109 | 723 | 7.15% | 2.92 | 3,709.59 |
| Shady Hills CDP | Pasco | 10,817 | 11,523 | -706 | -6.13% | 28.57 | 378.61 | |
| Pine Castle CDP | Orange | 10,796 | 10,805 | -9 | -0.08% | 2.49 | 4,335.74 | |
| 163 | Miami Shores village | Miami-Dade | 10,762 | 10,493 | 269 | 2.56% | 2.49 | 4,322.09 |
| 164 | Sebring | Highlands | 10,638 | 10,491 | 147 | 1.40% | 9.98 | 1,065.93 |
| Westview CDP | Miami-Dade | 10,624 | 9,650 | 974 | 10.09% | 3.1 | 3,427.10 | |
| Fairview Shores CDP | Orange | 10,586 | 10,239 | 347 | 3.39% | 3.03 | 3,493.73 | |
| Union Park CDP | Orange | 10,498 | 9,765 | 733 | 7.51% | 3 | 3,499.33 | |
| Key Largo CDP | Monroe | 10,496 | 10,433 | 63 | 0.60% | 12.05 | 871.04 | |
| Trinity CDP | Pasco | 10,459 | 10,907 | -448 | -4.11% | 4.62 | 2,263.85 | |
| 165 | Palatka | Putnam | 10,452 | 10,558 | -106 | -1.00% | 8.55 | 1,222.46 |
| Pine Ridge CDP | Citrus County | 10,402 | 9,598 | 804 | 8.38% | 24.85 | 418.59 | |
| West Perrine CDP | Miami-Dade | 10,399 | 8,600 | 1,799 | 20.92% | 1.7 | 6,117.06 | |
| Gulf Gate Estates CDP | Sarasota | 10,358 | 10,911 | -553 | -5.07% | 2.71 | 3,822.14 | |
| 166 | Cape Canaveral | Brevard | 10,352 | 9,912 | 440 | 4.44% | 2.33 | 4,442.92 |
| Villas CDP | Lee | 10,349 | 11,569 | -1,220 | -10.55% | 4.65 | 2,225.59 | |
| 167 | Avon Park | Highlands | 10,259 | 8,836 | 1,423 | 16.10% | 7.15 | 1,434.83 |
| Highland City CDP | Polk | 10,120 | 10,834 | -714 | -6.59% | 8.01 | 1,263.42 | |
| Port Salerno CDP | Martin | 9,999 | 10,091 | -92 | -0.91% | 3.53 | 2,832.58 |
Annual Estimates of the Resident Population: April 1, 2010 to July 1, 2016
Source: U.S. Census Bureau, Population Division
Release Dates: For the United States, regions, divisions, states, and Puerto Rico Commonwealth, December 2016. For counties, municipios, metropolitan statistical areas, micropolitan statistical areas, metropolitan divisions, and combined statistical areas, March 2017. For cities and towns (incorporated places and minor civil divisions), May 2017
The most popular loan type in Florida is the 30-year fixed rate mortgage. This loan allows buyers to lock in a low interest rate on their loans without having to worry about future uncertainty. 15-year fixed rate mortgages allow homeowners to build equity much faster.
The most common adjustable mortgages are one-, three- and five-year adjustable rate mortgages. These loans keep the same rate for a certain time period and then go up or down depending on current market conditions.
Relatively high real estate prices around the Miami metro area make a large portion of loans jumbo mortgages, as they exceed the conforming limit. As of 2025 the conforming loan limit across the United States is set to $806,500, with a ceiling of 150% that amount in areas where median home values are higher. Jumbo loans typically have a slightly higher rate of interest than conforming mortgages, though spreads vary based on credit market conditions. The $806,500 limit applies to most of the state outside of Monroe County.
| County Name | Metropolitan Designation | 1 Unit Limit | 2 Unit Limit | 3 Unit Limit | 4 Unit Limit |
|---|---|---|---|---|---|
| Monroe | Key West, Fl | $967,150 | $1,238,150 | $1,496,600 | $1,859,950 |
| All Others | Rest of the State | $806,500 | $1,032,650 | $1,248,150 | $1,551,250 |
A home equity line of credit (HELOC) can be perfect for people who need to access the equity they have already built in their home. Often used by small business owners, or people that want immediate access to cash for emergencies like home or vehicle repairs, HELOCs work like a credit card where you only pay the interest for the money you borrow.
The amount a home buyer puts down to buy a Florida home is typically 20 percent, but it can vary according to the type of home (single family or condominium), its location and the loan you are seeking. A second mortgage can be a great alternative to only having one loan with property mortgage insurance (PMI). The second loan can be applied to the home's down payment so PMI is not required. The interest rate will be higher than your first mortgage. The secondary loans have a lower priority than a primary mortgage during the foreclosure process, which means the risk of these loans are higher for lenders.
Federally insured loans have low interest rates, low down payment requirements & built in mortgage insurance.
Many Florida state programs as well as federal programs are available to help low-income individuals, veterans, senior citizens, the disabled as well as rural home buyers in Florida. Check online for information on assistance programs within the specific Florida county where you wish to purchase a home.
Here are just a few of the available housing programs:
In addition to its warm sunshine, Florida weather can include hurricane winds and flooding of low-lying coastal areas. Even central counties across Florida havea moderate to high risk of flooding. Therefore, many lenders require weather-related insurance. Lenders also are now looking at predicted rises in sea levels due to climate change when they consider insuring oceanfront homes. Here are risk profiles of flooding based on counties across the state.
Florida is also known for having a high risk of damage from hurricanes.
Typically, homes built after 2002, when building code regulations tightened, are subject to lower insurance rates than older homes. On the other hand, homes without hurricane straps, with roofs that do not meet current standards for wind, with older plumbing or with outdated electrical systems may be difficult – or very expensive – to insure.
Low-lying coastal properties may precipitously decline in value if perception of hurricanes or global warming cause people to try to exit before the crash.

“If property values start to fall, Cason said, banks could stop writing 30-year mortgages for coastal homes, shrinking the pool of able buyers and sending prices lower still. Those properties make up a quarter of the city’s tax base; if that revenue fell, the city would struggle to provide the services that make it such a desirable place to live, causing more sales and another drop in revenue”
Home buyers with mortgages in high-risk areas are required to buy flood insurance. Most flood insurance policies are sold by the United States federal government through The National Flood Insurance Program.
Under-priced flood insurance in high-risk areas act as a subsidy to wealthy homeowners.
“The NFIP does not charge nearly enough to cover the expected costs of its liabilities. The assessments are not sufficient to build any buffer to cover an extraordinary year, such as what occurred with Hurricane Katrina in 2005 or Hurricane Sandy in 2012. Because homeowners don't incur the full cost of building in a flood zone we end up with more houses there than if homeowners incurred the full cost of the flood risk, which exacerbates the government's costs in the next disaster.”
Homeowners who live in lower risk areas & are not required to purchase flood insurance heavily cross-subsidize homeowners who are in areas where floods are more common.
The risk of wildfires is considered moderate to very high across much of the state. Fire damages from wildfires & other types of fires are typically covered in most homeowner's insurance policies. If you own expensive items you may want to keep an up-to-date household inventory list which lists specific valuables, such as fine art & jewelry.
A couple portions of the state are considered to have a moderate tornado risk: the area slightly north of Tampa on the west coast, along with the eastern cost about half way between Miami and Orlando. A basic homeowners policy should cover financial damages from tornadoes.
Hail damage is common in the northeast corner of the state & near Orlando. Damage from hail is typically covered by home insurance policies.
While the sunny weather and mild climate are big reasons why many people move to Florida, another big draw is that there is no state income tax. What’s more is that the sales tax rates of Florida’s major cities are lower than those of other large cities in the U.S.
However, property taxes are a primary source of revenue for Florida county and state projects, so it is wise to educate yourself on property tax rates before you purchase a home. Each city and county has its own taxation rates.
The average property assessment across the state is 1.05% which costs $2,936 per year. The Naples-Immokalee-Marcos Island area has the highest average property tax expense across the state at $5,035 per year. The national average property tax rate is 1.24% for a cost of $3,313 per year.
There are many properties in Florida that are governed by a homeowners’ associations. In these situations, all homeowners are subject to association rules and regulations and must pay fees for community maintenance.
For example, homeowner’s associations can restrict how many people live in your home, the pets you have and whether or not you can rent the property to others.
Some retirement communities & golf properties charge massive fees which must be paid anytime someone buys into the community. These in turn depress how much the homes can be sold for. In fact, during the recession some sites like Auction.com were selling properties for as little as $1 as owning them cost many thousands in annual fees and a $40,000 fee to join.
“the “$1 condos” require you to pay a non-refundable $10,000 country club membership application fee as well as a $40,000 equity buy-in to join the club. When you sell your unit, you may get back as much as 70 percent of your equity buy-in ($28,000). You are also required to pay annual country club dues of approximately $10,000.”
Florida is a “High Closing Cost” state, which means it is more expensive to close in Florida than in many other states. However, Florida offers lower closing costs than its neighboring states of Georgia and Alabama.
The majority of Florida closing costs are paid to the lender. For example, with the purchase of a $200,000 home, there is an average of $1,800 in closing costs with more than $1,000 of the costs going to the lender. Cash buyers often receive a 50 percent or more discount on closing costs in Florida.
Since the pre-recession housing boom, lenders’ origination fees have decreased considerably and currently average under 1 percent of the loan amount. Some Florida lenders include a document preparation fee and a tax services fee, which usually have a combined total of $100 or less.
Non-lender closing costs can vary according to each particular transaction, but here are the most common ones in the state:
Florida law requires that sellers disclose any facts or conditions about their property that may affect its value such as:
Sellers of houses built before 1978 must comply with federal law regarding lead-based paint.
Florida does not require that buyers engage a lawyer in a home purchase.
Florida is a Homestead State, which means that if your new home will serve as your primary residence, you can file for an exemption worth up to $50,000. This exemption lowers the amount of property taxes you are required to pay and limits the amount those taxes will go up each year.
In Florida, the foreclosure process is a judicial proceeding that can take a year or more to complete.
The lender initiates the foreclosure process by filing a written complaint with the state court that is then served to the borrower together with a summons that specifies that the borrower respond within 20 days. If the borrower does not respond within that period, the lender can get a default judgment from the court.
If the borrower does respond, the lender then will either file a motion of summary judgment or go to trial with the case. The court will grant a summary judgment in favor of the lender when there is no dispute on the important facts of the case.
Check out the following resources to learn more about the Florida real estate market.
The Federal Reserve has begun lowering interest rates. Lock in today's low rates and save on your loan.
Are you paying too much for your mortgage?
Check your mortgage options with a trusted El Monte lender.
Answer a few questions below and connect with a lender who can help save you money today!