
The following table shows current 30-year jumbo mortgage rates available in Cambridge. You can use the menus to select other loan durations, alter the loan amount, or change your location.
Fannie Mae & Freddie Mac are government-sponsored enterprises which provide liquidity to the national mortgage market by buying mortgages and keeping them in their portfolios or packaging the residential mortgages into mortgage-backed securities (MBS) sold to secondary investors. They have limits on the size of the residential mortgages they package into securities. Jumbo mortgages are loans which back home purchases where the amount financed exceeds the conforming mortgage loan limit.
Jumbo does not refer to the size of the house, but rather the amount of the loan. Many coastal properties are highly valued even if they are not physically large dwellings.
the distinction between jumbo and super jumbo is also based upon the amount of the loan. Lenders internally determine where they set classifications. In many parts of the country $1,000,000 is the demarcation line, but in wealthy areas the floor for super jumbo might be closer to $1,500,000 or $2,000,000.
Jumbo mortgages have higher risk to the lender and lower liquidity in the marketplace. Historically lenders have typically charged higher rates than on conforming mortgages, though as the recovery has continued that gap has shrunk and there have been brief periods where yields on jumbo mortgages were lower than conforming mortgages. Prior to the 2008 recession jumbo loans had a spread of about 0.2% against conforming loans. During the crisis this spread blew out to a peak of about 1.7%, but has since come down to where jumbo mortgages are similarly priced to conforming mortgages.
Jumbo loans can be structured as either fixed or adjustable rate offerings, and yields tend to be similar to the associated conforming options. The most common adjustable rate option is the 5/1 ARM but other options exist including 5/5, 7/1 & 10/1.
For the first two loan types it means the interest rate would remain the same for the first 5 years of the loan. Then on the first loan the interest rate could reset annually after that, whereas on the second loan interest rates would reset every 5 years. The third and fourth examples would have a set rate for 7 and 10 years respectively and then reset annually. Adjustable-rate mortgages adjust based upon a spread off a reference rate such as LIBOR, up to a pre-determined rate cap in the loan contract.
Lenders create their one underwriting guidelines for jumbo loans. As part of that process, borrowers may have to produce bank statements over the past year along with W2s, and 1099s. Self-employed people may need to show two years of tax returns. Lenders also typically want to see
A second appraisal of the home may also be required to verify its value.
The additional information needed to qualify a borrower means that closing costs are typicially higher on jumbo mortgages than on conforming loans.
On conforming mortgages about 35% of borrowers put at least 20% down. On jumbo mortgages down payments of 5% or 10% are quite common.
Most jumbo loans do not require PMI payments, however borrowers with a small downpayment may incur additional fees and get charged a higher interest rate. The higher rate of interest is a way lenders can self-insure the loan, charging the equivalent of PMI for those with small down payments. Those who are buying a second home with a jumbo loan will typically be required to show more reserves and have better credit.
Some borrowers who struggle to secure a jumbo loan may be able to qualify for a conforming loan and use a second piggyback mortgage plus put more cash down to get below the conforming loan limits, which are $766,550 for a single-family home throughout most of the country and as high as $1,149,825 in designated high-cost areas. Piggyback loans are typically issued for 10% to 15% of the property purchase price and come with a slightly higher rate of interest since the primary mortgage has the first claim on any default. In most cases second mortgages use adjustable rates, but fixed rate options are available at slightly higher rates.
Homes backed by jumbo loans should be fully insured to protect against natural disasters. Most insurance policies do not cover earthquakes or flooding by default, so supplemental policies may be needed.
The below examples compared 2017 to 2018 due to a major change in the tax laws. Each year the standard deduction amounts generally increase slightly to account for inflation. The same types of calculations apply today even if the standard deduction limits are higher. The Biden administration has also promised major changes to tax laws, which can significantly alter the calculations, particularly if he removes the cap on FICA taxes along with raising marginal tax rates.
In 2018 homeowners are able to deduct from their income interest expenses on up to $750,000 of mortgage debt. At a 5% interest rate, a homeowner would pay at least $37,249 in interest during the first 12 months on a mortgage debt above this cap. That compares against the following standard deduction amounts.
| 2021 Filing Status | Standard Deduction Amount |
|---|---|
| Single | $12,000 |
| Married Filing Jointly & Surviving Spouse | $24,000 |
| Married Filing Separately | $12,000 |
| Head of Household | $18,000 |
| Child Tax Credit | $2,000 |
| Other Dependent | $500 |
If a married couple had an income of $650,000 and were taxed at the marginal 37% rate then claiming the mortgage interest deduction on the above mortgage could save them about $2,913.75 in federal income tax.
($37,249 - $24,000) * 37% = $4,902.13
For the sake of simplicity the child tax credit of up to $2,000 per child was left out as if it counts it would only further lower the above gain from itemizing, and that deduction amount starts phasing out as income rises. The phase out begins at $200,000 for nonmarried households and $400,000 for married couples.
In 2017 homeowners are able to deduct from their income interest expenses on up to $1 million of mortgage debt. At a 4.25% interest rate, a homeowner would pay $42,174.13 in interest during the first 12 months on $1 million in mortgage debt. That compares against the following standard deduction amounts.
| 2017 Filing Status | Standard Deduction Amount |
|---|---|
| Single | $6,350 |
| Married Filing Jointly & Surviving Spouse | $12,700 |
| Married Filing Separately | $6,350 |
| Head of Household | $9,350 |
| Additional Dependents | $1,050 |
If a married couple had 2 kids an income of $650,000 and were taxed at the marginal 39.6% rate then claiming the mortgage interest deduction on the above mortgage could save them about $10,840.15 in federal income tax.
($42,174.13 - $14,800) * 39.6% = $10,840.15.
Keep in mind this example uses lower interest rates which were available in 2017. The tax savings on the higher mortgage rates offered in 2018 would have been more substantial. And the old loan principal limit for deducting interest was $1,000,000 rather than $750,000.
In 2013 the "Pease limitation" was re-enacted. It along with the "Personal Exemption Phaseout" act as a surcharge on high-income individuals which act as a ~ 1% surcharge on income.
It is also worth noting that a rising rate curve lifts the interest expense on debt, which will yield higher income tax savings as more is spent on interest.
As of 2024 the FHFA set the conforming loan limit for single unit homes across the continental United States to $766,550, with a ceiling of 150% that amount - $1,149,825 - in areas where median home values are higher. The limit is as follows for 2, 3, and 4-unit homes $981,500, $1,186,350, and $1,474,400. The limits are higher in Alaska, Hawaii, Guam, the U.S. Virgin Islands & other high-cost areas. Loans which exceed these limits are classified as jumbo loans.
The limits in the first row apply to all areas of Alabama, Arizona, Arkansas, Connecticut, Delaware, Georgia, Illinois, Indiana, Iowa, Kansas, Kentucky, Louisiana, Maine, Michigan, Minnesota, Mississippi, Missouri, Montana, Nevada, New Mexico, North Carolina, North Dakota, Ohio, Oklahoma, Rhode Island, South Carolina, South Dakota, Texas, Vermont, Wisconsin & most other parts of the continental United States. Some coastal states are homes to metro areas with higher property prices which qualify the county they are in as a HERA designated high-cost areas.
The limits in the third row apply to Alaska, Guam, Virgin Islands, Washington D.C & Hawaii.
| Units | 1 | 2 | 3 | 4 |
|---|---|---|---|---|
| Continental U.S. Baseline | $766,550 | $981,500 | $1,186,350 | $1,474,400 |
| Designated High-cost Areas | $1,149,825 | $1,472,250 | $1,779,525 | $2,211,600 |
| Alaska, Hawaii, Guam & U.S. Virgin Islands | $1,149,825 | $1,472,250 | $1,779,525 | $2,211,600 |
The FHFA offers an interactive map of conforming limits by county. A static version of the map is included below.
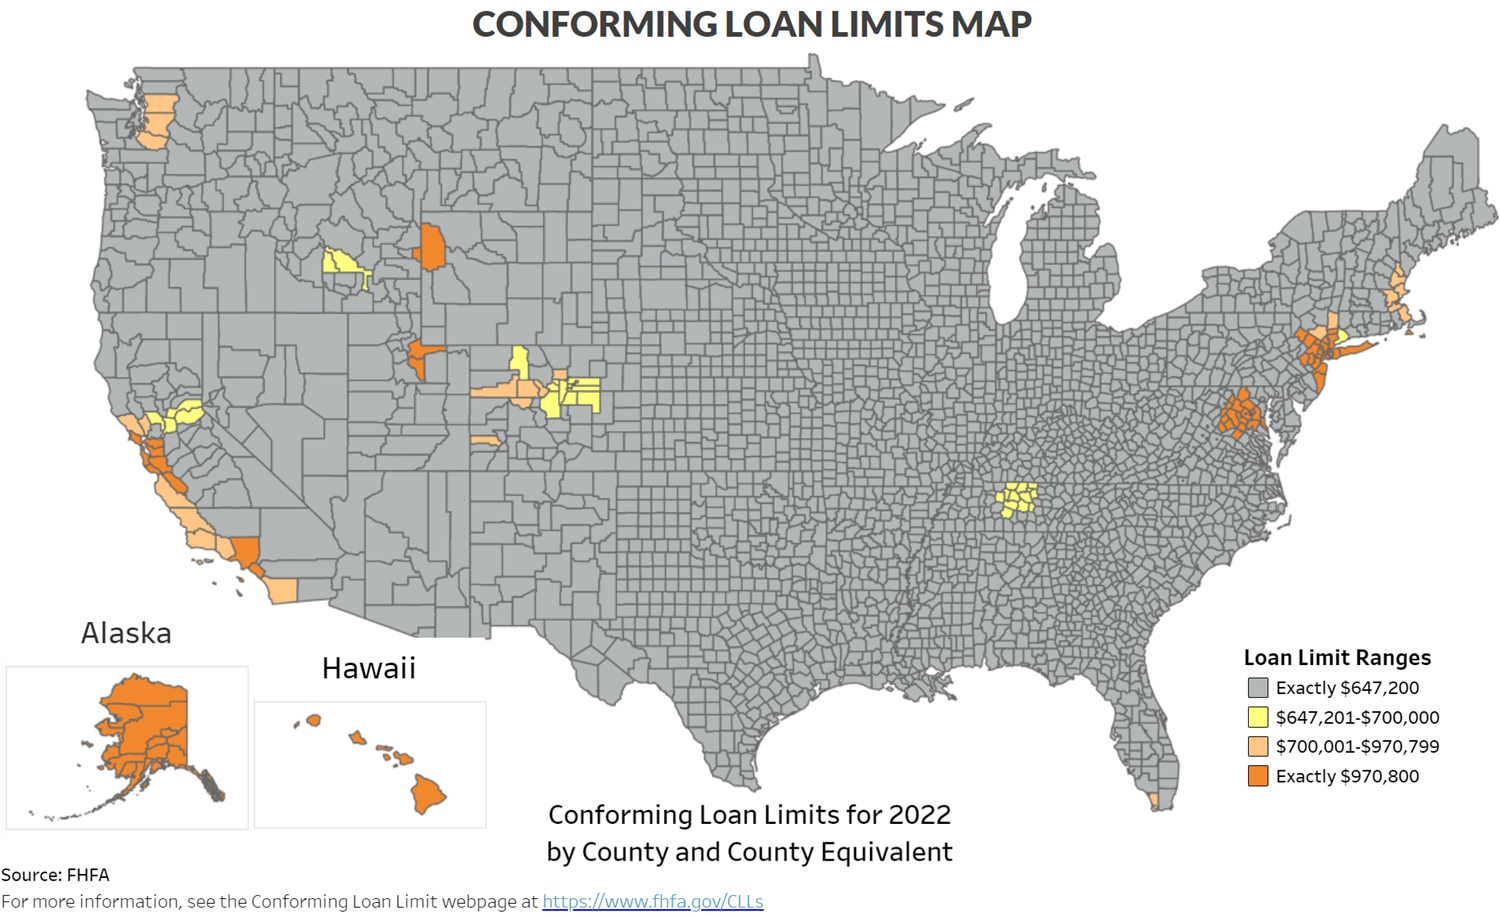
Here is state by state data for areas where the limit excedes the baseline loan limit range. For all other areas of the country the above listed limits apply.
| County | 5-Digit County Code | 1 Unit Limit | 2 Unit Limit | 3 Unit Limit | 4 Unit Limit |
|---|---|---|---|---|---|
| All | 02013 - 02290 | $1,149,825 | $1,472,250 | $1,779,525 | $2,211,600 |
| County | 5-Digit County Code | Metropolitan Area | 1 Unit Limit | 2 Unit Limit | 3 Unit Limit | 4 Unit Limit |
|---|---|---|---|---|---|---|
| Alameda | 06001 | San Francisco-Oakland-Hayward, Ca | $1,149,825 | $1,472,250 | $1,779,525 | $2,211,600 |
| Contra Costa | 06013 | San Francisco-Oakland-Hayward, Ca | $1,149,825 | $1,472,250 | $1,779,525 | $2,211,600 |
| Los Angeles | 06037 | Los Angeles-Long Beach-Anaheim, Ca | $1,149,825 | $1,472,250 | $1,779,525 | $2,211,600 |
| Marin | 06041 | San Francisco-Oakland-Hayward, Ca | $1,149,825 | $1,472,250 | $1,779,525 | $2,211,600 |
| Monterey | 06053 | Salinas, Ca | $920,000 | $1,177,750 | $1,423,650 | $1,769,250 |
| Napa | 06055 | Napa, Ca | $1,017,750 | $1,302,900 | $1,574,900 | $1,957,250 |
| Orange | 06059 | Los Angeles-Long Beach-Anaheim, Ca | $1,149,825 | $1,472,250 | $1,779,525 | $2,211,600 |
| San Benito | 06069 | San Jose-Sunnyvale-Santa Clara, Ca | $1,149,825 | $1,472,250 | $1,779,525 | $2,211,600 |
| San Diego | 06073 | San Diego-Carlsbad, Ca | $1,006,250 | $1,288,200 | $1,557,150 | $1,935,150 |
| San Francisco | 06075 | San Francisco-Oakland-Hayward, Ca | $1,149,825 | $1,472,250 | $1,779,525 | $2,211,600 |
| San Luis Obispo | 06079 | San Luis Obispo-Paso Robles-Arroyo Gran | $929,200 | $1,189,550 | $1,437,900 | $1,786,950 |
| San Mateo | 06081 | San Francisco-Oakland-Hayward, Ca | $1,149,825 | $1,472,250 | $1,779,525 | $2,211,600 |
| Santa Barbara | 06083 | Santa Maria-Santa Barbara, Ca | $838,350 | $1,073,250 | $1,297,300 | $1,612,250 |
| Santa Clara | 06085 | San Jose-Sunnyvale-Santa Clara, Ca | $1,149,825 | $1,472,250 | $1,779,525 | $2,211,600 |
| Santa Cruz | 06087 | Santa Cruz-Watsonville, Ca | $1,149,825 | $1,472,250 | $1,779,525 | $2,211,600 |
| Sonoma | 06097 | Santa Rosa, Ca | $877,450 | $1,123,300 | $1,357,800 | $1,687,450 |
| Ventura | 06111 | Oxnard-Thousand Oaks-Ventura, Ca | $954,500 | $1,221,950 | $1,477,050 | $1,835,600 |
| County | 5-Digit County Code | Metropolitan Area | 1 Unit Limit | 2 Unit Limit | 3 Unit Limit | 4 Unit Limit |
|---|---|---|---|---|---|---|
| Adams | 08001 | Denver-Aurora-Lakewood, Co | $ 816,500 | $1,045,250 | $1,263,500 | $1,570,200 |
| Arapahoe | 08005 | Denver-Aurora-Lakewood, Co | $ 816,500 | $1,045,250 | $1,263,500 | $1,570,200 |
| Boulder | 08013 | Boulder, Co | $ 856,750 | $1,096,800 | $1,325,800 | $1,647,650 |
| Broomfield | 08014 | Denver-Aurora-Lakewood, Co | $ 816,500 | $1,045,250 | $1,263,500 | $1,570,200 |
| Clear Creek | 08019 | Denver-Aurora-Lakewood, Co | $ 816,500 | $1,045,250 | $1,263,500 | $1,570,200 |
| Denver | 08031 | Denver-Aurora-Lakewood, Co | $ 816,500 | $1,045,250 | $1,263,500 | $1,570,200 |
| Douglas | 08035 | Denver-Aurora-Lakewood, Co | $ 816,500 | $1,045,250 | $1,263,500 | $1,570,200 |
| Eagle | 08037 | Edwards, Co | $1,149,825 | $1,472,250 | $1,779,525 | $2,211,600 |
| Elbert | 08039 | Denver-Aurora-Lakewood, Co | $ 816,500 | $1,045,250 | $1,263,500 | $1,570,200 |
| Garfield | 08045 | Glenwood Springs, Co | $1,149,825 | $1,472,250 | $1,779,525 | $2,211,600 |
| Gilpin | 08047 | Denver-Aurora-Lakewood, Co | $ 816,500 | $1,045,250 | $1,263,500 | $1,570,200 |
| Jefferson | 08059 | Denver-Aurora-Lakewood, Co | $ 816,500 | $1,045,250 | $1,263,500 | $1,570,200 |
| Park | 08093 | Denver-Aurora-Lakewood, Co | $ 816,500 | $1,045,250 | $1,263,500 | $1,570,200 |
| Pitkin | 08097 | Glenwood Springs, Co | $1,149,825 | $1,472,250 | $1,779,525 | $2,211,600 |
| Routt | 08107 | Steamboat Springs, Co | $1,012,000 | $1,295,550 | $1,566,050 | $1,946,200 |
| San Miguel | 08113 | Non-Metro | $ 994,750 | $1,273,450 | $1,539,350 | $1,913,000 |
| Summit | 08117 | Breckenridge, Co | $1,006,250 | $1,288,200 | $1,557,150 | $1,935,150 |
| County | 5-Digit County Code | 1 Unit Limit | 2 Unit Limit | 3 Unit Limit | 4 Unit Limit |
|---|---|---|---|---|---|
| N/A | 11001 | $1,149,825 | $1,472,250 | $1,779,525 | $2,211,600 |
| County | 5-Digit County Code | Metropolitan Area | 1 Unit Limit | 2 Unit Limit | 3 Unit Limit | 4 Unit Limit |
|---|---|---|---|---|---|---|
| Monroe | 12087 | Key West, Fl | $ 929,200 | $1,189,550 | $1,437,900 | $1,786,950 |
| County | 5-Digit County Code | Metropolitan Area | 1 Unit Limit | 2 Unit Limit | 3 Unit Limit | 4 Unit Limit |
|---|---|---|---|---|---|---|
| Hawaii | 15001 | Hilo, Hi | $1,149,825 | $1,472,250 | $1,779,525 | $2,211,600 |
| Honolulu | 15003 | Urban Honolulu, Hi | $1,149,825 | $1,472,250 | $1,779,525 | $2,211,600 |
| Kalawao | 15005 | Kahului-Wailuku-Lahaina, Hi | $1,149,825 | $1,472,250 | $1,779,525 | $2,211,600 |
| Kauai | 15007 | Kapaa, Hi | $1,149,825 | $1,472,250 | $1,779,525 | $2,211,600 |
| Maui | 15009 | Kahului-Wailuku-Lahaina, Hi | $1,149,825 | $1,472,250 | $1,779,525 | $2,211,600 |
| County | 5-Digit County Code | Metropolitan Area | 1 Unit Limit | 2 Unit Limit | 3 Unit Limit | 4 Unit Limit |
|---|---|---|---|---|---|---|
| Teton | 16081 | Jackson, Wy-Id | $1,149,825 | $1,472,250 | $1,779,525 | $2,211,600 |
| County | 5-Digit County Code | Metropolitan Area | 1 Unit Limit | 2 Unit Limit | 3 Unit Limit | 4 Unit Limit |
|---|---|---|---|---|---|---|
| Calvert | 24009 | Washington-Arlington-Alexandria, Dc-Va- | $1,149,825 | $1,472,250 | $1,779,525 | $2,211,600 |
| Charles | 24017 | Washington-Arlington-Alexandria, Dc-Va- | $1,149,825 | $1,472,250 | $1,779,525 | $2,211,600 |
| Frederick | 24021 | Washington-Arlington-Alexandria, Dc-Va- | $1,149,825 | $1,472,250 | $1,779,525 | $2,211,600 |
| Montgomery | 24031 | Washington-Arlington-Alexandria, Dc-Va- | $1,149,825 | $1,472,250 | $1,779,525 | $2,211,600 |
| Prince George's | 24033 | Washington-Arlington-Alexandria, Dc-Va- | $1,149,825 | $1,472,250 | $1,779,525 | $2,211,600 |
| County | 5-Digit County Code | Metropolitan Area | 1 Unit Limit | 2 Unit Limit | 3 Unit Limit | 4 Unit Limit |
|---|---|---|---|---|---|---|
| Dukes | 25007 | Vineyard Haven, Ma | $1,149,825 | $1,472,250 | $1,779,525 | $2,211,600 |
| Essex | 25009 | Boston-Cambridge-Newton, Ma-Nh | $ 862,500 | $1,104,150 | $1,334,700 | $1,658,700 |
| Middlesex | 25017 | Boston-Cambridge-Newton, Ma-Nh | $ 862,500 | $1,104,150 | $1,334,700 | $1,658,700 |
| Nantucket | 25019 | Non-Metro | $1,149,825 | $1,472,250 | $1,779,525 | $2,211,600 |
| Norfolk | 25021 | Boston-Cambridge-Newton, Ma-Nh | $ 862,500 | $1,104,150 | $1,334,700 | $1,658,700 |
| Plymouth | 25023 | Boston-Cambridge-Newton, Ma-Nh | $ 862,500 | $1,104,150 | $1,334,700 | $1,658,700 |
| Suffolk | 25025 | Boston-Cambridge-Newton, Ma-Nh | $ 862,500 | $1,104,150 | $1,334,700 | $1,658,700 |
| County | 5-Digit County Code | Metropolitan Area | 1 Unit Limit | 2 Unit Limit | 3 Unit Limit | 4 Unit Limit |
|---|---|---|---|---|---|---|
| Rockingham | 33015 | Boston-Cambridge-Newton, Ma-Nh | $ 862,500 | $1,104,150 | $1,334,700 | $1,658,700 |
| Strafford | 33017 | Boston-Cambridge-Newton, Ma-Nh | $ 862,500 | $1,104,150 | $1,334,700 | $1,658,700 |
| County | 5-Digit County Code | Metropolitan Area | 1 Unit Limit | 2 Unit Limit | 3 Unit Limit | 4 Unit Limit |
|---|---|---|---|---|---|---|
| Bergen | 34003 | New York-Newark-Jersey City, Ny-Nj-Pa | $1,149,825 | $1,472,250 | $1,779,525 | $2,211,600 |
| Essex | 34013 | New York-Newark-Jersey City, Ny-Nj-Pa | $1,149,825 | $1,472,250 | $1,779,525 | $2,211,600 |
| Hudson | 34017 | New York-Newark-Jersey City, Ny-Nj-Pa | $1,149,825 | $1,472,250 | $1,779,525 | $2,211,600 |
| Hunterdon | 34019 | New York-Newark-Jersey City, Ny-Nj-Pa | $1,149,825 | $1,472,250 | $1,779,525 | $2,211,600 |
| Middlesex | 34023 | New York-Newark-Jersey City, Ny-Nj-Pa | $1,149,825 | $1,472,250 | $1,779,525 | $2,211,600 |
| Monmouth | 34025 | New York-Newark-Jersey City, Ny-Nj-Pa | $1,149,825 | $1,472,250 | $1,779,525 | $2,211,600 |
| Morris | 34027 | New York-Newark-Jersey City, Ny-Nj-Pa | $1,149,825 | $1,472,250 | $1,779,525 | $2,211,600 |
| Ocean | 34029 | New York-Newark-Jersey City, Ny-Nj-Pa | $1,149,825 | $1,472,250 | $1,779,525 | $2,211,600 |
| Passaic | 34031 | New York-Newark-Jersey City, Ny-Nj-Pa | $1,149,825 | $1,472,250 | $1,779,525 | $2,211,600 |
| Somerset | 34035 | New York-Newark-Jersey City, Ny-Nj-Pa | $1,149,825 | $1,472,250 | $1,779,525 | $2,211,600 |
| Sussex | 34037 | New York-Newark-Jersey City, Ny-Nj-Pa | $1,149,825 | $1,472,250 | $1,779,525 | $2,211,600 |
| Union | 34039 | New York-Newark-Jersey City, Ny-Nj-Pa | $1,149,825 | $1,472,250 | $1,779,525 | $2,211,600 |
| County | 5-Digit County Code | Metropolitan Area | 1 Unit Limit | 2 Unit Limit | 3 Unit Limit | 4 Unit Limit |
|---|---|---|---|---|---|---|
| Bronx | 36005 | New York-Newark-Jersey City, Ny-Nj-Pa | $1,149,825 | $1,472,250 | $1,779,525 | $2,211,600 |
| Kings | 36047 | New York-Newark-Jersey City, Ny-Nj-Pa | $1,149,825 | $1,472,250 | $1,779,525 | $2,211,600 |
| Nassau | 36059 | New York-Newark-Jersey City, Ny-Nj-Pa | $1,149,825 | $1,472,250 | $1,779,525 | $2,211,600 |
| New York | 36061 | New York-Newark-Jersey City, Ny-Nj-Pa | $1,149,825 | $1,472,250 | $1,779,525 | $2,211,600 |
| Putnam | 36079 | New York-Newark-Jersey City, Ny-Nj-Pa | $1,149,825 | $1,472,250 | $1,779,525 | $2,211,600 |
| Queens | 36081 | New York-Newark-Jersey City, Ny-Nj-Pa | $1,149,825 | $1,472,250 | $1,779,525 | $2,211,600 |
| Richmond | 36085 | New York-Newark-Jersey City, Ny-Nj-Pa | $1,149,825 | $1,472,250 | $1,779,525 | $2,211,600 |
| Rockland | 36087 | New York-Newark-Jersey City, Ny-Nj-Pa | $1,149,825 | $1,472,250 | $1,779,525 | $2,211,600 |
| Suffolk | 36103 | New York-Newark-Jersey City, Ny-Nj-Pa | $1,149,825 | $1,472,250 | $1,779,525 | $2,211,600 |
| Westchester | 36119 | New York-Newark-Jersey City, Ny-Nj-Pa | $1,149,825 | $1,472,250 | $1,779,525 | $2,211,600 |
| County | 5-Digit County Code | Metropolitan Area | 1 Unit Limit | 2 Unit Limit | 3 Unit Limit | 4 Unit Limit |
|---|---|---|---|---|---|---|
| Pike | 42103 | New York-Newark-Jersey City, Ny-Nj-Pa | $1,149,825 | $1,472,250 | $1,779,525 | $2,211,600 |
| County | 5-Digit County Code | Metropolitan Area | 1 Unit Limit | 2 Unit Limit | 3 Unit Limit | 4 Unit Limit |
|---|---|---|---|---|---|---|
| Cannon | 47015 | Nashville-Davidson--Murfreesboro--Frank | $ 943,000 | $1,207,200 | $1,459,250 | $1,813,500 |
| Cheatham | 47021 | Nashville-Davidson--Murfreesboro--Frank | $ 943,000 | $1,207,200 | $1,459,250 | $1,813,500 |
| Davidson | 47037 | Nashville-Davidson--Murfreesboro--Frank | $ 943,000 | $1,207,200 | $1,459,250 | $1,813,500 |
| Dickson | 47043 | Nashville-Davidson--Murfreesboro--Frank | $ 943,000 | $1,207,200 | $1,459,250 | $1,813,500 |
| Macon | 47111 | Nashville-Davidson--Murfreesboro--Frank | $ 943,000 | $1,207,200 | $1,459,250 | $1,813,500 |
| Maury | 47119 | Nashville-Davidson--Murfreesboro--Frank | $ 943,000 | $1,207,200 | $1,459,250 | $1,813,500 |
| Robertson | 47147 | Nashville-Davidson--Murfreesboro--Frank | $ 943,000 | $1,207,200 | $1,459,250 | $1,813,500 |
| Rutherford | 47149 | Nashville-Davidson--Murfreesboro--Frank | $ 943,000 | $1,207,200 | $1,459,250 | $1,813,500 |
| Smith | 47159 | Nashville-Davidson--Murfreesboro--Frank | $ 943,000 | $1,207,200 | $1,459,250 | $1,813,500 |
| Sumner | 47165 | Nashville-Davidson--Murfreesboro--Frank | $ 943,000 | $1,207,200 | $1,459,250 | $1,813,500 |
| Trousdale | 47169 | Nashville-Davidson--Murfreesboro--Frank | $ 943,000 | $1,207,200 | $1,459,250 | $1,813,500 |
| Williamson | 47187 | Nashville-Davidson--Murfreesboro--Frank | $ 943,000 | $1,207,200 | $1,459,250 | $1,813,500 |
| Wilson | 47189 | Nashville-Davidson--Murfreesboro--Frank | $ 943,000 | $1,207,200 | $1,459,250 | $1,813,500 |
| County | 5-Digit County Code | Metropolitan Area | 1 Unit Limit | 2 Unit Limit | 3 Unit Limit | 4 Unit Limit |
|---|---|---|---|---|---|---|
| Summit | 49043 | Summit Park, Ut | $1,149,825 | $1,472,250 | $1,779,525 | $2,211,600 |
| Wasatch | 49051 | Salt Lake City, Ut | $1,149,825 | $1,472,250 | $1,779,525 | $2,211,600 |
| Wayne | 49055 | Non-Metro | $ 997,050 | $1,276,400 | $1,542,900 | $1,917,450 |
| County | 5-Digit County Code | Metropolitan Area | 1 Unit Limit | 2 Unit Limit | 3 Unit Limit | 4 Unit Limit |
|---|---|---|---|---|---|---|
| Arlington | 51013 | Washington-Arlington-Alexandria, Dc-Va- | $1,149,825 | $1,472,250 | $1,779,525 | $2,211,600 |
| Clarke | 51043 | Washington-Arlington-Alexandria, Dc-Va- | $1,149,825 | $1,472,250 | $1,779,525 | $2,211,600 |
| Culpeper | 51047 | Washington-Arlington-Alexandria, Dc-Va- | $1,149,825 | $1,472,250 | $1,779,525 | $2,211,600 |
| Fairfax | 51059 | Washington-Arlington-Alexandria, Dc-Va- | $1,149,825 | $1,472,250 | $1,779,525 | $2,211,600 |
| Fauquier | 51061 | Washington-Arlington-Alexandria, Dc-Va- | $1,149,825 | $1,472,250 | $1,779,525 | $2,211,600 |
| Loudoun | 51107 | Washington-Arlington-Alexandria, Dc-Va- | $1,149,825 | $1,472,250 | $1,779,525 | $2,211,600 |
| Madison | 51113 | Non-Metro | $1,149,825 | $1,472,250 | $1,779,525 | $2,211,600 |
| Prince William | 51153 | Washington-Arlington-Alexandria, Dc-Va- | $1,149,825 | $1,472,250 | $1,779,525 | $2,211,600 |
| Rappahannock | 51157 | Washington-Arlington-Alexandria, Dc-Va- | $1,149,825 | $1,472,250 | $1,779,525 | $2,211,600 |
| Spotsylvania | 51177 | Washington-Arlington-Alexandria, Dc-Va- | $1,149,825 | $1,472,250 | $1,779,525 | $2,211,600 |
| Stafford | 51179 | Washington-Arlington-Alexandria, Dc-Va- | $1,149,825 | $1,472,250 | $1,779,525 | $2,211,600 |
| Warren | 51187 | Washington-Arlington-Alexandria, Dc-Va- | $1,149,825 | $1,472,250 | $1,779,525 | $2,211,600 |
| Alexandria City | 51510 | Washington-Arlington-Alexandria, Dc-Va- | $1,149,825 | $1,472,250 | $1,779,525 | $2,211,600 |
| Fairfax City | 51600 | Washington-Arlington-Alexandria, Dc-Va- | $1,149,825 | $1,472,250 | $1,779,525 | $2,211,600 |
| Falls Church City | 51610 | Washington-Arlington-Alexandria, Dc-Va- | $1,149,825 | $1,472,250 | $1,779,525 | $2,211,600 |
| Fredericksburg City | 51630 | Washington-Arlington-Alexandria, Dc-Va- | $1,149,825 | $1,472,250 | $1,779,525 | $2,211,600 |
| Manassas City | 51683 | Washington-Arlington-Alexandria, Dc-Va- | $1,149,825 | $1,472,250 | $1,779,525 | $2,211,600 |
| Manassas Park City | 51685 | Washington-Arlington-Alexandria, Dc-Va- | $1,149,825 | $1,472,250 | $1,779,525 | $2,211,600 |
| County | 5-Digit County Code | Metropolitan Area | 1 Unit Limit | 2 Unit Limit | 3 Unit Limit | 4 Unit Limit |
|---|---|---|---|---|---|---|
| King | 53033 | Seattle-Tacoma-Bellevue, Wa | $977,500 | $1,251,400 | $1,512,650 | $1,879,850 |
| Pierce | 53053 | Seattle-Tacoma-Bellevue, Wa | $977,500 | $1,251,400 | $1,512,650 | $1,879,850 |
| Snohomish | 53061 | Seattle-Tacoma-Bellevue, Wa | $977,500 | $1,251,400 | $1,512,650 | $1,879,850 |
| County | 5-Digit County Code | Metropolitan Area | 1 Unit Limit | 2 Unit Limit | 3 Unit Limit | 4 Unit Limit |
|---|---|---|---|---|---|---|
| Jefferson | 54037 | Washington-Arlington-Alexandria, Dc-Va- | $1,149,825 | $1,472,250 | $1,779,525 | $2,211,600 |
| County | 5-Digit County Code | Metropolitan Area | 1 Unit Limit | 2 Unit Limit | 3 Unit Limit | 4 Unit Limit |
|---|---|---|---|---|---|---|
| Teton | 56039 | Jackson, Wy-Id | $1,149,825 | $1,472,250 | $1,779,525 | $2,211,600 |
| 5-Digit County Code | 1 Unit Limit | 2 Unit Limit | 3 Unit Limit | 4 Unit Limit |
|---|---|---|---|---|
| 66010 | $1,149,825 | $1,472,250 | $1,779,525 | $2,211,600 |
| Island | 5-Digit County Code | 1 Unit Limit | 2 Unit Limit | 3 Unit Limit | 4 Unit Limit |
|---|---|---|---|---|---|
| St. Croix | 78010 | $1,149,825 | $1,472,250 | $1,779,525 | $2,211,600 |
| St. John | 78020 | $1,149,825 | $1,472,250 | $1,779,525 | $2,211,600 |
| St. Thomas | 78030 | $1,149,825 | $1,472,250 | $1,779,525 | $2,211,600 |
The default baseline conforming limits apply to all other counties in all states, along with Puerto Rico and the islands which make up the Northern Mariana Islands (Northern Island, Saipan & Tinian).
Use either of the following calculators to estimate your fixed or ARM jumbo loan payments. For people interested only in the principal & interest portion of the loan, we also offer a side-by-side calculator here which calculates fixed, ARM & IO-only loans.
Below is our FRM jumbo mortgage calculator. Click on the other tab above to switch to the jumbo ARM calculator. You can also view current local jumbo loan rates.
The Federal Funds rate sets a baseline which is used to help guide other rates across the economy. For any given loan type the yield typically rises as either loan amount or duration rise. While most mortgages are amortized over 30-years, they tend to move inline with the 10-year treasury, as homeowners tend to move or refinace their home loans every 5 to 7 years. Lenders price mortgages above the soverign 10 year bond because they presume the 10-year treasury does not carry any default risk.
Most people tend to choose fixed rate mortgages, however jumbo loans are available in both fixed and adjustable versions. Looking at the above chart it is clear rates are near historical lows, so those in need of stability who are looking to build equity in their home will likely want to choose fixed rates. Those who have high income levels may be more interested in deducting mortgage interest from their income taxes. Presuming they know the financial markets well & want the tax write off then a floating variable rate may make sense.

When people describe the "American Dream," it often includes a variety of things: education, good health, a happy family, money in the bank, and so on. For most people, this vision of the "American Dream" also involves having a place to come home to. Home ownership is sought by those who lack it, and fiercely protected by those who fear losing it. There is something comforting about being able to call a house your own.
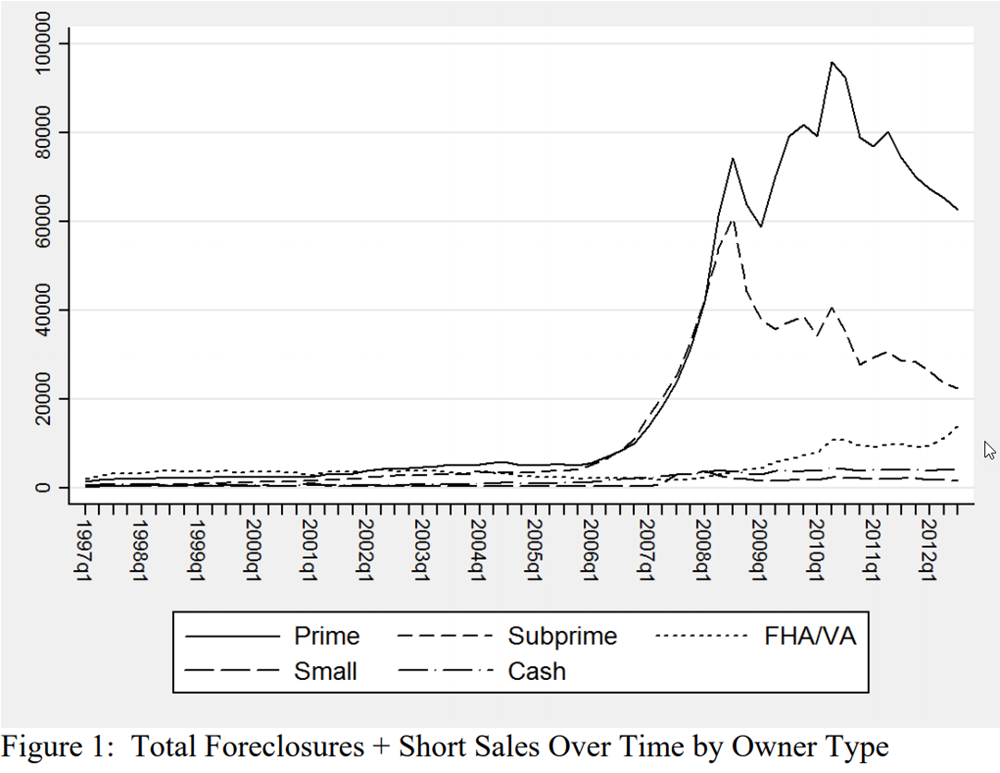
Of course, these days it is rare that the house truly belongs to the homeowner. In the current housing market, obtaining a mortgage is typically a necessity in order to purchase a home. Few people are able to afford the cost of buying a home without financing. When a mortgage is taken out the homeowenr has effectively used his or her new home as a security backing the loan. As such, when a borrower is unable to make mortgage payments, the result is often foreclosure.
Prior to the recession about 252,000 homes were foreclosed annually. Between September 2008 and September 2012 about 3.9 million homes were foreclosed on - a rate nearly four times as high as the prevailing rate before the recession hit. Roughly twice as many prime borrowers lost their homes as did subprime borrowers.
While loan delinquency rates have declined, many homeowners still have limited equity. Costal people in wealthy areas who were surprised by & could not understand the outcome of the 2016 presidential election need only look at how many homes across the midwest & Florida still qualified for HARP loan modification in 2016.

Those are homeowners who have conventional mortgages which were originated before June 1, 2009 & have less than 20% equity in their home.
The goals of the Federal Reserve's zero interest-rate policy (ZIRP) and quantitative easing (QE) programs after the 2007 economic crisis were to:
A decade after the crash housing prices have returned to the pre-crash peaks, but not when adjusted for inflation. A recovery driven by asset price inflation has drastically increased inequality. In wealthy areas like San Franciso the tech rebound was also boosted by hot money leaving China. This in turn led to many vital workers being pushed into long commutes to work. When China cracked down on capital flight, it left some neighborhoods in Los Angeles suburbs looking like ghost towns. In spite of the incredible absolute wealth in California the high cost of living means it has the highest poverty rate in the country.
While people who are priced out of hot areas, some of the cold areas have remained exceptionally cold nearly a decade after the crisis. According to the Financial Times the recovery has simply passed by many Americans.
More than 50m Americans live in districts that are mired in a “deep ongoing recession”, with falling employment and a shrinking business base, according to a report that highlights the fractured nature of the US recovery.
…
The problems in distressed communities have not developed overnight: most have seen zero net gains in employment and business creation over the whole of this century so far."
Increasing inequality - rather than an increase in poverty - often leads to a rise in crime. Areas with an elevated GINI coefficient see higher violent crime & this is one of the most robust relationships in the social sciences.
Citigroup ran the Obama cabinet & ensured their own bailout, while the costs of their shady loan practices were passed onto the rest of society.
"So what did they actually do. Well, first they didn't fix the problems, they made it worse, so that by 2007, when Bowen and Hunt are looking again, the rate at which Citi is lying to Fannie and Freddie is up to 80%. And the next thing, of course, that Rubin was sure that Citicorp was doing the right thing, is both Bowen and Hunt were retaliated against.
…
Citi, instead of top executives, instead of being grateful, a), of course, goosed their executive compensation. But b) decided hey, let's target FHA, now that Fannie and Freddie are out of it, for our frauds." - Bill Black
Now even Citi is warning against rising income inequality.
The Federal Reserve lowered rates and pushed QE to drive asset prices higher and cause a wealth effect. As the Federal Reserve lifts interest rates and winds down their balance sheet it should have the opposite effect on the market as the cost of debt goes up. If they can thread the needle this will mean fairly stagnant asset prices. If they get too far out in front of the market it could cause asset prices - including real estate - to drop.
Here is a map which shows how real housing prices have changed between
While the past does not predict the future, seeing how homes have performed across various points in the economic cycle can help you get an idea of how real estate might perform while the boom continues & when a recession inevitably occurs.

You can zoom in on the above map to view your local area here. The FHFA also offers an experimental home price index map with data going back to 1975 here. Since the early 1980s interest rates have been in a secular downturn & global debt levels have exploded. Asset price trends may change if rising interest rates cause debt to grow at a slower rate.

Expert economists predicted the economy would rebound in 2010. However, the economy was sluggish with slow growth rates for many years beyond that. The economy contracted in the first quarter of 2014, but in the second half of 2014 economic growth picked up. The Federal Reserve tapered their quantitative easing asset purchase program & the price of oil fell sharply. Consumer perception of inflation and inflation expectations are set largely by the price they pay at the pump when they refill their gas.
Two year Treasury yield keeps marching higher. Today cleared pivot dating back years. Coast seems clear for rise to continue significantly.
— Jeffrey Gundlach (@TruthGundlach) September 28, 2017
With growth picking up the consensus view is interest rates will continue to head higher for the next couple years into 2020, or until a recession happens. The following table highlights 2018 rate predictions from influential organizations in the real estate & mortgage markets.
| Organization | Q1 | Q2 | Q3 | Q4 | Average |
|---|---|---|---|---|---|
| Mortgage Banker's Association | 4.3% | 4.6% | 4.7% | 4.8% | 4.6% |
| Fannie Mae | 4.0% | 4.1% | 4.1% | 4.2% | 4.1% |
| Freddie Mac | 4.1% | 4.3% | 4.4% | 4.6% | 4.35% |
| National Association of Realtors | 4.2% | 4.5% | 4.5% | ||
| National Association of Home Builders | 4.2% | ||||
| Zillow survey | 4.5% | ||||
| CoreLogic | 4.6% |
Table sources: MBA, Fannie Mae, Freddie Mac, NAR, NAHB, CoreLogic
| Organization | Q1 | Q2 | Q3 | Q4 | Average |
|---|---|---|---|---|---|
| Mortgage Banker's Association | 4.9% | 4.9% | 5.0% | 5.1% | 4.95% |
| Fannie Mae | 4.2% | 4.2% | 4.3% | 4.3% | 4.25% |
| National Association of Home Builders | 4.67% |
The Federal Reserve has started to taper their bond buying program. Lock in today's low rates and save on your loan.
Are you paying too much for your mortgage?
Check your refinance options with a trusted Cambridge lender.
Answer a few questions below and connect with a lender who can help you refinance and save today!