
The following table shows current El Monte 30-year mortgage refinance rates. You can use the menus to select other loan durations, alter the loan amount, set your home value, select purchase loans, or change your location.
Interest rates are typically determined by a central bank in most countries. In the United States, a forum is held once per month for eight months out of the year to determine interest rates. At this time, the economic status of the country is assessed, and interest rates are adjusted according to the needs of the country. The panel that determines interest rates consists of representatives of the Federal Reserve Board and the Federal Reserve Bank. Together, the representatives from both form the Federal Open Market Committee.
The Federal Reserve monitors and sets standards for monetary policy in the United States. There are 12 Federal Reserve Banks located in major cities around the country. Although the Federal Reserve undergoes reviews by Congress, the organization is an independent entity. Therefore, they do not need the President’s approval or any other branch of government before making decisions about the economy.
There are seven members of the board. Each member is appointed by the President to the Board of Governors and serves 14 years. They can be reelected. The board is headed by a President and Vice President. Each can hold office for 4 years and can be reappointed by the Senate. Janet Yellen currently serves this role and is the successor to Ben Bernake. Alan Greenspan held the position prior to him.
The Federal Reserve monitors and generates income from several entities. They earn dividends on foreign currency, loan interest collected, services, and interest from government securities. If the Federal Reserve posts a profit above and beyond its operating costs, then those funds are redirected to the U.S. Treasury.
The goal of each monthly meeting is to determine the liquidity of funds within the country and establish prices that will keep the economy stable. If the circulation of money within the country is abundant, the prices will increase. If the circulation of money within the country is minimal, the prices will decrease. The goal is to find a balance that will keep the economy stable and full employment. It is generally easier for central banks of core economies to fight inflation rather than deflation, so they typically target a moderate postive rate of consumer price inflation around 2%.
The central bank lends money to retail banks at a discount interest rate. The consumer in turn borrows from the retail banks. The interest rates or Prime Interest Rates are determined by the rates assigned by the central bank to the retail bank. The central bank will raise interest rates when they want to discourage consumer borrowing and encourage more deposits. The deposits contribute to the overall worth of the bank. When the consumer deposits money, the bank can lend this money to another party to generate income from interest collected. The central bank will lower interest rates when they want to encourage consumer borrowing and increase spending.
Typically the Federal Reserve sets short term interest rates and longer dated Treasury bonds trade at a premium to those rates to reflect the duration and inflation risks. The 30-year mortgage typically trades at a slight premium above the 10-year treasury. The reason the longer duration mortgage rates are based on the shorter duration trasury rate is most homeowners tend to move or refinance roughly every 5 to 7 years.

Expert economists predicted the economy would rebound in 2010. However, the economy was sluggish with slow growth rates for many years beyond that. The economy contracted in the first quarter of 2014, but in the second half of 2014 economic growth picked up. The Federal Reserve tapered their quantitative easing asset purchase program & the price of oil fell sharply. Consumer perception of inflation and inflation expectations are set largely by the price they pay at the pump when they refill their gas. With growth picking up the consensus view is interest rates will continue to head higher for the next couple years into 2020, or until a recession happens. The following table highlights 2019 rate predictions from influential organizations in the real estate & mortgage markets.
| Organization | Analyst | Rate prediction |
|---|---|---|
| Mortgage Banker's Association | Mike Fratantoni | 5.1% |
| Fannie Mae | Doug Duncan | 4.8% |
| Freddie Mac | Sam Khater | 5.1% |
| Realtor.com | Danielle Hale | 5.3% |
| Moody's Analytics | Mark Zandi | 5.0% |
| Wells Fargo | Sam Bullard | 4.9% |
| Carrington Mortgage | Rick Sharga | 5.25% |
| CoreLogic | Frank Nothaft | 5.25% |
| National Association of Home Builders | 4.81% | |
| Zillow | 5.8% |
Table sources: MBA, Fannie Mae, Freddie Mac, NAR, NAHB, CoreLogic
The NAHB saw 30-year fixed rates rising to 5.08% in 2020, when they anticipated ARMs to jump from 2019 estimates of 4.46% to 4.63%.
Despite being old data, the above predictions remain published on this page to show how significantly off major industry associations and leading experts at companies worth billions of dollars can be even in relatively benign environments. The average rate predicted for 2019 was 5.13% while the actual average rate throughout the year was 3.94%.
Industry experts can be that far off in relatively benign conditions. A true crisis can make accurate predictions nearly impossible.
As the COVID-19 healthcare crisis swept the globe governments pushed lockdowns which contracted many economies at record rates. In the second quarter of 2020 the United States economy contracted at a record annualized rate of 31.4%.
As the global economy crashed the Federal Reserve's FOMC cut interest rates twice, announced they would conduct unlimited quantitative easing, and gave forward guidance suggesting they were unlikely to lift rates through 2023.
As the Federal Reserve bought Treasury bonds and mortgage-backed securities while the economy cooled mortgage rates fell to new record lows. On the week of November 5th, the average 30-year fixed-rate fell to 2.78%. 2020 is expected to be a record year for mortgage originations with Fannie Mae predicting $4.1 trillion in originations and refinance loans contributing $2.7 to the total.
Most consumers obtaining mortgages to purchase a home opt for the 30-year fixed-rate mortgage. It completely dominates the purchase market.
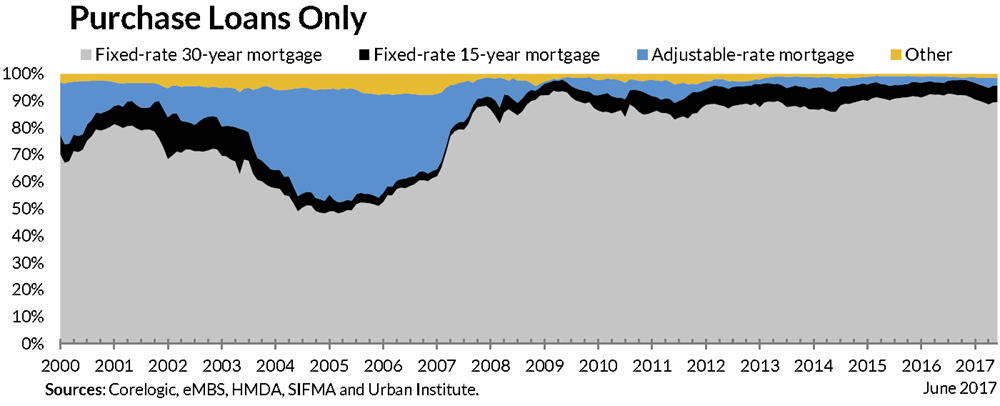
If one looks exclusively at purchases FRMs are about 90% of the market. 30-year loans are also a popular choice for refinancing homeowners, though the 15-year option is also popular with people refinancing their loans. The following chart shows the blended overall market condition, but if you can compare it against the above chart you can visualize how 15-year loans are much more popular for refinancing than for initial home purchases.
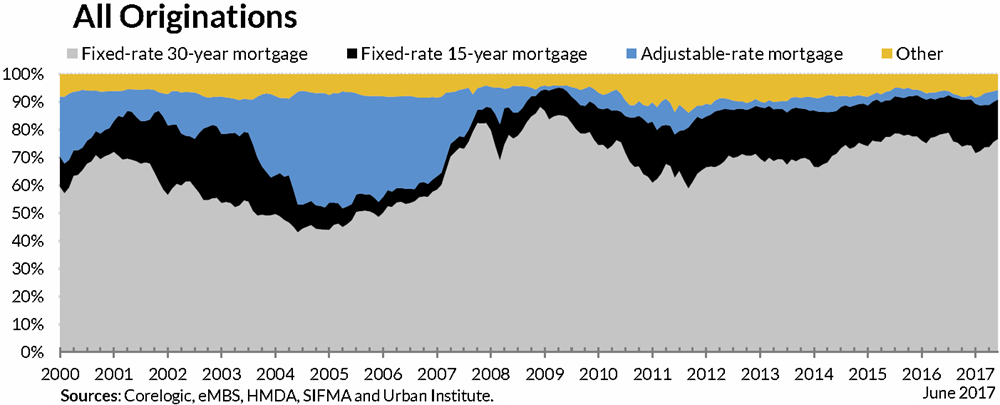
Source: Urban Institute
| Year | Purchase | Refinance |
|---|---|---|
| 2016 | 52 % | 48% |
| 2017 | 67 % | 33% |
| 2018 | 75 % | 25% |
In 2017 there were about $600 billion in mortgage refinance loans & $1.09 trillion in purchase mortgages, so purchases were nearly 2/3 of the market while refis were slightly more than 1/3 of the market. As rates are expected to keep rising, refinance is expected to make up a smaller share of the overall market.
The amount of new loans to refinance a home was expected to drop to $430 billion, down 28.3 percent from 2017, while the amount of new mortgages to buy a home will likely increase by 7.3 percent to $1.2 trillion, MBA said.
As of April 1, 2020 the United States has a population of 331,449,281 (or 334,735,155 including Puerto Rico). The US gains a person every 19 seconds and is estimated to have a population of 336,378,112 on May 2, 2024.
The following table highlights the April 1, 2020 populations of states & territories based on United States Census Bureau estimates.
All table columns are sortable. Click on the column headers to sort by that column. Click again to sort low to high. States with higher levels of population growth typically see the increased real estate demand drive faster real estate price appreciation.
| Rank | State | 2020 Population | 2010 Population | Change | % △ |
|---|---|---|---|---|---|
| United States | 331,449,281 | 308,745,538 | 22,703,743 | 7.35% | |
| 1 | California | 39,538,223 | 37,253,956 | 2,284,267 | 6.13% |
| 2 | Texas | 29,145,505 | 25,145,561 | 3,999,944 | 15.91% |
| 3 | Florida | 21,538,187 | 18,801,310 | 2,736,877 | 14.56% |
| 4 | New York | 20,201,249 | 19,378,102 | 823,147 | 4.25% |
| 5 | Pennsylvania | 13,002,700 | 12,702,379 | 300,321 | 2.36% |
| 6 | Illinois | 12,812,508 | 12,830,632 | -18,124 | -0.14% |
| 7 | Ohio | 11,799,448 | 11,536,504 | 262,944 | 2.28% |
| 8 | Georgia | 10,711,908 | 9,687,653 | 1,024,255 | 10.57% |
| 9 | North Carolina | 10,439,388 | 9,535,483 | 903,905 | 9.48% |
| 10 | Michigan | 10,077,331 | 9,883,640 | 193,691 | 1.96% |
| 11 | New Jersey | 9,288,994 | 8,791,894 | 497,100 | 5.65% |
| 12 | Virginia | 8,631,393 | 8,001,024 | 630,369 | 7.88% |
| 13 | Washington | 7,705,281 | 6,724,540 | 980,741 | 14.58% |
| 14 | Arizona | 7,151,502 | 6,392,017 | 759,485 | 11.88% |
| 15 | Massachusetts | 7,029,917 | 6,547,629 | 482,288 | 7.37% |
| 16 | Tennessee | 6,910,840 | 6,346,105 | 564,735 | 8.90% |
| 17 | Indiana | 6,785,528 | 6,483,802 | 301,726 | 4.65% |
| 18 | Maryland | 6,177,224 | 5,773,552 | 403,672 | 6.99% |
| 19 | Missouri | 6,154,913 | 5,988,927 | 165,986 | 2.77% |
| 20 | Wisconsin | 5,893,718 | 5,686,986 | 206,732 | 3.64% |
| 21 | Colorado | 5,773,714 | 5,029,196 | 744,518 | 14.80% |
| 22 | Minnesota | 5,706,494 | 5,303,925 | 402,569 | 7.59% |
| 23 | South Carolina | 5,118,425 | 4,625,364 | 493,061 | 10.66% |
| 24 | Alabama | 5,024,279 | 4,779,736 | 244,543 | 5.12% |
| 25 | Louisiana | 4,657,757 | 4,533,372 | 124,385 | 2.74% |
| 26 | Kentucky | 4,505,836 | 4,339,367 | 166,469 | 3.84% |
| 27 | Oregon | 4,237,256 | 3,831,074 | 406,182 | 10.60% |
| 28 | Oklahoma | 3,959,353 | 3,751,351 | 208,002 | 5.54% |
| 29 | Connecticut | 3,605,944 | 3,574,097 | 31,847 | 0.89% |
| — | Puerto Rico | 3,285,874 | 3,725,789 | -439,915 | -11.81% |
| 30 | Utah | 3,271,616 | 2,763,885 | 507,731 | 18.37% |
| 31 | Iowa | 3,190,369 | 3,046,355 | 144,014 | 4.73% |
| 32 | Nevada | 3,104,614 | 2,700,551 | 404,063 | 14.96% |
| 33 | Arkansas | 3,011,524 | 2,915,918 | 95,606 | 3.28% |
| 34 | Mississippi | 2,961,279 | 2,967,297 | -6,018 | -0.20% |
| 35 | Kansas | 2,937,880 | 2,853,118 | 84,762 | 2.97% |
| 36 | New Mexico | 2,117,522 | 2,059,179 | 58,343 | 2.83% |
| 37 | Nebraska | 1,961,504 | 1,826,341 | 135,163 | 7.40% |
| 38 | Idaho | 1,839,106 | 1,567,582 | 271,524 | 17.32% |
| 39 | West Virginia | 1,793,716 | 1,852,994 | -59,278 | -3.20% |
| 40 | Hawaii | 1,455,271 | 1,360,301 | 94,970 | 6.98% |
| 41 | New Hampshire | 1,377,529 | 1,316,470 | 61,059 | 4.64% |
| 42 | Maine | 1,362,359 | 1,328,361 | 33,998 | 2.56% |
| 43 | Rhode Island | 1,097,379 | 1,052,567 | 44,812 | 4.26% |
| 44 | Montana | 1,084,225 | 989,415 | 94,810 | 9.58% |
| 45 | Delaware | 989,948 | 897,934 | 92,014 | 10.25% |
| 46 | South Dakota | 886,667 | 814,180 | 72,487 | 8.90% |
| 47 | North Dakota | 779,094 | 672,591 | 106,503 | 15.83% |
| 48 | Alaska | 733,391 | 710,231 | 23,160 | 3.26% |
| — | District of Columbia | 689,545 | 601,723 | 87,822 | 14.60% |
| 49 | Vermont | 643,077 | 625,741 | 17,336 | 2.77% |
| 50 | Wyoming | 576,851 | 563,626 | 13,225 | 2.35% |
| US w Puerto Rico | 334,735,155 | 312,471,327 | 22,263,828 | 7.13% |
2020 Census Data Products Apportionment
Source: U.S. Census Bureau, Population Division
Release Date: April 26, 2021.
There are over 300 cities across the United States which have at least 100,000 residents.
| Population | Cities |
|---|---|
| 1,000,000+ | 10 |
| 300,000–999,999 | 54 |
| 200,000–299,999 | 51 |
| 100,000–199,999 | 192 |
| Total | 307 |
Over 40% of these cities are located in just 3 states: California, Texas & Florida.
| State | Large Cities |
|---|---|
| CA | 73 |
| TX | 38 |
| FL | 22 |
| CO | 12 |
| AZ | 10 |
| NC | 9 |
| IL, WA | 8 |
| GA, MI, NJ, VA | 7 |
| OH, TN | 6 |
| CT, KS, MA, MO, NY, OR | 5 |
| AL, IN, LA, NV, OK, UT | 4 |
| IA, MN, PA, SC, WI | 3 |
| KY, NE, NM | 2 |
| AK, AR, DC, HI, ID, MD, MS, MT, ND, NH, RI, SD | 1 |
| DE, ME, VT, WV, WY | 0 |
Typically during economic expansions real estate prices increase faster in large cities than they do in rural areas. Here is a table of cities & Census Designated Places across the United States with a population above 100,000.
| Rank | City | State | 2016 Pop | 2010 Pop | Change | % △ | Land | Pop Density |
|---|---|---|---|---|---|---|---|---|
| 1 | New York | New York | 8,537,673 | 8,175,133 | 362,540 | 4.43% | 301.5 mi² | 28,317/mi² |
| 2 | Los Angeles | California | 3,976,322 | 3,792,621 | 183,701 | 4.84% | 468.7 mi² | 8,484/mi² |
| 3 | Chicago | Illinois | 2,704,958 | 2,695,598 | 9,360 | 0.35% | 227.3 mi² | 11,900/mi² |
| 4 | Houston | Texas | 2,303,482 | 2,100,263 | 203,219 | 9.68% | 637.5 mi² | 3,613/mi² |
| 5 | Phoenix | Arizona | 1,615,017 | 1,445,632 | 169,385 | 11.72% | 517.6 mi² | 3,120/mi² |
| 6 | Philadelphia | Pennsylvania | 1,567,872 | 1,526,006 | 41,866 | 2.74% | 134.2 mi² | 11,683/mi² |
| 7 | San Antonio | Texas | 1,492,510 | 1,327,407 | 165,103 | 12.44% | 461.0 mi² | 3,238/mi² |
| 8 | San Diego | California | 1,406,630 | 1,307,402 | 99,228 | 7.59% | 325.2 mi² | 4,325/mi² |
| 9 | Dallas | Texas | 1,317,929 | 1,197,816 | 120,113 | 10.03% | 340.9 mi² | 3,866/mi² |
| 10 | San Jose | California | 1,025,350 | 945,942 | 79,408 | 8.39% | 177.5 mi² | 5,777/mi² |
| 11 | Austin | Texas | 947,890 | 790,390 | 157,500 | 19.93% | 312.7 mi² | 3,031/mi² |
| 12 | Jacksonville | Florida | 880,619 | 821,784 | 58,835 | 7.16% | 747.4 mi² | 1,178/mi² |
| 13 | San Francisco | California | 870,887 | 805,235 | 65,652 | 8.15% | 46.9 mi² | 18,569/mi² |
| 14 | Columbus | Ohio | 860,090 | 787,033 | 73,057 | 9.28% | 218.5 mi² | 3,936/mi² |
| 15 | Indianapolis | Indiana | 855,164 | 820,445 | 34,719 | 4.23% | 361.5 mi² | 2,366/mi² |
| 16 | Fort Worth | Texas | 854,113 | 741,206 | 112,907 | 15.23% | 342.9 mi² | 2,491/mi² |
| 17 | Charlotte | North Carolina | 842,051 | 731,424 | 110,627 | 15.12% | 305.4 mi² | 2,757/mi² |
| 18 | Seattle | Washington | 704,352 | 608,660 | 95,692 | 15.72% | 83.8 mi² | 8,405/mi² |
| 19 | Denver | Colorado | 693,060 | 600,158 | 92,902 | 15.48% | 153.3 mi² | 4,521/mi² |
| 20 | El Paso | Texas | 683,080 | 649,121 | 33,959 | 5.23% | 256.8 mi² | 2,660/mi² |
| 21 | Washington | District of Columbia | 681,170 | 601,723 | 79,447 | 13.20% | 61.1 mi² | 11,148/mi² |
| 22 | Boston | Massachusetts | 673,184 | 617,594 | 55,590 | 9.00% | 48.3 mi² | 13,938/mi² |
| 23 | Detroit | Michigan | 672,795 | 713,777 | -40,982 | -5.74% | 138.8 mi² | 4,847/mi² |
| 24 | Nashville | Tennessee | 660,388 | 601,222 | 59,166 | 9.84% | 475.9 mi² | 1,388/mi² |
| 25 | Memphis | Tennessee | 652,717 | 646,889 | 5,828 | 0.90% | 317.4 mi² | 2,056/mi² |
| 26 | Portland | Oregon | 639,863 | 583,776 | 56,087 | 9.61% | 133.5 mi² | 4,793/mi² |
| 27 | Oklahoma City | Oklahoma | 638,367 | 579,999 | 58,368 | 10.06% | 606.3 mi² | 1,053/mi² |
| 28 | Las Vegas | Nevada | 632,912 | 583,756 | 49,156 | 8.42% | 134.4 mi² | 4,709/mi² |
| 29 | Louisville | Kentucky | 616,261 | 597,337 | 18,924 | 3.17% | 263.5 mi² | 2,339/mi² |
| 30 | Baltimore | Maryland | 614,664 | 620,961 | -6,297 | 1.01% | 80.9 mi² | 7,598/mi² |
| 31 | Milwaukee | Wisconsin | 595,047 | 594,833 | 214 | 0.04% | 96.2 mi² | 6,186/mi² |
| 32 | Albuquerque | New Mexico | 559,277 | 545,852 | 13,425 | 2.46% | 188.2 mi² | 2,972/mi² |
| 33 | Tucson | Arizona | 530,706 | 520,116 | 10,590 | 2.04% | 230.8 mi² | 2,299/mi² |
| 34 | Fresno | California | 522,053 | 494,665 | 27,388 | 5.54% | 114.4 mi² | 4,563/mi² |
| 35 | Sacramento | California | 495,234 | 466,488 | 28,746 | 6.16% | 97.9 mi² | 5,059/mi² |
| 36 | Mesa | Arizona | 484,587 | 439,041 | 45,546 | 10.37% | 137.9 mi² | 3,514/mi² |
| 37 | Kansas City | Missouri | 481,420 | 459,787 | 21,633 | 4.71% | 315.0 mi² | 1,528/mi² |
| 38 | Atlanta | Georgia | 472,522 | 420,003 | 52,519 | 12.50% | 133.5 mi² | 3,539/mi² |
| 39 | Long Beach | California | 470,130 | 462,257 | 7,873 | 1.70% | 50.3 mi² | 9,347/mi² |
| 40 | Colorado Springs | Colorado | 465,101 | 416,427 | 48,674 | 11.69% | 195.6 mi² | 2,378/mi² |
| 41 | Raleigh | North Carolina | 458,880 | 403,892 | 54,988 | 13.61% | 145.1 mi² | 3,163/mi² |
| 42 | Miami | Florida | 453,579 | 399,457 | 54,122 | 13.55% | 36.0 mi² | 12,599/mi² |
| 43 | Virginia Beach | Virginia | 452,602 | 437,994 | 14,608 | 3.34% | 244.7 mi² | 1,850/mi² |
| 44 | Omaha | Nebraska | 446,970 | 408,958 | 38,012 | 9.29% | 133.2 mi² | 3,356/mi² |
| 45 | Oakland | California | 420,005 | 390,724 | 29,281 | 7.49% | 55.9 mi² | 7,514/mi² |
| 46 | Minneapolis | Minnesota | 413,651 | 382,578 | 31,073 | 8.12% | 54.0 mi² | 7,660/mi² |
| 47 | Tulsa | Oklahoma | 403,090 | 391,906 | 11,184 | 2.85% | 196.8 mi² | 2,048/mi² |
| 48 | Arlington | Texas | 392,772 | 365,438 | 27,334 | 7.48% | 95.8 mi² | 4,100/mi² |
| 49 | New Orleans | Louisiana | 391,495 | 343,829 | 47,666 | 13.86% | 169.4 mi² | 2,311/mi² |
| 50 | Wichita | Kansas | 389,902 | 382,368 | 7,534 | 1.97% | 160.4 mi² | 2,431/mi² |
| 51 | Cleveland | Ohio | 385,809 | 396,815 | -11,006 | -2.77% | 77.7 mi² | 4,965/mi² |
| 52 | Tampa | Florida | 377,165 | 335,709 | 41,456 | 12.35% | 113.4 mi² | 3,326/mi² |
| 53 | Bakersfield | California | 376,380 | 347,483 | 28,897 | 8.32% | 148.8 mi² | 2,529/mi² |
| 54 | Aurora | Colorado | 361,710 | 325,078 | 36,632 | 11.27% | 153.5 mi² | 2,356/mi² |
| 55 | Honolulu | Hawaii | 351,792 | 337,256 | 14,536 | 4.31% | 60.5 mi² | 5,815/mi² |
| 56 | Anaheim | California | 351,043 | 336,265 | 14,778 | 4.39% | 50.0 mi² | 7,021/mi² |
| 57 | Santa Ana | California | 334,217 | 324,528 | 9,689 | 2.99% | 27.1 mi² | 12,333/mi² |
| 58 | Corpus Christi | Texas | 325,733 | 305,215 | 20,518 | 6.72% | 174.6 mi² | 1,866/mi² |
| 59 | Riverside | California | 324,722 | 303,871 | 20,851 | 6.86% | 81.2 mi² | 3,999/mi² |
| 60 | Lexington | Kentucky | 318,449 | 295,803 | 22,646 | 7.66% | 283.6 mi² | 1,123/mi² |
| 61 | St. Louis | Missouri | 311,404 | 319,294 | -7,890 | -2.47% | 62.0 mi² | 5,023/mi² |
| 62 | Stockton | California | 307,072 | 291,707 | 15,365 | 5.27% | 61.7 mi² | 4,977/mi² |
| 63 | Pittsburgh | Pennsylvania | 303,625 | 305,704 | -2,079 | -0.68% | 55.4 mi² | 5,481/mi² |
| 64 | Saint Paul | Minnesota | 302,398 | 285,068 | 17,330 | 6.08% | 52.0 mi² | 5,815/mi² |
| 65 | Cincinnati | Ohio | 298,800 | 296,943 | 1,857 | 0.63% | 77.4 mi² | 3,860/mi² |
| 66 | Anchorage | Alaska | 298,192 | 291,826 | 6,366 | 2.18% | 1,706.6 mi² | 175/mi² |
| 67 | Henderson | Nevada | 292,969 | 257,729 | 35,240 | 13.67% | 104.7 mi² | 2,798/mi² |
| 68 | Greensboro | North Carolina | 287,027 | 269,666 | 17,361 | 6.44% | 128.3 mi² | 2,237/mi² |
| 69 | Plano | Texas | 286,057 | 259,841 | 26,216 | 10.09% | 71.7 mi² | 3,990/mi² |
| 70 | Newark | New Jersey | 281,764 | 277,140 | 4,624 | 1.67% | 24.1 mi² | 11,691/mi² |
| 71 | Lincoln | Nebraska | 280,364 | 258,379 | 21,985 | 8.51% | 92.1 mi² | 3,044/mi² |
| 72 | Toledo | Ohio | 278,508 | 287,208 | -8,700 | -3.03% | 80.7 mi² | 3,451/mi² |
| 73 | Orlando | Florida | 277,173 | 238,300 | 38,873 | 16.31% | 105.2 mi² | 2,635/mi² |
| 74 | Chula Vista | California | 267,172 | 243,916 | 23,256 | 9.53% | 49.6 mi² | 5,387/mi² |
| 75 | Irvine | California | 266,122 | 212,375 | 53,747 | 25.31% | 65.6 mi² | 4,057/mi² |
| 76 | Fort Wayne | Indiana | 264,488 | 253,691 | 10,797 | 4.26% | 110.6 mi² | 2,391/mi² |
| 77 | Jersey City | New Jersey | 264,152 | 247,597 | 16,555 | 6.69% | 14.8 mi² | 17,848/mi² |
| 78 | Durham | North Carolina | 263,016 | 228,330 | 34,686 | 15.19% | 109.8 mi² | 2,395/mi² |
| 79 | St. Petersburg | Florida | 260,999 | 244,769 | 16,230 | 6.63% | 61.8 mi² | 4,223/mi² |
| 80 | Laredo | Texas | 257,156 | 236,091 | 21,065 | 8.92% | 101.1 mi² | 2,544/mi² |
| 81 | Buffalo | New York | 256,902 | 261,310 | -4,408 | -1.69% | 40.4 mi² | 6,359/mi² |
| 82 | Madison | Wisconsin | 252,551 | 233,209 | 19,342 | 8.29% | 77.0 mi² | 3,280/mi² |
| 83 | Lubbock | Texas | 252,506 | 229,573 | 22,933 | 9.99% | 124.6 mi² | 2,027/mi² |
| 84 | Chandler | Arizona | 247,477 | 236,123 | 11,354 | 4.81% | 64.9 mi² | 3,813/mi² |
| 85 | Scottsdale | Arizona | 246,645 | 217,385 | 29,260 | 13.46% | 183.9 mi² | 1,341/mi² |
| 86 | Glendale | Arizona | 245,895 | 226,721 | 19,174 | 8.46% | 59.1 mi² | 4,161/mi² |
| 87 | Reno | Nevada | 245,255 | 225,221 | 20,034 | 8.90% | 107.3 mi² | 2,286/mi² |
| 88 | Norfolk | Virginia | 245,115 | 242,803 | 2,312 | 0.95% | 53.3 mi² | 4,599/mi² |
| 89 | Winston–Salem | North Carolina | 242,203 | 229,617 | 12,586 | 5.48% | 132.5 mi² | 1,828/mi² |
| 90 | North Las Vegas | Nevada | 238,702 | 216,961 | 21,741 | 10.02% | 98.0 mi² | 2,436/mi² |
| 91 | Irving | Texas | 238,289 | 216,290 | 21,999 | 10.17% | 67.0 mi² | 3,557/mi² |
| 92 | Chesapeake | Virginia | 237,940 | 222,209 | 15,731 | 7.08% | 338.5 mi² | 703/mi² |
| 93 | Gilbert | Arizona | 237,133 | 208,453 | 28,680 | 13.76% | 68.0 mi² | 3,487/mi² |
| 94 | Hialeah | Florida | 236,387 | 224,669 | 11,718 | 5.22% | 21.5 mi² | 10,995/mi² |
| 95 | Garland | Texas | 234,943 | 226,876 | 8,067 | 3.56% | 57.0 mi² | 4,122/mi² |
| 96 | Fremont | California | 233,136 | 214,089 | 19,047 | 8.90% | 77.5 mi² | 3,008/mi² |
| Paradise | Nevada | 229,666 | 223,167 | 6,499 | 2.91% | 46.717 mi² | 4,777/mi² | |
| 97 | Baton Rouge | Louisiana | 227,715 | 229,493 | -1,778 | -0.77% | 85.9 mi² | 2,651/mi² |
| Arlington | Virginia | 226,092 | 207,627 | 18,465 | 8.89% | 25.98 mi² | 7,992/mi² | |
| 98 | Richmond | Virginia | 223,170 | 204,214 | 18,956 | 9.28% | 59.8 mi² | 3,732/mi² |
| 99 | Boise | Idaho | 223,154 | 205,671 | 17,483 | 8.50% | 82.1 mi² | 2,718/mi² |
| 100 | San Bernardino | California | 216,239 | 209,924 | 6,315 | 3.01% | 61.5 mi² | 3,516/mi² |
| 101 | Spokane | Washington | 215,973 | 208,916 | 7,057 | 3.38% | 68.7 mi² | 3,144/mi² |
| 102 | Des Moines | Iowa | 215,472 | 203,433 | 12,039 | 5.92% | 88.9 mi² | 2,424/mi² |
| 103 | Modesto | California | 212,175 | 201,165 | 11,010 | 5.47% | 43.0 mi² | 4,934/mi² |
| 104 | Birmingham | Alabama | 212,157 | 212,237 | -80 | -0.04% | 146.1 mi² | 1,452/mi² |
| 105 | Tacoma | Washington | 211,277 | 198,397 | 12,880 | 6.49% | 49.7 mi² | 4,251/mi² |
| 106 | Fontana | California | 209,665 | 196,069 | 13,596 | 6.93% | 43.0 mi² | 4,876/mi² |
| 107 | Rochester | New York | 208,880 | 210,565 | -1,685 | -0.80% | 35.8 mi² | 5,835/mi² |
| 108 | Oxnard | California | 207,906 | 197,899 | 10,007 | 5.06% | 26.9 mi² | 7,729/mi² |
| 109 | Moreno Valley | California | 205,499 | 193,365 | 12,134 | 6.28% | 51.3 mi² | 4,006/mi² |
| 110 | Fayetteville | North Carolina | 204,759 | 200,564 | 4,195 | 2.09% | 147.7 mi² | 1,386/mi² |
| 111 | Aurora | Illinois | 201,110 | 197,899 | 3,211 | 1.62% | 44.9 mi² | 4,479/mi² |
| 112 | Glendale | California | 200,831 | 191,719 | 9,112 | 4.75% | 30.4 mi² | 6,606/mi² |
| 113 | Yonkers | New York | 200,807 | 195,976 | 4,831 | 2.47% | 18.0 mi² | 11,156/mi² |
| 114 | Huntington Beach | California | 200,652 | 189,992 | 10,660 | 5.61% | 26.9 mi² | 7,459/mi² |
| 115 | Montgomery | Alabama | 200,022 | 205,764 | -5,742 | -2.79% | 159.8 mi² | 1,252/mi² |
| 116 | Amarillo | Texas | 199,582 | 190,695 | 8,887 | 4.66% | 101.4 mi² | 1,968/mi² |
| 117 | Little Rock | Arkansas | 198,541 | 193,524 | 5,017 | 2.59% | 118.7 mi² | 1,673/mi² |
| 118 | Akron | Ohio | 197,633 | 199,110 | -1,477 | -0.74% | 62.0 mi² | 3,188/mi² |
| 119 | Columbus | Georgia | 197,485 | 189,885 | 7,600 | 4.00% | 216.4 mi² | 913/mi² |
| 120 | Augusta | Georgia | 197,081 | 195,844 | 1,237 | 0.63% | 302.5 mi² | 652/mi² |
| 121 | Grand Rapids | Michigan | 196,445 | 188,040 | 8,405 | 4.47% | 44.4 mi² | 4,424/mi² |
| 122 | Shreveport | Louisiana | 194,920 | 199,311 | -4,391 | -2.20% | 107.1 mi² | 1,820/mi² |
| 123 | Salt Lake City | Utah | 193,744 | 186,440 | 7,304 | 3.92% | 111.2 mi² | 1,742/mi² |
| 124 | Huntsville | Alabama | 193,079 | 180,105 | 12,974 | 7.20% | 213.4 mi² | 905/mi² |
| 125 | Mobile | Alabama | 192,904 | 195,111 | -2,207 | -1.13% | 139.4 mi² | 1,384/mi² |
| Sunrise Manor | Nevada | 192,873 | 189,372 | 3,501 | 1.85% | 33.352 mi² | 5,678/mi² | |
| 126 | Tallahassee | Florida | 190,894 | 181,376 | 9,518 | 5.25% | 100.4 mi² | 1,901/mi² |
| 127 | Grand Prairie | Texas | 190,682 | 175,396 | 15,286 | 8.72% | 72.3 mi² | 2,637/mi² |
| Spring Valley | Nevada | 190,661 | 178,395 | 12,266 | 6.88% | 33.226 mi² | 5,369/mi² | |
| 128 | Overland Park | Kansas | 188,966 | 173,372 | 15,594 | 8.99% | 75.1 mi² | 2,516/mi² |
| 129 | Knoxville | Tennessee | 186,239 | 178,874 | 7,365 | 4.12% | 98.5 mi² | 1,891/mi² |
| 130 | Port St. Lucie | Florida | 185,132 | 164,603 | 20,529 | 12.47% | 118.9 mi² | 1,557/mi² |
| 131 | Worcester | Massachusetts | 184,508 | 181,045 | 3,463 | 1.91% | 37.4 mi² | 4,933/mi² |
| 132 | Brownsville | Texas | 183,823 | 175,023 | 8,800 | 5.03% | 132.5 mi² | 1,387/mi² |
| 133 | Tempe | Arizona | 182,498 | 161,719 | 20,779 | 12.85% | 40.0 mi² | 4,562/mi² |
| 134 | Santa Clarita | California | 181,972 | 176,320 | 5,652 | 3.21% | 52.8 mi² | 3,446/mi² |
| 135 | Newport News | Virginia | 181,825 | 180,719 | 1,106 | 0.61% | 69.1 mi² | 2,631/mi² |
| 136 | Cape Coral | Florida | 179,804 | 154,305 | 25,499 | 16.53% | 105.6 mi² | 1,703/mi² |
| 137 | Providence | Rhode Island | 179,219 | 178,042 | 1,177 | 0.66% | 18.4 mi² | 9,740/mi² |
| 138 | Fort Lauderdale | Florida | 178,752 | 165,521 | 13,231 | 7.99% | 34.6 mi² | 5,166/mi² |
| 139 | Chattanooga | Tennessee | 177,571 | 167,674 | 9,897 | 5.90% | 143.1 mi² | 1,241/mi² |
| 140 | Rancho Cucamonga | California | 176,534 | 165,269 | 11,265 | 6.82% | 40.0 mi² | 4,413/mi² |
| 141 | Oceanside | California | 175,464 | 167,086 | 8,378 | 5.01% | 41.3 mi² | 4,249/mi² |
| 142 | Santa Rosa | California | 175,155 | 167,815 | 7,340 | 4.37% | 41.3 mi² | 4,241/mi² |
| 143 | Garden Grove | California | 174,858 | 170,883 | 3,975 | 2.33% | 18.0 mi² | 9,714/mi² |
| 144 | Vancouver | Washington | 174,826 | 161,791 | 13,035 | 8.06% | 46.9 mi² | 3,728/mi² |
| 145 | Sioux Falls | South Dakota | 174,360 | 153,888 | 20,472 | 13.30% | 75.4 mi² | 2,312/mi² |
| 146 | Ontario | California | 173,212 | 163,924 | 9,288 | 5.67% | 49.9 mi² | 3,471/mi² |
| 147 | McKinney | Texas | 172,298 | 131,117 | 41,181 | 31.41% | 63.0 mi² | 2,735/mi² |
| 148 | Elk Grove | California | 169,743 | 153,015 | 16,728 | 10.93% | 42.2 mi² | 4,022/mi² |
| 149 | Jackson | Mississippi | 169,148 | 173,514 | -4,366 | -2.52% | 111.0 mi² | 1,524/mi² |
| 150 | Pembroke Pines | Florida | 168,587 | 154,019 | 14,568 | 9.46% | 33.0 mi² | 5,109/mi² |
| 151 | Salem | Oregon | 167,419 | 154,637 | 12,782 | 8.27% | 48.6 mi² | 3,445/mi² |
| 152 | Springfield | Missouri | 167,319 | 159,498 | 7,821 | 4.90% | 82.3 mi² | 2,033/mi² |
| 153 | Corona | California | 166,785 | 152,374 | 14,411 | 9.46% | 39.5 mi² | 4,222/mi² |
| 154 | Eugene | Oregon | 166,575 | 156,185 | 10,390 | 6.65% | 44.1 mi² | 3,777/mi² |
| 155 | Fort Collins | Colorado | 164,207 | 143,986 | 20,221 | 14.04% | 55.8 mi² | 2,943/mi² |
| 156 | Peoria | Arizona | 164,173 | 154,065 | 10,108 | 6.56% | 175.7 mi² | 934/mi² |
| 157 | Frisco | Texas | 163,656 | 116,989 | 46,667 | 39.89% | 67.7 mi² | 2,417/mi² |
| 158 | Cary | North Carolina | 162,320 | 135,234 | 27,086 | 20.03% | 56.5 mi² | 2,873/mi² |
| 159 | Lancaster | California | 160,106 | 156,633 | 3,473 | 2.22% | 94.3 mi² | 1,698/mi² |
| 160 | Hayward | California | 158,937 | 144,186 | 14,751 | 10.23% | 45.5 mi² | 3,493/mi² |
| 161 | Palmdale | California | 157,356 | 152,750 | 4,606 | 3.02% | 106.0 mi² | 1,484/mi² |
| 162 | Salinas | California | 157,218 | 150,441 | 6,777 | 4.50% | 23.6 mi² | 6,662/mi² |
| 163 | Alexandria | Virginia | 155,810 | 139,966 | 15,844 | 11.32% | 15.0 mi² | 10,387/mi² |
| 164 | Lakewood | Colorado | 154,393 | 142,980 | 11,413 | 7.98% | 42.9 mi² | 3,599/mi² |
| 165 | Springfield | Massachusetts | 154,074 | 153,060 | 1,014 | 0.66% | 31.9 mi² | 4,830/mi² |
| 166 | Pasadena | Texas | 153,351 | 149,043 | 4,308 | 2.89% | 43.5 mi² | 3,525/mi² |
| 167 | Sunnyvale | California | 152,771 | 140,081 | 12,690 | 9.06% | 22.0 mi² | 6,944/mi² |
| 168 | Macon | Georgia | 152,555 | 91,351 | 61,204 | 67.00% | 249.3 mi² | 612/mi² |
| 169 | Pomona | California | 152,494 | 149,058 | 3,436 | 2.31% | 23.0 mi² | 6,630/mi² |
| 170 | Hollywood | Florida | 151,998 | 140,768 | 11,230 | 7.98% | 27.3 mi² | 5,568/mi² |
| 171 | Kansas City | Kansas | 151,709 | 145,786 | 5,923 | 4.06% | 124.8 mi² | 1,216/mi² |
| 172 | Escondido | California | 151,613 | 143,911 | 7,702 | 5.35% | 37.1 mi² | 4,087/mi² |
| 173 | Clarksville | Tennessee | 150,287 | 132,929 | 17,358 | 13.06% | 98.3 mi² | 1,529/mi² |
| 174 | Joliet | Illinois | 148,262 | 147,433 | 829 | 0.56% | 64.4 mi² | 2,302/mi² |
| 175 | Rockford | Illinois | 147,651 | 152,871 | -5,220 | -3.41% | 63.5 mi² | 2,325/mi² |
| 176 | Torrance | California | 147,195 | 145,438 | 1,757 | 1.21% | 20.5 mi² | 7,180/mi² |
| 177 | Naperville | Illinois | 147,122 | 141,853 | 5,269 | 3.71% | 38.7 mi² | 3,802/mi² |
| 178 | Paterson | New Jersey | 147,000 | 146,199 | 801 | 0.55% | 8.4 mi² | 17,500/mi² |
| 179 | Savannah | Georgia | 146,763 | 136,286 | 10,477 | 7.69% | 103.6 mi² | 1,417/mi² |
| 180 | Bridgeport | Connecticut | 145,936 | 144,229 | 1,707 | 1.18% | 16.1 mi² | 9,064/mi² |
| Metairie | Louisiana | 144,772 | 138,481 | 6,291 | 4.54% | 23.222 mi² | 5,963/mi² | |
| 181 | Mesquite | Texas | 143,736 | 139,824 | 3,912 | 2.80% | 47.2 mi² | 3,045/mi² |
| 182 | Killeen | Texas | 143,400 | 127,921 | 15,479 | 12.10% | 53.5 mi² | 2,680/mi² |
| 183 | Syracuse | New York | 143,378 | 145,170 | -1,792 | -1.23% | 25.0 mi² | 5,735/mi² |
| 184 | McAllen | Texas | 142,212 | 129,877 | 12,335 | 9.50% | 58.4 mi² | 2,435/mi² |
| 185 | Pasadena | California | 142,059 | 137,122 | 4,937 | 3.60% | 23.0 mi² | 6,176/mi² |
| 186 | Bellevue | Washington | 141,400 | 122,363 | 19,037 | 15.56% | 33.5 mi² | 4,221/mi² |
| 187 | Fullerton | California | 140,721 | 135,161 | 5,560 | 4.11% | 22.4 mi² | 6,282/mi² |
| 188 | Orange | California | 140,504 | 136,416 | 4,088 | 3.00% | 25.4 mi² | 5,532/mi² |
| 189 | Dayton | Ohio | 140,489 | 141,527 | -1,038 | -0.73% | 55.7 mi² | 2,522/mi² |
| 190 | Miramar | Florida | 138,449 | 122,041 | 16,408 | 13.44% | 29.4 mi² | 4,709/mi² |
| 191 | Thornton | Colorado | 136,703 | 118,772 | 17,931 | 15.10% | 35.7 mi² | 3,829/mi² |
| 192 | West Valley City | Utah | 136,574 | 129,480 | 7,094 | 5.48% | 35.5 mi² | 3,847/mi² |
| 193 | Olathe | Kansas | 135,473 | 125,872 | 9,601 | 7.63% | 60.9 mi² | 2,225/mi² |
| 194 | Hampton | Virginia | 135,410 | 137,436 | -2,026 | -1.47% | 51.5 mi² | 2,629/mi² |
| 195 | Warren | Michigan | 135,125 | 134,056 | 1,069 | 0.80% | 34.4 mi² | 3,928/mi² |
| 196 | Midland | Texas | 134,610 | 111,147 | 23,463 | 21.11% | 74.4 mi² | 1,809/mi² |
| 197 | Waco | Texas | 134,432 | 124,805 | 9,627 | 7.71% | 89.0 mi² | 1,510/mi² |
| 198 | Charleston | South Carolina | 134,385 | 120,083 | 14,302 | 11.91% | 109.0 mi² | 1,233/mi² |
| 199 | Columbia | South Carolina | 134,309 | 129,272 | 5,037 | 3.90% | 133.5 mi² | 1,006/mi² |
| 200 | Denton | Texas | 133,808 | 113,383 | 20,425 | 18.01% | 93.4 mi² | 1,433/mi² |
| 201 | Carrollton | Texas | 133,351 | 119,097 | 14,254 | 11.97% | 36.3 mi² | 3,674/mi² |
| 202 | Surprise | Arizona | 132,677 | 117,517 | 15,160 | 12.90% | 107.9 mi² | 1,230/mi² |
| 203 | Roseville | California | 132,671 | 118,788 | 13,883 | 11.69% | 43.0 mi² | 3,085/mi² |
| 204 | Sterling Heights | Michigan | 132,427 | 129,699 | 2,728 | 2.10% | 36.5 mi² | 3,628/mi² |
| 205 | Murfreesboro | Tennessee | 131,947 | 108,755 | 23,192 | 21.32% | 55.9 mi² | 2,360/mi² |
| 206 | Gainesville | Florida | 131,591 | 124,354 | 7,237 | 5.82% | 62.3 mi² | 2,112/mi² |
| 207 | Cedar Rapids | Iowa | 131,127 | 126,326 | 4,801 | 3.80% | 70.8 mi² | 1,852/mi² |
| 208 | Visalia | California | 131,074 | 124,442 | 6,632 | 5.33% | 37.5 mi² | 3,495/mi² |
| 209 | Coral Springs | Florida | 130,059 | 121,096 | 8,963 | 7.40% | 23.8 mi² | 5,465/mi² |
| 210 | New Haven | Connecticut | 129,934 | 129,779 | 155 | 0.12% | 18.7 mi² | 6,948/mi² |
| Enterprise | Nevada | 129,620 | 108,481 | 21,139 | 19.49% | 46.513 mi² | 2,332/mi² | |
| 211 | Stamford | Connecticut | 129,113 | 122,643 | 6,470 | 5.28% | 37.6 mi² | 3,434/mi² |
| 212 | Thousand Oaks | California | 128,888 | 126,683 | 2,205 | 1.74% | 55.2 mi² | 2,335/mi² |
| 213 | Concord | California | 128,726 | 122,067 | 6,659 | 5.46% | 30.5 mi² | 4,221/mi² |
| 214 | Elizabeth | New Jersey | 128,640 | 124,969 | 3,671 | 2.94% | 12.3 mi² | 10,459/mi² |
| 215 | Lafayette | Louisiana | 127,626 | 120,623 | 7,003 | 5.81% | 53.8 mi² | 2,372/mi² |
| 216 | Kent | Washington | 127,514 | 92,411 | 35,103 | 37.99% | 33.7 mi² | 3,784/mi² |
| 217 | Topeka | Kansas | 126,808 | 127,473 | -665 | -0.52% | 61.5 mi² | 2,062/mi² |
| 218 | Simi Valley | California | 126,327 | 124,237 | 2,090 | 1.68% | 41.5 mi² | 3,044/mi² |
| 219 | Santa Clara | California | 125,948 | 116,468 | 9,480 | 8.14% | 18.4 mi² | 6,845/mi² |
| East Los Angeles | California | 124,191 | 126,496 | -2,305 | -1.82% | 7.448 mi² | 16,984/mi² | |
| 220 | Athens | Georgia | 123,371 | 115,452 | 7,919 | 6.86% | 116.4 mi² | 1,060/mi² |
| 221 | Hartford | Connecticut | 123,243 | 124,775 | -1,532 | -1.23% | 17.4 mi² | 7,083/mi² |
| 222 | Victorville | California | 122,265 | 115,903 | 6,362 | 5.49% | 73.3 mi² | 1,668/mi² |
| 223 | Abilene | Texas | 122,225 | 117,063 | 5,162 | 4.41% | 106.7 mi² | 1,146/mi² |
| 224 | Norman | Oklahoma | 122,180 | 110,925 | 11,255 | 10.15% | 178.8 mi² | 683/mi² |
| 225 | Vallejo | California | 121,299 | 115,942 | 5,357 | 4.62% | 30.7 mi² | 3,951/mi² |
| 226 | Berkeley | California | 121,240 | 112,580 | 8,660 | 7.69% | 10.5 mi² | 11,547/mi² |
| 227 | Round Rock | Texas | 120,892 | 99,887 | 21,005 | 21.03% | 35.6 mi² | 3,396/mi² |
| 228 | Ann Arbor | Michigan | 120,782 | 113,934 | 6,848 | 6.01% | 28.1 mi² | 4,298/mi² |
| 229 | Fargo | North Dakota | 120,762 | 105,549 | 15,213 | 14.41% | 49.3 mi² | 2,450/mi² |
| 230 | Columbia | Missouri | 120,612 | 108,500 | 12,112 | 11.16% | 65.0 mi² | 1,856/mi² |
| 231 | Allentown | Pennsylvania | 120,443 | 118,032 | 2,411 | 2.04% | 17.5 mi² | 6,882/mi² |
| 232 | Evansville | Indiana | 119,477 | 117,429 | 2,048 | 1.74% | 47.3 mi² | 2,526/mi² |
| 233 | Beaumont | Texas | 118,299 | 118,296 | 3 | 0.00% | 82.1 mi² | 1,441/mi² |
| 234 | Odessa | Texas | 117,871 | 99,940 | 17,931 | 17.94% | 45.2 mi² | 2,608/mi² |
| 235 | Wilmington | North Carolina | 117,525 | 106,476 | 11,049 | 10.38% | 51.6 mi² | 2,278/mi² |
| 236 | Arvada | Colorado | 117,453 | 106,433 | 11,020 | 10.35% | 38.6 mi² | 3,043/mi² |
| 237 | Independence | Missouri | 117,030 | 116,830 | 200 | 0.17% | 77.8 mi² | 1,504/mi² |
| 238 | Provo | Utah | 116,868 | 112,488 | 4,380 | 3.89% | 41.7 mi² | 2,803/mi² |
| 239 | Lansing | Michigan | 116,020 | 114,297 | 1,723 | 1.51% | 39.1 mi² | 2,967/mi² |
| 240 | El Monte | California | 115,807 | 113,475 | 2,332 | 2.06% | 9.6 mi² | 12,063/mi² |
| 241 | Springfield | Illinois | 115,715 | 116,250 | -535 | -0.46% | 60.1 mi² | 1,925/mi² |
| 242 | Fairfield | California | 114,756 | 105,321 | 9,435 | 8.96% | 40.9 mi² | 2,806/mi² |
| 243 | Clearwater | Florida | 114,361 | 107,685 | 6,676 | 6.20% | 25.9 mi² | 4,415/mi² |
| 244 | Peoria | Illinois | 114,265 | 115,007 | -742 | -0.65% | 48.2 mi² | 2,371/mi² |
| 245 | Rochester | Minnesota | 114,011 | 106,769 | 7,242 | 6.78% | 54.6 mi² | 2,088/mi² |
| 246 | Carlsbad | California | 113,952 | 105,328 | 8,624 | 8.19% | 37.7 mi² | 3,023/mi² |
| 247 | Westminster | Colorado | 113,875 | 106,114 | 7,761 | 7.31% | 31.7 mi² | 3,592/mi² |
| 248 | West Jordan | Utah | 113,699 | 103,712 | 9,987 | 9.63% | 32.3 mi² | 3,520/mi² |
| 249 | Pearland | Texas | 113,570 | 91,252 | 22,318 | 24.46% | 46.3 mi² | 2,453/mi² |
| 250 | Richardson | Texas | 113,347 | 99,223 | 14,124 | 14.23% | 28.6 mi² | 3,963/mi² |
| 251 | Downey | California | 113,267 | 111,772 | 1,495 | 1.34% | 12.4 mi² | 9,134/mi² |
| 252 | Miami Gardens | Florida | 113,058 | 107,167 | 5,891 | 5.50% | 18.2 mi² | 6,212/mi² |
| 253 | Temecula | California | 113,054 | 100,097 | 12,957 | 12.94% | 37.3 mi² | 3,031/mi² |
| 254 | Costa Mesa | California | 112,822 | 109,960 | 2,862 | 2.60% | 15.7 mi² | 7,186/mi² |
| 255 | College Station | Texas | 112,141 | 93,857 | 18,284 | 19.48% | 51.0 mi² | 2,199/mi² |
| 256 | Elgin | Illinois | 112,123 | 108,188 | 3,935 | 3.64% | 37.4 mi² | 2,998/mi² |
| 257 | Murrieta | California | 111,674 | 103,466 | 8,208 | 7.93% | 33.6 mi² | 3,324/mi² |
| 258 | Gresham | Oregon | 111,523 | 105,594 | 5,929 | 5.61% | 23.3 mi² | 4,786/mi² |
| 259 | High Point | North Carolina | 111,223 | 104,371 | 6,852 | 6.57% | 55.2 mi² | 2,015/mi² |
| 260 | Antioch | California | 110,898 | 102,372 | 8,526 | 8.33% | 29.4 mi² | 3,772/mi² |
| 261 | Inglewood | California | 110,654 | 109,673 | 981 | 0.89% | 9.1 mi² | 12,160/mi² |
| 262 | Cambridge | Massachusetts | 110,651 | 105,162 | 5,489 | 5.22% | 6.4 mi² | 17,289/mi² |
| 263 | Lowell | Massachusetts | 110,558 | 106,519 | 4,039 | 3.79% | 13.6 mi² | 8,129/mi² |
| 264 | Manchester | New Hampshire | 110,506 | 109,565 | 941 | 0.86% | 33.1 mi² | 3,339/mi² |
| 265 | Billings | Montana | 110,323 | 104,170 | 6,153 | 5.91% | 43.7 mi² | 2,525/mi² |
| 266 | Pueblo | Colorado | 110,291 | 106,595 | 3,696 | 3.47% | 53.6 mi² | 2,058/mi² |
| 267 | Palm Bay | Florida | 110,104 | 103,190 | 6,914 | 6.70% | 65.7 mi² | 1,676/mi² |
| 268 | Centennial | Colorado | 109,932 | 100,377 | 9,555 | 9.52% | 29.5 mi² | 3,727/mi² |
| 269 | Richmond | California | 109,813 | 103,701 | 6,112 | 5.89% | 30.1 mi² | 3,648/mi² |
| Brandon | Florida | 109,784 | 103,483 | 6,301 | 6.09% | 33.101 mi² | 3,126/mi² | |
| 270 | Ventura | California | 109,592 | 106,433 | 3,159 | 2.97% | 21.8 mi² | 5,027/mi² |
| 271 | Pompano Beach | Florida | 109,393 | 99,845 | 9,548 | 9.56% | 24.0 mi² | 4,558/mi² |
| 272 | North Charleston | South Carolina | 109,298 | 97,471 | 11,827 | 12.13% | 73.7 mi² | 1,483/mi² |
| 273 | Everett | Washington | 109,043 | 103,019 | 6,024 | 5.85% | 33.3 mi² | 3,275/mi² |
| 274 | Waterbury | Connecticut | 108,272 | 110,366 | -2,094 | -1.90% | 28.5 mi² | 3,799/mi² |
| 275 | West Palm Beach | Florida | 108,161 | 99,919 | 8,242 | 8.25% | 55.1 mi² | 1,963/mi² |
| 276 | Boulder | Colorado | 108,090 | 97,385 | 10,705 | 10.99% | 24.8 mi² | 4,358/mi² |
| 277 | West Covina | California | 107,847 | 106,098 | 1,749 | 1.65% | 16.0 mi² | 6,740/mi² |
| 278 | Broken Arrow | Oklahoma | 107,403 | 98,850 | 8,553 | 8.65% | 61.7 mi² | 1,741/mi² |
| 279 | Clovis | California | 106,583 | 95,631 | 10,952 | 11.45% | 24.2 mi² | 4,404/mi² |
| 280 | Daly City | California | 106,472 | 101,123 | 5,349 | 5.29% | 7.6 mi² | 14,009/mi² |
| 281 | Lakeland | Florida | 106,420 | 97,422 | 8,998 | 9.24% | 65.9 mi² | 1,615/mi² |
| 282 | Santa Maria | California | 106,290 | 99,553 | 6,737 | 6.77% | 22.8 mi² | 4,662/mi² |
| 283 | Norwalk | California | 106,178 | 105,549 | 629 | 0.60% | 9.7 mi² | 10,946/mi² |
| 284 | Sandy Springs | Georgia | 105,703 | 93,853 | 11,850 | 12.63% | 37.7 mi² | 2,804/mi² |
| 285 | Hillsboro | Oregon | 105,164 | 91,611 | 13,553 | 14.79% | 25.0 mi² | 4,207/mi² |
| 286 | Green Bay | Wisconsin | 105,139 | 104,057 | 1,082 | 1.04% | 45.4 mi² | 2,316/mi² |
| 287 | Tyler | Texas | 104,798 | 96,900 | 7,898 | 8.15% | 56.6 mi² | 1,852/mi² |
| 288 | Wichita Falls | Texas | 104,724 | 104,553 | 171 | 0.16% | 72.2 mi² | 1,450/mi² |
| 289 | Lewisville | Texas | 104,659 | 95,290 | 9,369 | 9.83% | 36.7 mi² | 2,852/mi² |
| 290 | Burbank | California | 104,447 | 103,340 | 1,107 | 1.07% | 17.4 mi² | 6,003/mi² |
| 291 | Greeley | Colorado | 103,990 | 92,889 | 11,101 | 11.95% | 47.8 mi² | 2,176/mi² |
| 292 | San Mateo | California | 103,959 | 97,207 | 6,752 | 6.95% | 12.1 mi² | 8,592/mi² |
| 293 | El Cajon | California | 103,768 | 99,478 | 4,290 | 4.31% | 14.5 mi² | 7,156/mi² |
| 294 | Jurupa Valley | California | 103,541 | 103,541 | 0.00% | 42.9 mi² | 2,414/mi² | |
| 295 | Rialto | California | 103,314 | 99,171 | 4,143 | 4.18% | 22.3 mi² | 4,633/mi² |
| 296 | Davenport | Iowa | 102,612 | 99,685 | 2,927 | 2.94% | 62.9 mi² | 1,631/mi² |
| 297 | League City | Texas | 102,010 | 83,560 | 18,450 | 22.08% | 51.2 mi² | 1,992/mi² |
| 298 | Edison | New Jersey | 101,996 | 99,967 | 2,029 | 2.03% | 30.1 mi² | 3,389/mi² |
| 299 | Davie | Florida | 101,871 | 91,992 | 9,879 | 10.74% | 34.9 mi² | 2,919/mi² |
| 300 | Las Cruces | New Mexico | 101,759 | 97,618 | 4,141 | 4.24% | 76.9 mi² | 1,323/mi² |
| 301 | South Bend | Indiana | 101,735 | 101,168 | 567 | 0.56% | 41.4 mi² | 2,457/mi² |
| 302 | Vista | California | 101,659 | 93,834 | 7,825 | 8.34% | 18.7 mi² | 5,436/mi² |
| 303 | Woodbridge | New Jersey | 101,389 | 99,585 | 1,804 | 1.81% | 23.3 mi² | 4,351/mi² |
| 304 | Renton | Washington | 100,953 | 90,927 | 10,026 | 11.03% | 23.4 mi² | 4,314/mi² |
| 305 | Lakewood | New Jersey | 100,758 | 92,843 | 7,915 | 8.53% | 24.7 mi² | 4,079/mi² |
| 306 | San Angelo | Texas | 100,702 | 93,200 | 7,502 | 8.05% | 59.9 mi² | 1,681/mi² |
| 307 | Clinton | Michigan | 100,392 | 96,796 | 3,596 | 3.72% | 28.1 mi² | 3,573/mi² |
Mortgage rates vary depending upon the down payment of the consumer, their credit score, and the type of loan that will be acquired by the consumer. For instance, in February, 2010, the national average mortgage rate for a 30 year fixed rate loan was at 4.750 percent (5.016 APR). The 15 year fixed was at 4.125 percent (4.312 APR) and the 5/1 ARM was at 3.875 percent (3.122 APR). These prices are just a snapshot of the average and will constantly change day to day, though the relative values will remain roughly the same. Namely, longer duration debt & fixed rate loans are typically charged a higher initial interest rate to lock in the certainy. This relationship makes sense because homeowners have the ability to refinance a fixed rate mortgage if rates drop, but if interest rates increase lenders have no way to adjust the fixed rate upward.
The general rule of thumbs are
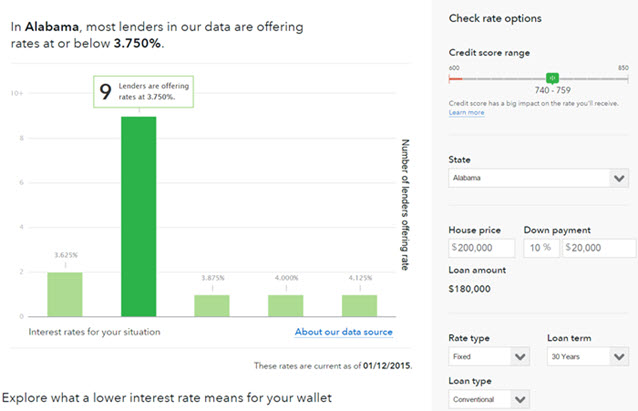
The Consumer Fiance Protection Bureau offers a home buyer's checklist and a free online tool for checking typical mortgage rates within your state for a given credit score range.
Here are historical average annual interest rates for popular home loan products.
| Year | 30-YR FRM Rate | 30-YR Points | 15-YR FRM Rate | 15-YR Points | 1-YR ARM Rate | 1-YR Points | 1-YR Margin | 5/1-YR ARM Rate | 5/1-YR Points | 5/1-YR Margin |
|---|---|---|---|---|---|---|---|---|---|---|
| 2024 | 6.72 | 5.97 | ||||||||
| 2023 | 6.81 | 6.11 | ||||||||
| 2022 | 5.34 | 0.81 | 4.58 | 0.84 | 4.09 | 0.29 | 2.75 | |||
| 2021 | 2.96 | 0.68 | 2.27 | 0.64 | 2.61 | 0.29 | 2.75 | |||
| 2020 | 3.10 | 0.73 | 2.59 | 0.69 | 3.07 | 0.30 | 2.75 | |||
| 2019 | 3.94 | 0.5 | 3.39 | 0.5 | 3.57 | 0.4 | 2.75 | |||
| 2018 | 4.54 | 0.5 | 4.00 | 0.5 | 3.82 | 0.3 | 2.76 | |||
| 2017 | 3.99 | 0.5 | 3.27 | 0.5 | 3.20 | 0.4 | 2.74 | |||
| 2016 | 3.65 | 0.5 | 2.93 | 0.5 | 2.87 | 0.5 | 2.74 | |||
| 2015 | 3.85 | 0.6 | 3.09 | 0.6 | 2.53 | 0.3 | 2.74 | 2.94 | 0.5 | 2.74 |
| 2014 | 4.17 | 0.6 | 3.29 | 0.6 | 2.44 | 0.4 | 2.73 | 3.02 | 0.5 | 2.74 |
| 2013 | 3.98 | 0.7 | 3.11 | 0.7 | 2.62 | 0.4 | 2.76 | 2.88 | 0.5 | 2.75 |
| 2012 | 3.66 | 0.7 | 2.93 | 0.7 | 2.69 | 0.5 | 2.76 | 2.78 | 0.6 | 2.74 |
| 2011 | 4.45 | 0.7 | 3.68 | 0.7 | 3.03 | 0.6 | 2.76 | 3.31 | 0.6 | 2.74 |
| 2010 | 4.69 | 0.7 | 4.1 | 0.7 | 3.78 | 0.6 | 2.76 | 3.82 | 0.6 | 2.74 |
| 2009 | 5.04 | 0.7 | 4.57 | 0.7 | 4.7 | 0.6 | 2.75 | 4.75 | 0.6 | 2.74 |
| 2008 | 6.03 | 0.6 | 5.62 | 0.6 | 5.17 | 0.6 | 2.74 | 5.74 | 0.6 | 2.75 |
| 2007 | 6.34 | 0.4 | 6.03 | 0.4 | 5.56 | 0.6 | 2.75 | 6.07 | 0.5 | 2.76 |
| 2006 | 6.41 | 0.5 | 6.07 | 0.5 | 5.54 | 0.7 | 2.76 | 6.08 | 0.6 | 2.77 |
| 2005 | 5.87 | 0.6 | 5.42 | 0.6 | 4.49 | 0.7 | 2.77 | 5.32 | 0.6 | 2.78 |
| 2004 | 5.84 | 0.7 | 5.21 | 0.6 | 3.9 | 0.7 | 2.77 | |||
| 2003 | 5.83 | 0.6 | 5.17 | 0.6 | 3.76 | 0.6 | 2.76 | |||
| 2002 | 6.54 | 0.6 | 5.98 | 0.6 | 4.62 | 0.7 | 2.77 | |||
| 2001 | 6.97 | 0.9 | 6.5 | 0.9 | 5.82 | 0.9 | 2.77 | |||
| 2000 | 8.05 | 1 | 7.72 | 1 | 7.04 | 1 | 2.78 | |||
| 1999 | 7.44 | 1 | 7.06 | 1 | 5.99 | 1.1 | 2.79 | |||
| 1998 | 6.94 | 1.1 | 6.59 | 1.1 | 5.58 | 1.1 | 2.79 | |||
| 1997 | 7.6 | 1.7 | 7.13 | 1.7 | 5.61 | 1.4 | 2.79 | |||
| 1996 | 7.81 | 1.7 | 7.32 | 1.7 | 5.67 | 1.4 | 2.79 | |||
| 1995 | 7.93 | 1.8 | 7.48 | 1.8 | 6.06 | 1.5 | 2.8 | |||
| 1994 | 8.38 | 1.8 | 7.86 | 1.8 | 5.36 | 1.5 | 2.79 | |||
| 1993 | 7.31 | 1.6 | 6.83 | 1.6 | 4.58 | 1.5 | 2.77 | |||
| 1992 | 8.39 | 1.7 | 7.96 | 1.7 | 5.62 | 1.7 | 2.76 | |||
| 1991 | 9.25 | 2 | 7.09 | 1.9 | 2.77 | |||||
| 1990 | 10.13 | 2.1 | 8.36 | 2.1 | 2.77 | |||||
| 1989 | 10.32 | 2.1 | 8.8 | 2.3 | 2.77 | |||||
| 1988 | 10.34 | 2.1 | 7.9 | 2.3 | 2.75 | |||||
| 1987 | 10.21 | 2.2 | 7.83 | 2.2 | ||||||
| 1986 | 10.19 | 2.2 | 8.43 | 2.3 | ||||||
| 1985 | 12.43 | 2.5 | 10.05 | 2.5 | ||||||
| 1984 | 13.88 | 2.5 | 11.51 | 2.5 | ||||||
| 1983 | 13.24 | 2.1 | ||||||||
| 1982 | 16.04 | 2.2 | ||||||||
| 1981 | 16.63 | 2.1 | ||||||||
| 1980 | 13.74 | 1.8 | ||||||||
| 1979 | 11.2 | 1.6 | ||||||||
| 1978 | 9.64 | 1.3 | ||||||||
| 1977 | 8.85 | 1.1 | ||||||||
| 1976 | 8.87 | 1.1 | ||||||||
| 1975 | 9.05 | 1.1 | ||||||||
| 1974 | 9.19 | 1.2 | ||||||||
| 1973 | 8.04 | 1 | ||||||||
| 1972 | 7.38 | 0.9 |
Source: Freddie Mac PMMS
Fixed rates are based upon the national average, but vary from state to state. They possess the same interest rate throughout the duration of the loan. Consumers desire these loans if they plan to remain in their homes for the duration of the loan. For example, the consumer obtains a mortgage when interest rates are at their lowest and then interest rates rise. The consumer does not have to worry about their rates increasing because the interest rate is “fixed”. If the interest rates decrease, the consumer may have the option of refinancing, if the costs of refinancing are less than the overall savings.
These loans are typically available in 15 year and 30 year loan options. The rates are higher than variable rate loans, as consumers pay a premium to lock in the security of a fixed rate while maintaining the ability to refinance. The longer the term, the higher the rate, because banks will lose money as purchasing power decreases due to inflation.
Adjustable rates are typically lower than fixed rates when the loan is initially established. ARMs may adjust on a monthly basis in keeping with the Federal Reserve or on a bi-annual or annual basis. The consumer should be aware that as interest rates increase, so will their monthly payments. While ARMs may be appealing because the initial rates are lower, ARMs can also be a gamble. ARMs may be beneficial to investors or consumers who only plan to keep the loan for a short period of time. During that time, the consumer can enjoy low interest rates.
Hybrid Adjustable Rate Mortgages offer the consumer a low interest rate for a certain period of time. Then, they increase or adjust to the current rate after fixed rate period has elapsed. These rates can be an entire point lower than 30 year fixed rates. Therefore, there may be significant savings in terms of interest paid to the lender. Some common hybrid ARMs are 1 year fixed, 1 year adjustable rates (1/1); 5 years fixed, 1 year adjustable (5/1); and 7 years fixed, 1 year adjustable (7/1). The adjustable rates will be based upon the federal rate when the fixed term elapses. These loans are also appealing to investors or home buyers who plan to sell in a short period of time.

Unsure Which Loan Best Suits Your Budget?
Compare fixed, adjustable & interest-only mortgages side by side.
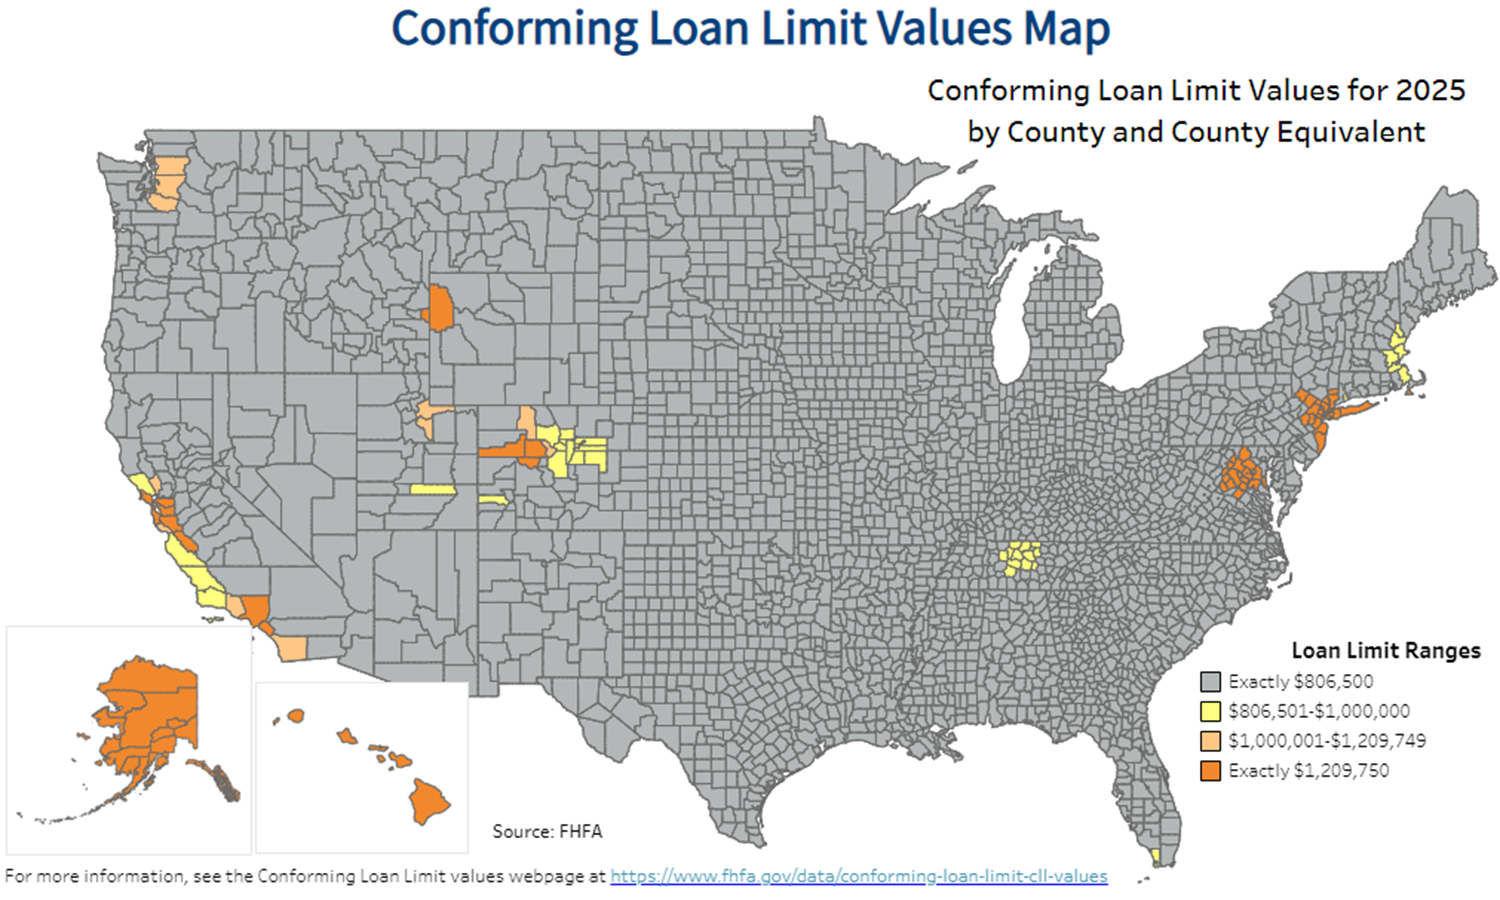
As of 2025 the FHFA set the conforming loan limit for single unit homes across the continental United States to $806,500, with a ceiling of 150% that amount in areas where median home values are higher. The conventional United States limit is as follows for 2, 3, and 4-unit homes $1,032,650, $1,248,150, and $1,551,250. The limits are higher in Alaska, Hawaii, Guam, the U.S. Virgin Islands & other high-cost areas. Loans which exceed these limits are classified as jumbo loans.
The limits in the first row apply to all areas of Alabama, Arizona, Arkansas, Delaware, Illinois, Indiana, Iowa, Georgia, Kansas, Kentucky, Louisiana, Maine, Michigan, Minnesota, Mississippi, Missouri, Montana, Nevada, New Mexico, North Dakota, Ohio, Oklahoma, Rhode Island, South Carolina, South Dakota, Texas, Vermont, Wisconsin & most other parts of the continental United States. Some coastal states are homes to metro areas with higher property prices which qualify the county they are in as a HERA designated high-cost areas.
The limits in the third row apply to Alaska, Guam, Virgin Islands, Washington D.C & Hawaii.
| Units | 1 | 2 | 3 | 4 |
|---|---|---|---|---|
| Continental U.S. Baseline | $806,500 | $1,032,650 | $1,248,150 | $1,551,250 |
| Designated High-cost Areas | $1,209,750 | $1,548,975 | $1,872,225 | $2,326,875 |
| Alaska, Hawaii, Guam & U.S. Virgin Islands | $1,209,750 | $1,548,975 | $1,872,225 | $2,326,875 |
The FHFA offers an interactive map of conforming limits by county. A static version of the map is included below.
The FHA secures loans made by private lenders. These loans are provided to Americans who have a low to middle income. This loan is available to those people who cannot afford a large down payment or higher interest rates. Interest rates for these loans are lower than the national average for a fixed rate loan. Individual banks determine the interest rates; therefore, the consumer should do research prior to accepting a loan at a particular bank. The consumer can receive a loan for as little as 3 percent down and also receive as much as 6 percent on closing costs. This means that the consumer can borrow up to 97 percent of the cost of the home.
VA loans are offered to veterans. The loans assist veterans in obtaining 100 percent financing. The United States Department of Veterans Affairs is the governing body that establishes the rules for the recipients of the VA loans. They also insure the VA loans and establish the terms of the loans offered to veterans.
USDA loans can help people with low incomes in rural parts of the state qualify for a subsidized low-interest loan.
Fixed rates are best for individuals who intend to remain in their homes for the duration of the loan. The initial interest rate may be higher than an ARM; however, there will be no hidden increases over the duration of the loan.
During the fixed rate period of a hybrid ARM, the consumer can enjoy the low interest rates and low payments. However, individuals who are not prepared may see an increase in their loan premiums that they cannot afford.
ARM interest rates change each month with the Federal Reserve. This loan is typically recommended for a short term investor who will sell quickly.
Fixed rate loans are by far the safest loans for consumers over a period of time.
The best time to secure a mortgage or refinance is when the rates are the lowest. Compare the National Mortgage Rate average over the past 10 to 20 years. If the rate is at one of its lowest points historically, then it can be a safe entry point into the market. Many investors over-extended themselves by purchasing multiple properties when prices were high. If the market turns, the home buyers may owe more than the house is worth. Those who wish to sell cannot fully recoup the costs of the home. Therefore, instead of having equity in the home, consumers owe more than the home is worth. Many individuals, in this instance will negotiate with the bank and “short sell” in order to relieve themselves of the debt.
A person who is making a purchase where they are using a large down payment or paying cash would likely be better off buying when mortgage rates are higher, since most people (who may compete to buy the same property) budget based on the montly payment rather than the total price of the house.
Below is a chart of historical montly mortgage rates from the Federal Reserve Economic Data series.
As stated above, the rates change based upon the Federal Reserve and the desire to keep the economy stable. Read the reports from the office and inquire with lenders to get a fair prediction of the direction of the Federal Reserve. If the Federal Reserve decides that consumers need to spend and borrow, interest rates will remain low. However, if the Federal Reserve decides that it needs consumers to save, invest, and deposit money, the interest rates will remain high. Other factors beyond the Federal Reserve which impact housing prices include:
A home is not just an asset, but also has many costs beyond financing; including regular repairs, homeowner's insurance, and property taxes.
If your down payment on a conforming loan is below 20% of the home's value you will likely be required to carry private mortgage insurance (PMI) until the loan's balance is below 80% of the home's value. Government loan programs like FHA and VA loans do not require PMI, however they have their own seperate insurance requirements, which may require the insurance to remain throughout the duration of the loan.
Beware of ARMs. The interest rates will typically increase after the introductory period and may cause a home buyer financial stress when the rates increase. Some individuals even foreclose when this happens, because they cannot handle the increased payments.
Purchasing mortgage discount points can be a viable option if you are fairly certain you will live in the house for many years. However, if you move after a couple years then paying a significant upfront fee to lock in lower rates for the life of the loan will be money wasted.
Other hidden costs may be associated with refinancing. For instance, an individual with a fixed interest rate may decide to refinance the loan if the interest rates decrease during the duration of the loan. However, the consumer must incur costs to have the loan refinanced. The consumer should make certain that the cost of refinancing is less than the savings from a lower interest rate. Otherwise, refinancing may not be in the best interest of the consumer. Some loans also contain pre-payment penalties, which increase the cost of refinancing.
The Federal Reserve has begun lowering interest rates. Lock in today's low rates and save on your loan.
Are you paying too much for your mortgage?
Check your mortgage options with a trusted El Monte lender.
Answer a few questions below and connect with a lender who can help save you money today!