
This calculator enables home buyers to quickly compare option-ARM and fixed rate mortgage payments. The option-ARM loan uses a low initial rate of interest to offer borrowers a low initial monthly payment which is typically significantly lower than they would achive via a fixed-rate mortgage (FRM) or a traditional adjustable-rate mortgage (ARM). These low monthly payments, however, are temporary as the interest rates reset to higher levels after 1 to 3 months & then remain fixed for a year. Like most other ARMs, payments then typically reset annually.
The following calculator shows initial monthly payments for option-ARM, ARM & FRM home loans along with how one might expect the monthly payments to change over time. Click the [+] on the right side of the calculator to add details to any section. When you are done entering your details click on the [Calculate] button. You will then see graphs of the monthly payments for the different loan types. To view a more detailed report of the loans, click on the [View Report] button. The [RATES] tab above shows current local mortgage rates.
The following table shows current El Monte 30-year mortgage rates. You can use the menus to select other loan durations, alter the loan amount, change your down payment, or change your location. More features are available in the advanced drop down.
These loans are typically 30-year ARMs which enable the borrower to "pick-a-payment" between four amounts: a fully amortizing 30-year payment, a fully amortizing 15-year payment, an interest-only payment, and a specified minimum payment.
When borrowers consistently make pay-option payments below the accured interest the loan becomes negative amortizing, with the loan balance growing over time. Most option ARM contracts which allow for negative amortization have a maximium negative amortization limit (at 110% to 125% of the initial loan amount). When this neg am limit is reached the loan is recast & minimum payments are automatically shifted to the fully amortizing payment. The interest rate on the loan also regularly resets up to a lifetime cap of something around 5% above the initial interest rate charged, based on the performance of a referenced index rate. These shifts in payments can lead to a "payment shock" which makes the loan unaffordable.
When market conditions are normal and risk is accurately priced these loans are not very popular, as owners who make the minimum payments may be building debt rather than building equity. These loans become more popular during booms where people feel future gains are certain & risk-free.
"The agency championed the thrift industry's growth during the housing boom and called programs that extended mortgages to previously unqualified borrowers as "innovations." In 2004, the year that risky loans called option adjustable-rate mortgages took off, then-OTS director James Gilleran lauded the banks for their role in providing home loans. "Our goal is to allow thrifts to operate with a wide breadth of freedom from regulatory intrusion," he said in a speech. ... In 2006, at the peak of the boom, lenders made $255 billion in option ARMs ... Most option ARMs were originated by OTS-regulated banks."
- Banking Regulator Played Advocate Over Enforcer
Typically banks would not want to make loans that had a high likelihood of failure, however most of these loans were packaged into mortgage-backed securities (MBS) and sold off to other investors, which held down risk premia even as loan quality deteriorated sharply:
the decline in underwriting standards was accompanied by a decline in credit spreads on mortgages, after adjusting for loan/borrower characteristics. Observable information, including FICO and LTV, became less influential on mortgage risk pricing over time during the housing bubble. As the volume of mortgages expanded and lending terms eased during the bubble, the increase in risk failed to be reflected in higher risk premiums.
Internally executives at many large banks knew the mortgages were being packaged using false reps and warranties, but they didn't care. The losses were someone else's to eat. Both The Big Short and Inside Job covered industry trends extensively.
"I started issuing warnings in June of 2006 and attempted to get management to address these critical risk issues. These warnings continued through 2007 and went to all levels of the Consumer Lending Group. We continued to purchase and sell to investors even larger volumes of mortgages through 2007. And defective mortgages increased during 2007 to over 80% of production." - Citigroup's Richard Bowden
"When the music stops, in terms of liquidity, things will be complicated. But as long as the music is playing, you've got to get up and dance. We're still dancing," - former chairman and CEO of Citigroup on July 9, 2007.
Most adjustable-rate mortgages have an introductory period where the rate of interest and monthly payments are fixed. After the initial introductory period the loan shifts from acting like a fixed-rate mortgage to behaving like an adjustable-rate mortgage, where rates are allowed to float or reset each year. It is the dual nature of these loans which leads to them being called a hybrid ARM. If a loan is named a 5/1 ARM then what that means is the loan is fixed for the first 5 years & then the rate resets each year thereafter. The initial loan interest rate is frequently discounted below the "fully indexed" rate one would get by adding the margin to the indexed reference rate.
IO ARM loans act similar to other ARMs with the exception that the intitial fixed period of the loan only covers the accrued interest on the loan while leaving the principal unchanged. Once the teaser rate expires the loan automatically shifts into a regular amortizing ARM loan. For example, a 5/1 IO ARM would charge interest-only for the first 5 years of the loan, then at that point the loan would convert into an amortizing loan where the remaining principal is paid off over the subsequent 25 remaining years of the loan. It is effectively like 2 loans in one
The same could be said for a 3 year IO or a 10 year IO loan. They would charge a fixed rate of interest for 3 & 10 years respectively, and then the loans would amortize at a floating interest rate for the remaining 27 & 20 years respectively.
Loans with a longer initial IO period have higher subsequent payments thereafter because they are forced to pay off interest AND the entire loan balance in a fewer number of subsequent years.
IO loans typically charge a fixed rate of interest during the introductory IO period, but some loans can also charge variable rates during the interest-only portion of the loan.
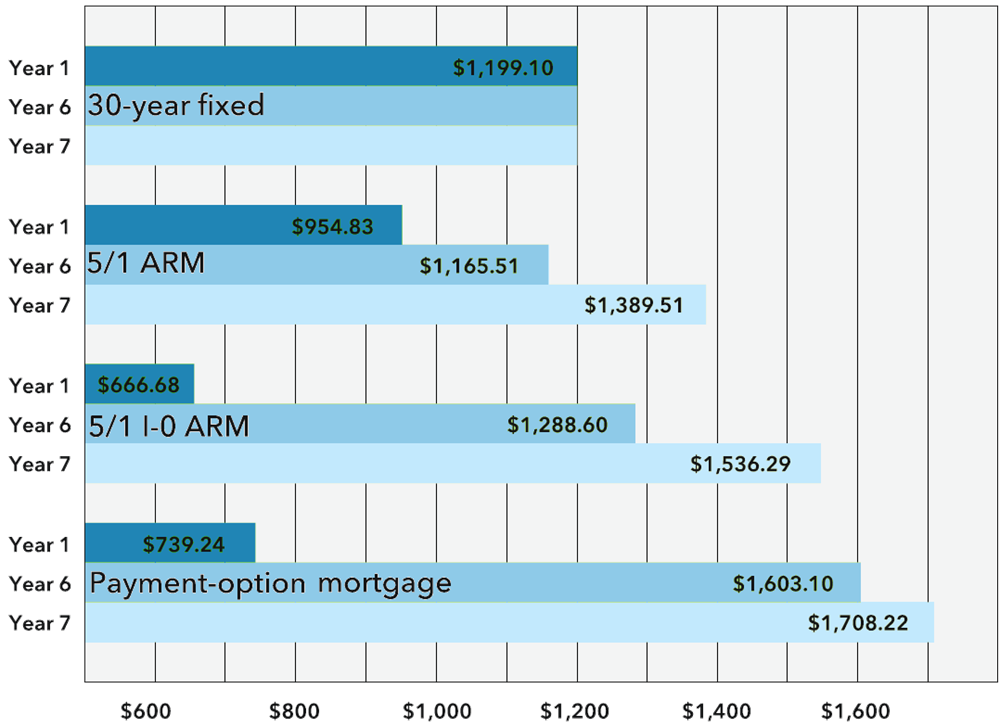
Here is a table courtesy the CFPB wich shows how loan payments can change over time for various types of ARM loans.
Lenders want to know you will be able to repay your loan before they make it. If a lender offers a "low doc" or "no doc" loan option that option will typically charge a higher rate of interest to make up for the added risk in lending you money.
The big risk with option-ARM loans is if interest rates rise & the borrower has only made the minimum payments they might have a large payment shock & little to no home equity to fall back on. FRMs charge a higher rate of interest than ARMs because they transfer the risk of interest rate rises onto the lender while guaranteeing the borrower a fixed monthly payemnt & a fixed APR throughout the life of the loan
For your convenience here is a table listing current local interest rates. You can use these rates to estimate the price of various mortgage loan products.
When interest rates are high ARMs allow consumers to save a bit of money betting interest rates may fall. When interest rates are low (as they are currently) the discount on ARM loans over FRM is typically not significant enough to compel homeowners to choose adjustable-rates.
Before ARM loans existed market participants had other creative financial means to smooth out real estate demand including home builder buydowns & the use of contracts for deeds.
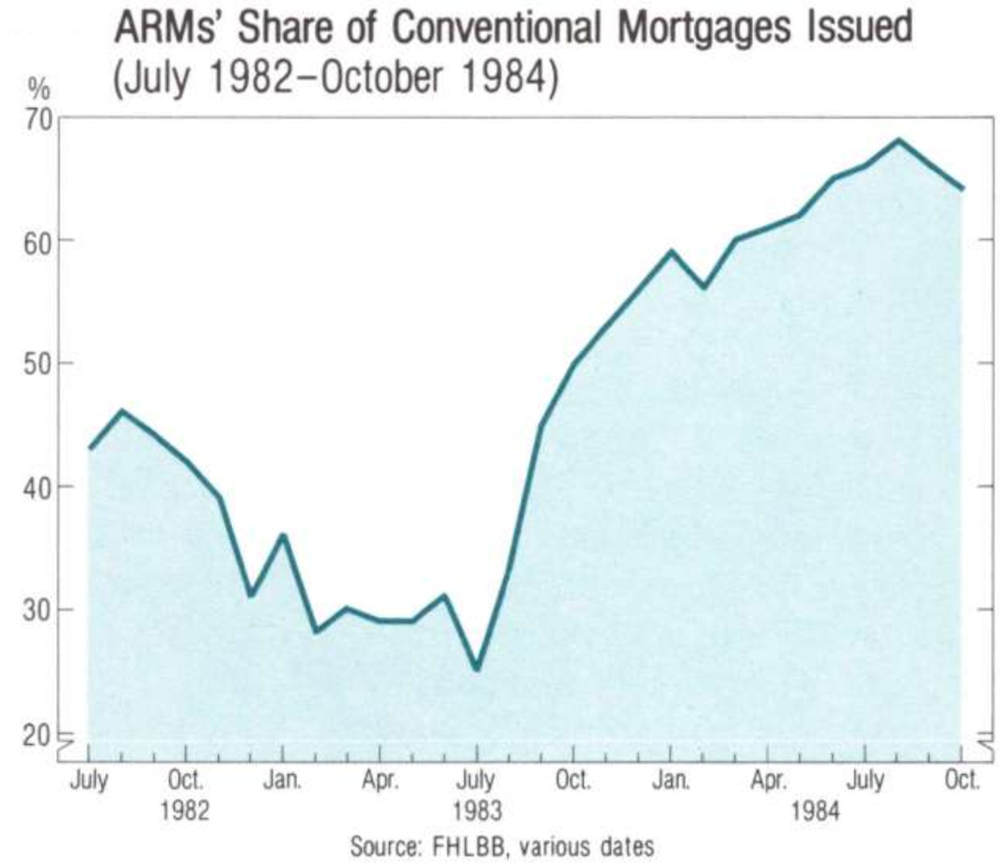
ARM loans were legalized nationally for federally chartered savings and loan institutions in 1981. By 1982 ARMs were widely issued with an estimated stock of $65 billion in loans by the end of the year. In 1983 $39 billion in additional stock was added. By 1984 ARMs accounted for about 60% of new conventional mortgages closed that year (exclusive of FHA & VA loans). Loan volumes grew so quickly that Freddie Mac tightened lending criteria in 1984 & Fannie Mae tightened their standards in 1985.
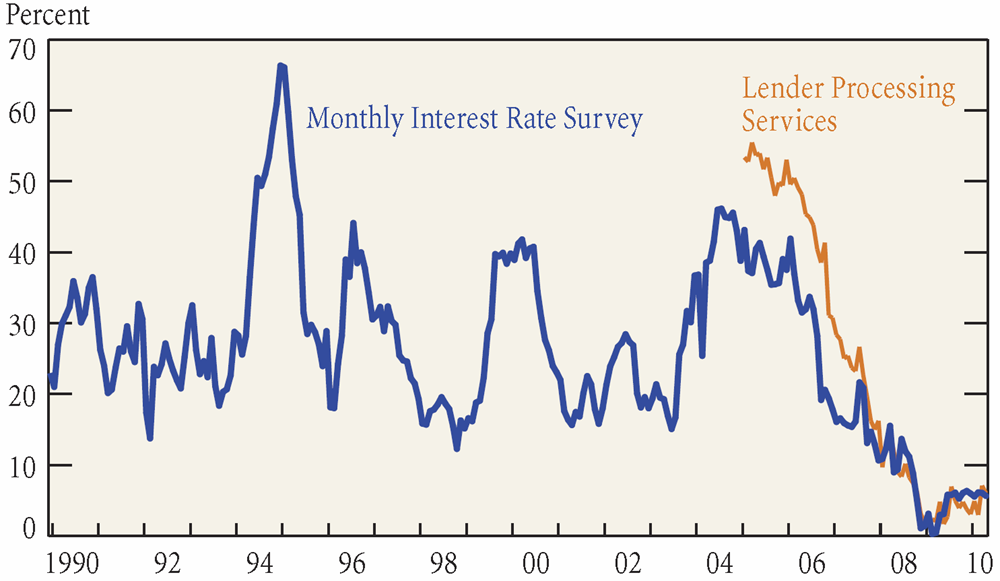
A similar spike in demand for ARMs happened in the early to mid 1990s & once again during the waning days of the early 2000s housing bubble.
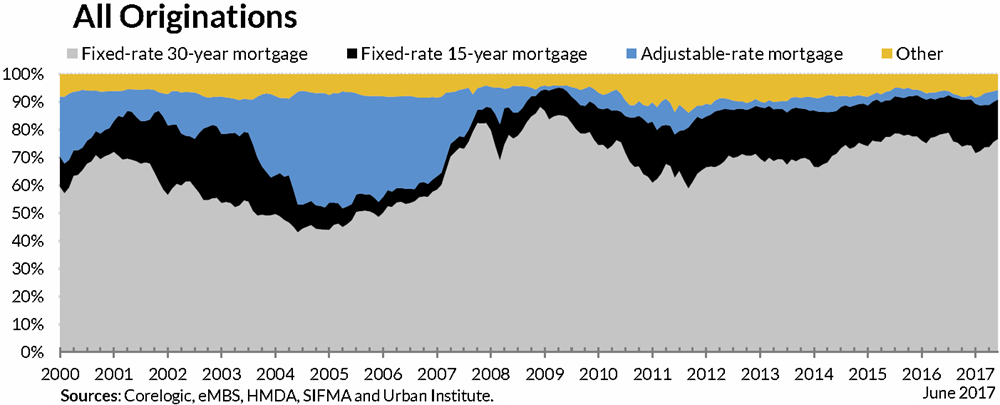
Since the 2008 housing crisis the vast majority of home buyers have chose to purchase homes using 30-year FRMs.
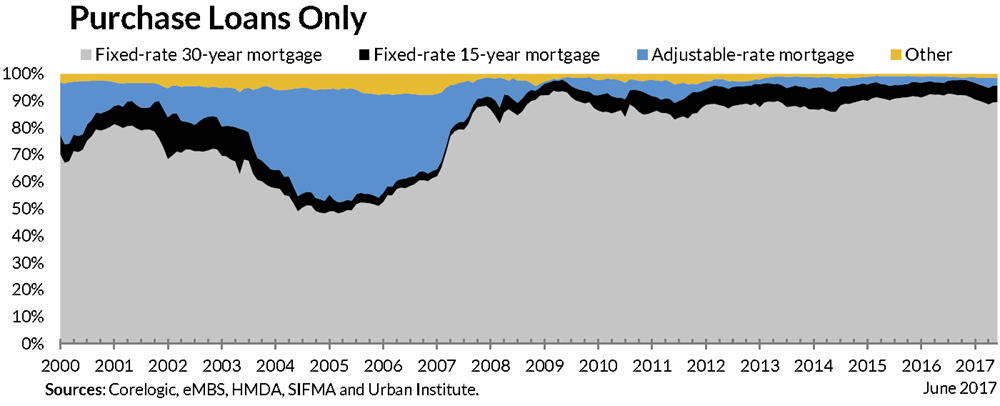
Most refinance activity is also into either a 30-year FRM or a 15-year FRM. The gap between the below chart and the above chart shows the impact refis have on the blended overall marketshare.
Most mortgages are fixed-rate loans which regularly amortize and charge simple interest. The amortization schedule is displayed in advanced & the monthly payment is known, with only the composition of the loan payment changing over time. As the loan's balance decreases the percent of the payment which is applied toward prinicpal increases & the portion which goes toward interest decreases.
For example, consider the below table listing the payments on a $300,000 home at a 5% fixed interest rate. Throughout the loan the core P&I payment is $1,610.46. Off the start $360.46 is paid toward principal with the remaining $1,250.00 going toward interest.
In the first year only $4,426.03 goes toward principal on the loan. In the 17th year of the loan the payment crosses over to where more of each monthly payment is applied toward principal rather than interest.
| Payment | Principal | Interest | Payment | Balance |
|---|---|---|---|---|
| 1 | $360.46 | $1,250.00 | $1,610.46 | $299,639.54 |
| 2 | $361.96 | $1,248.50 | $1,610.46 | $299,277.58 |
| 3 | $363.47 | $1,246.99 | $1,610.46 | $298,914.11 |
| 4 | $364.98 | $1,245.48 | $1,610.46 | $298,549.13 |
| 5 | $366.51 | $1,243.95 | $1,610.46 | $298,182.62 |
| 6 | $368.03 | $1,242.43 | $1,610.46 | $297,814.59 |
| 7 | $369.57 | $1,240.89 | $1,610.46 | $297,445.02 |
| 8 | $371.11 | $1,239.35 | $1,610.46 | $297,073.91 |
| 9 | $372.65 | $1,237.81 | $1,610.46 | $296,701.26 |
| 10 | $374.20 | $1,236.26 | $1,610.46 | $296,327.06 |
| 11 | $375.76 | $1,234.70 | $1,610.46 | $295,951.30 |
| 12 | $377.33 | $1,233.13 | $1,610.46 | $295,573.97 |
| Total for Year 1 | $4,426.03 | $14,899.49 | ||
| 13 | $378.90 | $1,231.56 | $1,610.46 | $295,195.07 |
| 14 | $380.48 | $1,229.98 | $1,610.46 | $294,814.59 |
| 15 | $382.07 | $1,228.39 | $1,610.46 | $294,432.52 |
| 16 | $383.66 | $1,226.80 | $1,610.46 | $294,048.86 |
| 17 | $385.26 | $1,225.20 | $1,610.46 | $293,663.60 |
| 18 | $386.86 | $1,223.60 | $1,610.46 | $293,276.74 |
| 19 | $388.47 | $1,221.99 | $1,610.46 | $292,888.27 |
| 20 | $390.09 | $1,220.37 | $1,610.46 | $292,498.18 |
| 21 | $391.72 | $1,218.74 | $1,610.46 | $292,106.46 |
| 22 | $393.35 | $1,217.11 | $1,610.46 | $291,713.11 |
| 23 | $394.99 | $1,215.47 | $1,610.46 | $291,318.12 |
| 24 | $396.63 | $1,213.83 | $1,610.46 | $290,921.49 |
| Total for Year 2 | $4,652.48 | $14,673.04 | ||
| 25 | $398.29 | $1,212.17 | $1,610.46 | $290,523.20 |
| 26 | $399.95 | $1,210.51 | $1,610.46 | $290,123.25 |
| 27 | $401.61 | $1,208.85 | $1,610.46 | $289,721.64 |
| 28 | $403.29 | $1,207.17 | $1,610.46 | $289,318.35 |
| 29 | $404.97 | $1,205.49 | $1,610.46 | $288,913.38 |
| 30 | $406.65 | $1,203.81 | $1,610.46 | $288,506.73 |
| 31 | $408.35 | $1,202.11 | $1,610.46 | $288,098.38 |
| 32 | $410.05 | $1,200.41 | $1,610.46 | $287,688.33 |
| 33 | $411.76 | $1,198.70 | $1,610.46 | $287,276.57 |
| 34 | $413.47 | $1,196.99 | $1,610.46 | $286,863.10 |
| 35 | $415.20 | $1,195.26 | $1,610.46 | $286,447.90 |
| 36 | $416.93 | $1,193.53 | $1,610.46 | $286,030.97 |
| Total for Year 3 | $4,890.52 | $14,435.00 | ||
| 37 | $418.66 | $1,191.80 | $1,610.46 | $285,612.31 |
| 38 | $420.41 | $1,190.05 | $1,610.46 | $285,191.90 |
| 39 | $422.16 | $1,188.30 | $1,610.46 | $284,769.74 |
| 40 | $423.92 | $1,186.54 | $1,610.46 | $284,345.82 |
| 41 | $425.69 | $1,184.77 | $1,610.46 | $283,920.13 |
| 42 | $427.46 | $1,183.00 | $1,610.46 | $283,492.67 |
| 43 | $429.24 | $1,181.22 | $1,610.46 | $283,063.43 |
| 44 | $431.03 | $1,179.43 | $1,610.46 | $282,632.40 |
| 45 | $432.82 | $1,177.64 | $1,610.46 | $282,199.58 |
| 46 | $434.63 | $1,175.83 | $1,610.46 | $281,764.95 |
| 47 | $436.44 | $1,174.02 | $1,610.46 | $281,328.51 |
| 48 | $438.26 | $1,172.20 | $1,610.46 | $280,890.25 |
| Total for Year 4 | $5,140.72 | $14,184.80 | ||
| 49 | $440.08 | $1,170.38 | $1,610.46 | $280,450.17 |
| 50 | $441.92 | $1,168.54 | $1,610.46 | $280,008.25 |
| 51 | $443.76 | $1,166.70 | $1,610.46 | $279,564.49 |
| 52 | $445.61 | $1,164.85 | $1,610.46 | $279,118.88 |
| 53 | $447.46 | $1,163.00 | $1,610.46 | $278,671.42 |
| 54 | $449.33 | $1,161.13 | $1,610.46 | $278,222.09 |
| 55 | $451.20 | $1,159.26 | $1,610.46 | $277,770.89 |
| 56 | $453.08 | $1,157.38 | $1,610.46 | $277,317.81 |
| 57 | $454.97 | $1,155.49 | $1,610.46 | $276,862.84 |
| 58 | $456.86 | $1,153.60 | $1,610.46 | $276,405.98 |
| 59 | $458.77 | $1,151.69 | $1,610.46 | $275,947.21 |
| 60 | $460.68 | $1,149.78 | $1,610.46 | $275,486.53 |
| Total for Year 5 | $5,403.72 | $13,921.80 | ||
| 61 | $462.60 | $1,147.86 | $1,610.46 | $275,023.93 |
| 62 | $464.53 | $1,145.93 | $1,610.46 | $274,559.40 |
| 63 | $466.46 | $1,144.00 | $1,610.46 | $274,092.94 |
| 64 | $468.41 | $1,142.05 | $1,610.46 | $273,624.53 |
| 65 | $470.36 | $1,140.10 | $1,610.46 | $273,154.17 |
| 66 | $472.32 | $1,138.14 | $1,610.46 | $272,681.85 |
| 67 | $474.29 | $1,136.17 | $1,610.46 | $272,207.56 |
| 68 | $476.26 | $1,134.20 | $1,610.46 | $271,731.30 |
| 69 | $478.25 | $1,132.21 | $1,610.46 | $271,253.05 |
| 70 | $480.24 | $1,130.22 | $1,610.46 | $270,772.81 |
| 71 | $482.24 | $1,128.22 | $1,610.46 | $270,290.57 |
| 72 | $484.25 | $1,126.21 | $1,610.46 | $269,806.32 |
| Total for Year 6 | $5,680.21 | $13,645.31 | ||
| 73 | $486.27 | $1,124.19 | $1,610.46 | $269,320.05 |
| 74 | $488.29 | $1,122.17 | $1,610.46 | $268,831.76 |
| 75 | $490.33 | $1,120.13 | $1,610.46 | $268,341.43 |
| 76 | $492.37 | $1,118.09 | $1,610.46 | $267,849.06 |
| 77 | $494.42 | $1,116.04 | $1,610.46 | $267,354.64 |
| 78 | $496.48 | $1,113.98 | $1,610.46 | $266,858.16 |
| 79 | $498.55 | $1,111.91 | $1,610.46 | $266,359.61 |
| 80 | $500.63 | $1,109.83 | $1,610.46 | $265,858.98 |
| 81 | $502.71 | $1,107.75 | $1,610.46 | $265,356.27 |
| 82 | $504.81 | $1,105.65 | $1,610.46 | $264,851.46 |
| 83 | $506.91 | $1,103.55 | $1,610.46 | $264,344.55 |
| 84 | $509.02 | $1,101.44 | $1,610.46 | $263,835.53 |
| Total for Year 7 | $5,970.79 | $13,354.73 | ||
| 85 | $511.15 | $1,099.31 | $1,610.46 | $263,324.38 |
| 86 | $513.28 | $1,097.18 | $1,610.46 | $262,811.10 |
| 87 | $515.41 | $1,095.05 | $1,610.46 | $262,295.69 |
| 88 | $517.56 | $1,092.90 | $1,610.46 | $261,778.13 |
| 89 | $519.72 | $1,090.74 | $1,610.46 | $261,258.41 |
| 90 | $521.88 | $1,088.58 | $1,610.46 | $260,736.53 |
| 91 | $524.06 | $1,086.40 | $1,610.46 | $260,212.47 |
| 92 | $526.24 | $1,084.22 | $1,610.46 | $259,686.23 |
| 93 | $528.43 | $1,082.03 | $1,610.46 | $259,157.80 |
| 94 | $530.64 | $1,079.82 | $1,610.46 | $258,627.16 |
| 95 | $532.85 | $1,077.61 | $1,610.46 | $258,094.31 |
| 96 | $535.07 | $1,075.39 | $1,610.46 | $257,559.24 |
| Total for Year 8 | $6,276.29 | $13,049.23 | ||
| 97 | $537.30 | $1,073.16 | $1,610.46 | $257,021.94 |
| 98 | $539.54 | $1,070.92 | $1,610.46 | $256,482.40 |
| 99 | $541.78 | $1,068.68 | $1,610.46 | $255,940.62 |
| 100 | $544.04 | $1,066.42 | $1,610.46 | $255,396.58 |
| 101 | $546.31 | $1,064.15 | $1,610.46 | $254,850.27 |
| 102 | $548.58 | $1,061.88 | $1,610.46 | $254,301.69 |
| 103 | $550.87 | $1,059.59 | $1,610.46 | $253,750.82 |
| 104 | $553.16 | $1,057.30 | $1,610.46 | $253,197.66 |
| 105 | $555.47 | $1,054.99 | $1,610.46 | $252,642.19 |
| 106 | $557.78 | $1,052.68 | $1,610.46 | $252,084.41 |
| 107 | $560.11 | $1,050.35 | $1,610.46 | $251,524.30 |
| 108 | $562.44 | $1,048.02 | $1,610.46 | $250,961.86 |
| Total for Year 9 | $6,597.38 | $12,728.14 | ||
| 109 | $564.79 | $1,045.67 | $1,610.46 | $250,397.07 |
| 110 | $567.14 | $1,043.32 | $1,610.46 | $249,829.93 |
| 111 | $569.50 | $1,040.96 | $1,610.46 | $249,260.43 |
| 112 | $571.87 | $1,038.59 | $1,610.46 | $248,688.56 |
| 113 | $574.26 | $1,036.20 | $1,610.46 | $248,114.30 |
| 114 | $576.65 | $1,033.81 | $1,610.46 | $247,537.65 |
| 115 | $579.05 | $1,031.41 | $1,610.46 | $246,958.60 |
| 116 | $581.47 | $1,028.99 | $1,610.46 | $246,377.13 |
| 117 | $583.89 | $1,026.57 | $1,610.46 | $245,793.24 |
| 118 | $586.32 | $1,024.14 | $1,610.46 | $245,206.92 |
| 119 | $588.76 | $1,021.70 | $1,610.46 | $244,618.16 |
| 120 | $591.22 | $1,019.24 | $1,610.46 | $244,026.94 |
| Total for Year 10 | $6,934.92 | $12,390.60 | ||
| 121 | $593.68 | $1,016.78 | $1,610.46 | $243,433.26 |
| 122 | $596.15 | $1,014.31 | $1,610.46 | $242,837.11 |
| 123 | $598.64 | $1,011.82 | $1,610.46 | $242,238.47 |
| 124 | $601.13 | $1,009.33 | $1,610.46 | $241,637.34 |
| 125 | $603.64 | $1,006.82 | $1,610.46 | $241,033.70 |
| 126 | $606.15 | $1,004.31 | $1,610.46 | $240,427.55 |
| 127 | $608.68 | $1,001.78 | $1,610.46 | $239,818.87 |
| 128 | $611.21 | $999.25 | $1,610.46 | $239,207.66 |
| 129 | $613.76 | $996.70 | $1,610.46 | $238,593.90 |
| 130 | $616.32 | $994.14 | $1,610.46 | $237,977.58 |
| 131 | $618.89 | $991.57 | $1,610.46 | $237,358.69 |
| 132 | $621.47 | $988.99 | $1,610.46 | $236,737.22 |
| Total for Year 11 | $7,289.72 | $12,035.80 | ||
| 133 | $624.05 | $986.41 | $1,610.46 | $236,113.17 |
| 134 | $626.66 | $983.80 | $1,610.46 | $235,486.51 |
| 135 | $629.27 | $981.19 | $1,610.46 | $234,857.24 |
| 136 | $631.89 | $978.57 | $1,610.46 | $234,225.35 |
| 137 | $634.52 | $975.94 | $1,610.46 | $233,590.83 |
| 138 | $637.16 | $973.30 | $1,610.46 | $232,953.67 |
| 139 | $639.82 | $970.64 | $1,610.46 | $232,313.85 |
| 140 | $642.49 | $967.97 | $1,610.46 | $231,671.36 |
| 141 | $645.16 | $965.30 | $1,610.46 | $231,026.20 |
| 142 | $647.85 | $962.61 | $1,610.46 | $230,378.35 |
| 143 | $650.55 | $959.91 | $1,610.46 | $229,727.80 |
| 144 | $653.26 | $957.20 | $1,610.46 | $229,074.54 |
| Total for Year 12 | $7,662.68 | $11,662.84 | ||
| 145 | $655.98 | $954.48 | $1,610.46 | $228,418.56 |
| 146 | $658.72 | $951.74 | $1,610.46 | $227,759.84 |
| 147 | $661.46 | $949.00 | $1,610.46 | $227,098.38 |
| 148 | $664.22 | $946.24 | $1,610.46 | $226,434.16 |
| 149 | $666.98 | $943.48 | $1,610.46 | $225,767.18 |
| 150 | $669.76 | $940.70 | $1,610.46 | $225,097.42 |
| 151 | $672.55 | $937.91 | $1,610.46 | $224,424.87 |
| 152 | $675.36 | $935.10 | $1,610.46 | $223,749.51 |
| 153 | $678.17 | $932.29 | $1,610.46 | $223,071.34 |
| 154 | $681.00 | $929.46 | $1,610.46 | $222,390.34 |
| 155 | $683.83 | $926.63 | $1,610.46 | $221,706.51 |
| 156 | $686.68 | $923.78 | $1,610.46 | $221,019.83 |
| Total for Year 13 | $8,054.71 | $11,270.81 | ||
| 157 | $689.54 | $920.92 | $1,610.46 | $220,330.29 |
| 158 | $692.42 | $918.04 | $1,610.46 | $219,637.87 |
| 159 | $695.30 | $915.16 | $1,610.46 | $218,942.57 |
| 160 | $698.20 | $912.26 | $1,610.46 | $218,244.37 |
| 161 | $701.11 | $909.35 | $1,610.46 | $217,543.26 |
| 162 | $704.03 | $906.43 | $1,610.46 | $216,839.23 |
| 163 | $706.96 | $903.50 | $1,610.46 | $216,132.27 |
| 164 | $709.91 | $900.55 | $1,610.46 | $215,422.36 |
| 165 | $712.87 | $897.59 | $1,610.46 | $214,709.49 |
| 166 | $715.84 | $894.62 | $1,610.46 | $213,993.65 |
| 167 | $718.82 | $891.64 | $1,610.46 | $213,274.83 |
| 168 | $721.81 | $888.65 | $1,610.46 | $212,553.02 |
| Total for Year 14 | $8,466.81 | $10,858.71 | ||
| 169 | $724.82 | $885.64 | $1,610.46 | $211,828.20 |
| 170 | $727.84 | $882.62 | $1,610.46 | $211,100.36 |
| 171 | $730.88 | $879.58 | $1,610.46 | $210,369.48 |
| 172 | $733.92 | $876.54 | $1,610.46 | $209,635.56 |
| 173 | $736.98 | $873.48 | $1,610.46 | $208,898.58 |
| 174 | $740.05 | $870.41 | $1,610.46 | $208,158.53 |
| 175 | $743.13 | $867.33 | $1,610.46 | $207,415.40 |
| 176 | $746.23 | $864.23 | $1,610.46 | $206,669.17 |
| 177 | $749.34 | $861.12 | $1,610.46 | $205,919.83 |
| 178 | $752.46 | $858.00 | $1,610.46 | $205,167.37 |
| 179 | $755.60 | $854.86 | $1,610.46 | $204,411.77 |
| 180 | $758.74 | $851.72 | $1,610.46 | $203,653.03 |
| Total for Year 15 | $8,899.99 | $10,425.53 | ||
| 181 | $761.91 | $848.55 | $1,610.46 | $202,891.12 |
| 182 | $765.08 | $845.38 | $1,610.46 | $202,126.04 |
| 183 | $768.27 | $842.19 | $1,610.46 | $201,357.77 |
| 184 | $771.47 | $838.99 | $1,610.46 | $200,586.30 |
| 185 | $774.68 | $835.78 | $1,610.46 | $199,811.62 |
| 186 | $777.91 | $832.55 | $1,610.46 | $199,033.71 |
| 187 | $781.15 | $829.31 | $1,610.46 | $198,252.56 |
| 188 | $784.41 | $826.05 | $1,610.46 | $197,468.15 |
| 189 | $787.68 | $822.78 | $1,610.46 | $196,680.47 |
| 190 | $790.96 | $819.50 | $1,610.46 | $195,889.51 |
| 191 | $794.25 | $816.21 | $1,610.46 | $195,095.26 |
| 192 | $797.56 | $812.90 | $1,610.46 | $194,297.70 |
| Total for Year 16 | $9,355.33 | $9,970.19 | ||
| 193 | $800.89 | $809.57 | $1,610.46 | $193,496.81 |
| 194 | $804.22 | $806.24 | $1,610.46 | $192,692.59 |
| 195 | $807.57 | $802.89 | $1,610.46 | $191,885.02 |
| 196 | $810.94 | $799.52 | $1,610.46 | $191,074.08 |
| 197 | $814.32 | $796.14 | $1,610.46 | $190,259.76 |
| 198 | $817.71 | $792.75 | $1,610.46 | $189,442.05 |
| 199 | $821.12 | $789.34 | $1,610.46 | $188,620.93 |
| 200 | $824.54 | $785.92 | $1,610.46 | $187,796.39 |
| 201 | $827.98 | $782.48 | $1,610.46 | $186,968.41 |
| 202 | $831.42 | $779.04 | $1,610.46 | $186,136.99 |
| 203 | $834.89 | $775.57 | $1,610.46 | $185,302.10 |
| 204 | $838.37 | $772.09 | $1,610.46 | $184,463.73 |
| Total for Year 17 | $9,833.97 | $9,491.55 | ||
| 205 | $841.86 | $768.60 | $1,610.46 | $183,621.87 |
| 206 | $845.37 | $765.09 | $1,610.46 | $182,776.50 |
| 207 | $848.89 | $761.57 | $1,610.46 | $181,927.61 |
| 208 | $852.43 | $758.03 | $1,610.46 | $181,075.18 |
| 209 | $855.98 | $754.48 | $1,610.46 | $180,219.20 |
| 210 | $859.55 | $750.91 | $1,610.46 | $179,359.65 |
| 211 | $863.13 | $747.33 | $1,610.46 | $178,496.52 |
| 212 | $866.72 | $743.74 | $1,610.46 | $177,629.80 |
| 213 | $870.34 | $740.12 | $1,610.46 | $176,759.46 |
| 214 | $873.96 | $736.50 | $1,610.46 | $175,885.50 |
| 215 | $877.60 | $732.86 | $1,610.46 | $175,007.90 |
| 216 | $881.26 | $729.20 | $1,610.46 | $174,126.64 |
| Total for Year 18 | $10,337.09 | $8,988.43 | ||
| 217 | $884.93 | $725.53 | $1,610.46 | $173,241.71 |
| 218 | $888.62 | $721.84 | $1,610.46 | $172,353.09 |
| 219 | $892.32 | $718.14 | $1,610.46 | $171,460.77 |
| 220 | $896.04 | $714.42 | $1,610.46 | $170,564.73 |
| 221 | $899.77 | $710.69 | $1,610.46 | $169,664.96 |
| 222 | $903.52 | $706.94 | $1,610.46 | $168,761.44 |
| 223 | $907.29 | $703.17 | $1,610.46 | $167,854.15 |
| 224 | $911.07 | $699.39 | $1,610.46 | $166,943.08 |
| 225 | $914.86 | $695.60 | $1,610.46 | $166,028.22 |
| 226 | $918.68 | $691.78 | $1,610.46 | $165,109.54 |
| 227 | $922.50 | $687.96 | $1,610.46 | $164,187.04 |
| 228 | $926.35 | $684.11 | $1,610.46 | $163,260.69 |
| Total for Year 19 | $10,865.95 | $8,459.57 | ||
| 229 | $930.21 | $680.25 | $1,610.46 | $162,330.48 |
| 230 | $934.08 | $676.38 | $1,610.46 | $161,396.40 |
| 231 | $937.97 | $672.49 | $1,610.46 | $160,458.43 |
| 232 | $941.88 | $668.58 | $1,610.46 | $159,516.55 |
| 233 | $945.81 | $664.65 | $1,610.46 | $158,570.74 |
| 234 | $949.75 | $660.71 | $1,610.46 | $157,620.99 |
| 235 | $953.71 | $656.75 | $1,610.46 | $156,667.28 |
| 236 | $957.68 | $652.78 | $1,610.46 | $155,709.60 |
| 237 | $961.67 | $648.79 | $1,610.46 | $154,747.93 |
| 238 | $965.68 | $644.78 | $1,610.46 | $153,782.25 |
| 239 | $969.70 | $640.76 | $1,610.46 | $152,812.55 |
| 240 | $973.74 | $636.72 | $1,610.46 | $151,838.81 |
| Total for Year 20 | $11,421.88 | $7,903.64 | ||
| 241 | $977.80 | $632.66 | $1,610.46 | $150,861.01 |
| 242 | $981.87 | $628.59 | $1,610.46 | $149,879.14 |
| 243 | $985.96 | $624.50 | $1,610.46 | $148,893.18 |
| 244 | $990.07 | $620.39 | $1,610.46 | $147,903.11 |
| 245 | $994.20 | $616.26 | $1,610.46 | $146,908.91 |
| 246 | $998.34 | $612.12 | $1,610.46 | $145,910.57 |
| 247 | $1,002.50 | $607.96 | $1,610.46 | $144,908.07 |
| 248 | $1,006.68 | $603.78 | $1,610.46 | $143,901.39 |
| 249 | $1,010.87 | $599.59 | $1,610.46 | $142,890.52 |
| 250 | $1,015.08 | $595.38 | $1,610.46 | $141,875.44 |
| 251 | $1,019.31 | $591.15 | $1,610.46 | $140,856.13 |
| 252 | $1,023.56 | $586.90 | $1,610.46 | $139,832.57 |
| Total for Year 21 | $12,006.24 | $7,319.28 | ||
| 253 | $1,027.82 | $582.64 | $1,610.46 | $138,804.75 |
| 254 | $1,032.11 | $578.35 | $1,610.46 | $137,772.64 |
| 255 | $1,036.41 | $574.05 | $1,610.46 | $136,736.23 |
| 256 | $1,040.73 | $569.73 | $1,610.46 | $135,695.50 |
| 257 | $1,045.06 | $565.40 | $1,610.46 | $134,650.44 |
| 258 | $1,049.42 | $561.04 | $1,610.46 | $133,601.02 |
| 259 | $1,053.79 | $556.67 | $1,610.46 | $132,547.23 |
| 260 | $1,058.18 | $552.28 | $1,610.46 | $131,489.05 |
| 261 | $1,062.59 | $547.87 | $1,610.46 | $130,426.46 |
| 262 | $1,067.02 | $543.44 | $1,610.46 | $129,359.44 |
| 263 | $1,071.46 | $539.00 | $1,610.46 | $128,287.98 |
| 264 | $1,075.93 | $534.53 | $1,610.46 | $127,212.05 |
| Total for Year 22 | $12,620.52 | $6,705.00 | ||
| 265 | $1,080.41 | $530.05 | $1,610.46 | $126,131.64 |
| 266 | $1,084.91 | $525.55 | $1,610.46 | $125,046.73 |
| 267 | $1,089.43 | $521.03 | $1,610.46 | $123,957.30 |
| 268 | $1,093.97 | $516.49 | $1,610.46 | $122,863.33 |
| 269 | $1,098.53 | $511.93 | $1,610.46 | $121,764.80 |
| 270 | $1,103.11 | $507.35 | $1,610.46 | $120,661.69 |
| 271 | $1,107.70 | $502.76 | $1,610.46 | $119,553.99 |
| 272 | $1,112.32 | $498.14 | $1,610.46 | $118,441.67 |
| 273 | $1,116.95 | $493.51 | $1,610.46 | $117,324.72 |
| 274 | $1,121.61 | $488.85 | $1,610.46 | $116,203.11 |
| 275 | $1,126.28 | $484.18 | $1,610.46 | $115,076.83 |
| 276 | $1,130.97 | $479.49 | $1,610.46 | $113,945.86 |
| Total for Year 23 | $13,266.19 | $6,059.33 | ||
| 277 | $1,135.69 | $474.77 | $1,610.46 | $112,810.17 |
| 278 | $1,140.42 | $470.04 | $1,610.46 | $111,669.75 |
| 279 | $1,145.17 | $465.29 | $1,610.46 | $110,524.58 |
| 280 | $1,149.94 | $460.52 | $1,610.46 | $109,374.64 |
| 281 | $1,154.73 | $455.73 | $1,610.46 | $108,219.91 |
| 282 | $1,159.54 | $450.92 | $1,610.46 | $107,060.37 |
| 283 | $1,164.38 | $446.08 | $1,610.46 | $105,895.99 |
| 284 | $1,169.23 | $441.23 | $1,610.46 | $104,726.76 |
| 285 | $1,174.10 | $436.36 | $1,610.46 | $103,552.66 |
| 286 | $1,178.99 | $431.47 | $1,610.46 | $102,373.67 |
| 287 | $1,183.90 | $426.56 | $1,610.46 | $101,189.77 |
| 288 | $1,188.84 | $421.62 | $1,610.46 | $100,000.93 |
| Total for Year 24 | $13,944.93 | $5,380.59 | ||
| 289 | $1,193.79 | $416.67 | $1,610.46 | $98,807.14 |
| 290 | $1,198.76 | $411.70 | $1,610.46 | $97,608.38 |
| 291 | $1,203.76 | $406.70 | $1,610.46 | $96,404.62 |
| 292 | $1,208.77 | $401.69 | $1,610.46 | $95,195.85 |
| 293 | $1,213.81 | $396.65 | $1,610.46 | $93,982.04 |
| 294 | $1,218.87 | $391.59 | $1,610.46 | $92,763.17 |
| 295 | $1,223.95 | $386.51 | $1,610.46 | $91,539.22 |
| 296 | $1,229.05 | $381.41 | $1,610.46 | $90,310.17 |
| 297 | $1,234.17 | $376.29 | $1,610.46 | $89,076.00 |
| 298 | $1,239.31 | $371.15 | $1,610.46 | $87,836.69 |
| 299 | $1,244.47 | $365.99 | $1,610.46 | $86,592.22 |
| 300 | $1,249.66 | $360.80 | $1,610.46 | $85,342.56 |
| Total for Year 25 | $14,658.37 | $4,667.15 | ||
| 301 | $1,254.87 | $355.59 | $1,610.46 | $84,087.69 |
| 302 | $1,260.09 | $350.37 | $1,610.46 | $82,827.60 |
| 303 | $1,265.34 | $345.12 | $1,610.46 | $81,562.26 |
| 304 | $1,270.62 | $339.84 | $1,610.46 | $80,291.64 |
| 305 | $1,275.91 | $334.55 | $1,610.46 | $79,015.73 |
| 306 | $1,281.23 | $329.23 | $1,610.46 | $77,734.50 |
| 307 | $1,286.57 | $323.89 | $1,610.46 | $76,447.93 |
| 308 | $1,291.93 | $318.53 | $1,610.46 | $75,156.00 |
| 309 | $1,297.31 | $313.15 | $1,610.46 | $73,858.69 |
| 310 | $1,302.72 | $307.74 | $1,610.46 | $72,555.97 |
| 311 | $1,308.14 | $302.32 | $1,610.46 | $71,247.83 |
| 312 | $1,313.59 | $296.87 | $1,610.46 | $69,934.24 |
| Total for Year 26 | $15,408.32 | $3,917.20 | ||
| 313 | $1,319.07 | $291.39 | $1,610.46 | $68,615.17 |
| 314 | $1,324.56 | $285.90 | $1,610.46 | $67,290.61 |
| 315 | $1,330.08 | $280.38 | $1,610.46 | $65,960.53 |
| 316 | $1,335.62 | $274.84 | $1,610.46 | $64,624.91 |
| 317 | $1,341.19 | $269.27 | $1,610.46 | $63,283.72 |
| 318 | $1,346.78 | $263.68 | $1,610.46 | $61,936.94 |
| 319 | $1,352.39 | $258.07 | $1,610.46 | $60,584.55 |
| 320 | $1,358.02 | $252.44 | $1,610.46 | $59,226.53 |
| 321 | $1,363.68 | $246.78 | $1,610.46 | $57,862.85 |
| 322 | $1,369.36 | $241.10 | $1,610.46 | $56,493.49 |
| 323 | $1,375.07 | $235.39 | $1,610.46 | $55,118.42 |
| 324 | $1,380.80 | $229.66 | $1,610.46 | $53,737.62 |
| Total for Year 27 | $16,196.62 | $3,128.90 | ||
| 325 | $1,386.55 | $223.91 | $1,610.46 | $52,351.07 |
| 326 | $1,392.33 | $218.13 | $1,610.46 | $50,958.74 |
| 327 | $1,398.13 | $212.33 | $1,610.46 | $49,560.61 |
| 328 | $1,403.96 | $206.50 | $1,610.46 | $48,156.65 |
| 329 | $1,409.81 | $200.65 | $1,610.46 | $46,746.84 |
| 330 | $1,415.68 | $194.78 | $1,610.46 | $45,331.16 |
| 331 | $1,421.58 | $188.88 | $1,610.46 | $43,909.58 |
| 332 | $1,427.50 | $182.96 | $1,610.46 | $42,482.08 |
| 333 | $1,433.45 | $177.01 | $1,610.46 | $41,048.63 |
| 334 | $1,439.42 | $171.04 | $1,610.46 | $39,609.21 |
| 335 | $1,445.42 | $165.04 | $1,610.46 | $38,163.79 |
| 336 | $1,451.44 | $159.02 | $1,610.46 | $36,712.35 |
| Total for Year 28 | $17,025.27 | $2,300.25 | ||
| 337 | $1,457.49 | $152.97 | $1,610.46 | $35,254.86 |
| 338 | $1,463.56 | $146.90 | $1,610.46 | $33,791.30 |
| 339 | $1,469.66 | $140.80 | $1,610.46 | $32,321.64 |
| 340 | $1,475.79 | $134.67 | $1,610.46 | $30,845.85 |
| 341 | $1,481.94 | $128.52 | $1,610.46 | $29,363.91 |
| 342 | $1,488.11 | $122.35 | $1,610.46 | $27,875.80 |
| 343 | $1,494.31 | $116.15 | $1,610.46 | $26,381.49 |
| 344 | $1,500.54 | $109.92 | $1,610.46 | $24,880.95 |
| 345 | $1,506.79 | $103.67 | $1,610.46 | $23,374.16 |
| 346 | $1,513.07 | $97.39 | $1,610.46 | $21,861.09 |
| 347 | $1,519.37 | $91.09 | $1,610.46 | $20,341.72 |
| 348 | $1,525.70 | $84.76 | $1,610.46 | $18,816.02 |
| Total for Year 29 | $17,896.33 | $1,429.19 | ||
| 349 | $1,532.06 | $78.40 | $1,610.46 | $17,283.96 |
| 350 | $1,538.44 | $72.02 | $1,610.46 | $15,745.52 |
| 351 | $1,544.85 | $65.61 | $1,610.46 | $14,200.67 |
| 352 | $1,551.29 | $59.17 | $1,610.46 | $12,649.38 |
| 353 | $1,557.75 | $52.71 | $1,610.46 | $11,091.63 |
| 354 | $1,564.24 | $46.22 | $1,610.46 | $9,527.39 |
| 355 | $1,570.76 | $39.70 | $1,610.46 | $7,956.63 |
| 356 | $1,577.31 | $33.15 | $1,610.46 | $6,379.32 |
| 357 | $1,583.88 | $26.58 | $1,610.46 | $4,795.44 |
| 358 | $1,590.48 | $19.98 | $1,610.46 | $3,204.96 |
| 359 | $1,597.11 | $13.35 | $1,610.46 | $1,607.85 |
| 360 | $1,607.85 | $6.70 | $1,614.55 | $0.00 |
| Total for Year 30 | $18,816.02 | $513.59 | ||
| Total Paid | $300,000.00 | $279,769.69 | $579,769.69 |
Buying a home will probably be the biggest financial decision of your life. Make sure you understand your reference rate, margin & how your monthly loan payments might change in the worst case scenario before signing an ARM loan contract.
We offer a more in-depth guide to ARM loans & the CFPB published Consumer handbook on adjustable-rate mortgages, which offers consumers an introductory guide to ARM loans including a mortgage shopping worksheet. We've included an HTML version of their mortgage shopping worksheet below. You can also download this worksheet & bring it to your financial institution. We offer versions in the following formats: PDF, Word & Excel.
| Basic Loan Information | Fixed-Rate Mortgage | ARM 1 | ARM 2 | ARM 3 |
|---|---|---|---|---|
| Name of lender or broker & contact information | ||||
| Mortgage amount | ||||
| Loan term (e.g., 15 years, 30 years) | ||||
| Loan description (e.g., fixed rate, 3/1 ARM, payment-option ARM, interest-only ARM) |
||||
Basic Figures for Comparison |
Fixed-Rate Mortgage | ARM 1 | ARM 2 | ARM 3 |
| Fixed-rate mortgage interest rate and annual percentage rate (APR) (For graduated-payment or stepped-rate mortgages, use the ARM columns) |
||||
| ARM initial interest rate & APR How long does the initial rate apply? |
||||
| What will the interest rate be after the initial period? | ||||
| ARM Features How often can the interest rate adjust? |
||||
| What is the index and what is the current rate? | ||||
| How low could the interest rate go on this loan? | ||||
| What is the payment cap? | ||||
| Can this loan have negative amortization (that is, increase in size)? | ||||
| What is the limit to how much the balance can grow before the loan will be recalculated? | ||||
| Is there a prepayment penalty if I pay off this mortgage early? | ||||
| How long does the penalty last? How much is it? | ||||
| Is there a balloon payment on this mortgage? If so, what is the estimated amount and when would it be due? |
||||
| What are the estimated origination fees and charges for this loan? | ||||
Monthly Payment Amounts |
Fixed-Rate Mortgage | ARM 1 | ARM 2 | ARM 3 |
| What will the monthly payments be for the first year of the loan? | ||||
| Does this include taxes & insurance? Condo or homeowner's association fees? If not, what are the estimates for these amounts? |
||||
| What will my monthly payment be after 2 months if the index rate... ... stays the same? |
||||
| ...goes up 2%? | ||||
| ...goes down 2%? | ||||
| What is the most my minimum monthly payment could be after 1 year? | ||||
| What is the most my minimum monthly payment could be after 3 years? | ||||
| What is the most my minimum monthly payment could be after 5 years? |
For any home loan you are interested in the lender should be able to give you the above information before requiring you to pay any nonrefundable fees. If you remain uncertain after speaking with your lender, please consider contacting a local housing counselor or call the U.S. Department of Housing and Urban Development toll-free at 800-569-4287.
Explore conventional mortgages, FHA loans, USDA loans, and VA loans to find out which option is right for you.
Check your options with a trusted El Monte lender.
Answer a few questions below and connect with a lender who can help you save today!