
On November 25, 2025 the Federal Housing Finance Agency (FHFA) raised the 2026 conforming loan limit on single family homes from $806,500 to $832,750 - an increase of $26,250 or 3.26%. That rate is the baseline limit for areas of the country where homes are fairly affordable. In higher-cost areas like San Francisco or New York City the single-family home loan limit can go as high as $1,249,125.
Here is an overview of the 2026 limits based on the number of units in a building. Limits in the third row apply to Alaska, Guam, Virgin Islands, Washington D.C & Hawaii.
| Units | 1 | 2 | 3 | 4 |
|---|---|---|---|---|
| Continental U.S. Baseline | $832,750 | $1,066,250 | $1,288,800 | $1,601,750 |
| Designated High-cost Areas | $1,249,125 | $1,599,375 | $1,933,200 | $2,402,625 |
| Alaska, Hawaii, Guam & U.S. Virgin Islands | $1,249,125 | $1,599,375 | $1,933,200 | $2,402,625 |
| Kalawao & Maui counties | $1,299,500 | $1,663,600 | $2,010,950 | $2,499,100 |
Across the continental United States & other U.S. territories the breakdown of the above limits is as follows.
| Limit | Counties | Info |
|---|---|---|
| Low limit | 3,075 | Includes 2,988 continental counties along with Puerto Rico, American Samoa and the Northern Mariana Islands |
| In between | 83 | |
| High limit | 77* | 72* counties plus Washington, D.C., Guam, and the U.S. Virgin Islands |
| Kalawao & Maui counties | 2 | The single-family limit was set to $1,299,500 in these 2 counties |
* In the above table Kalawao & Maui counties are considered as part of the "high limit" counties, as they have never been broken out specifically in prior years the way they are in the 2026 limits.
Loans for amounts above the current conforming rates are considered jumbo mortgages. Jumbo loans typically require a higher credit score & a larger downpayment than conforming loans. It is also quite common for jumbo loans to charge slightly higher interest rates.
The conforming loan limits historically have also applied to other government-backed housing programs.
1
The FHA set the floor at ($541,287) while setting their ceiling at $1,249,125. Those FHA loan amounts correspond to 65% of the baseline conforming limit & 100% of the high-cost area conforming limit.
2
The U.S Department of Veterans Affairs does not cap VA loan amounts. Historically they used the conforming loan limits to determine the maximium amount of liability they can assume, which means loans above those amounts would typically require a pro-rated cash downpayment from the borrower. The Blue Water Navy Vietnam Veterans Act of 2019 did away with VA loan limit for those who do not have a current outstanding VA loan & have never defaulted on a VA loan.
3
The HECM reverse mortgage maximum claim amount is set to $1,249,125, which is the 150% of the baseline conforming mortgage limit.
The United States federal government subsidizes homeownership to help make homes affordable. One of the means by which they help subsidize homes is through government-sponsored enterprises (GSE) Fannie Mae & Freddie Mac. These companies package & securitize home loans from other loan originators. This creates a bond-like intrument called mortgage backed securities (MBS) which enables institutional investors to invest in the real estate market. This, in turn, add liquidity to the marketplace and lowers mortgage rates.


The securitized market enables homeowners to lock in low fixed rates for extend period of time, with the 30-year fixed being the most popular loan option. For your conveniece, here is a table of current fixed mortgage rates in your local area.
In most countries (outside the United States) home loans are usually structured as variable or adjustable rate loans which rise and fall as market conditions change. The benefit of fixed rates is it allows homeowners to build their family budget using a plan for stable payments for an extended period of time while improving price stability across the broader housing market & overall economy. Countries where variable rate loans are more common see far larger shifts in housing prices as interest rates change. For example, in 1997 Hong Kong property prices fell by 70%.
The United States economy is heavily reliant on the consumer and is heavily debt levered. During periods of economic instability in the United States the Federal Reserve buys large quantities of Treasuries and MBS to hold down interest rates and add liquidity to the marketplace. On March 3, 2020 the Federal Reserve Open Market Committee (FMOC) cut the Fed Funds Rate 50 basis points to the range of 1 to 1.25%. On March 16, 2020 the FOMC lowered the Fed Funds Rate another 100 basis points to a range of 0 to 0.25%. In the 4-month period after the COVID-19 crisis hit the Federal Reserve not only slashed the Fed Funds Rate twice to zero but they also expanded their balance sheet by $3 trillion dollars to over $7 trillion. A number of factors have led to 2020 being a record year for mortgage volume with Fannie Mae projecting $4.1 trillion in total loan volume.

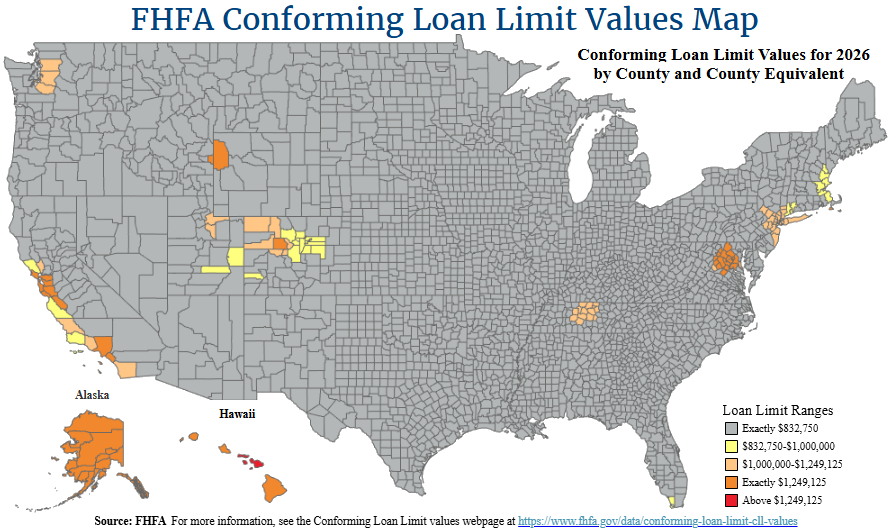
The FHFA offers an interactive map of conforming limits by county. A static version of the map is included below, followed by state-by-state tables of county-level data
Here is state-by-state data for areas where the county limit excedes the baseline loan limit range. For all other areas of the country the besline limits apply. You can also download this data in PDF or XLS formats.

Click on your state to get today's best rates and prequalify for your mortgage!
Here is state by state data for areas where the limit excedes the baseline loan limit range. For all other areas of the country the above listed limits apply.
| County | 5-Digit County Code | 1 Unit Limit | 2 Unit Limit | 3 Unit Limit | 4 Unit Limit |
|---|---|---|---|---|---|
| All | 02013 - 02290 | $1,249,125 | $1,599,375 | $1,933,200 | $2,402,625 |
| County | 5-Digit County Code | Metropolitan Area | 1 Unit Limit | 2 Unit Limit | 3 Unit Limit | 4 Unit Limit |
|---|---|---|---|---|---|---|
| Alameda | 06001 | San Francisco-Oakland-Hayward, Ca | $1,249,125 | $1,599,375 | $1,933,200 | $2,402,625 |
| Contra Costa | 06013 | San Francisco-Oakland-Hayward, Ca | $1,249,125 | $1,599,375 | $1,933,200 | $2,402,625 |
| Los Angeles | 06037 | Los Angeles-Long Beach-Anaheim, Ca | $1,249,125 | $1,599,375 | $1,933,200 | $2,402,625 |
| Marin | 06041 | San Francisco-Oakland-Hayward, Ca | $1,249,125 | $1,599,375 | $1,933,200 | $2,402,625 |
| Monterey | 06053 | Salinas, Ca | $994,750 | $1,273,450 | $1,539,350 | $1,913,000 |
| Napa | 06055 | Napa, Ca | $1,017,750 | $1,302,900 | $1,574,900 | $1,957,250 |
| Orange | 06059 | Los Angeles-Long Beach-Anaheim, Ca | $1,249,125 | $1,599,375 | $1,933,200 | $2,402,625 |
| San Benito | 06069 | San Jose-Sunnyvale-Santa Clara, Ca | $1,249,125 | $1,599,375 | $1,933,200 | $2,402,625 |
| San Diego | 06073 | San Diego-Carlsbad, Ca | $1,104,000 | $1,413,350 | $1,708,400 | $2,123,100 |
| San Francisco | 06075 | San Francisco-Oakland-Hayward, Ca | $1,249,125 | $1,599,375 | $1,933,200 | $2,402,625 |
| San Luis Obispo | 06079 | San Luis Obispo-Paso Robles-Arroyo Gran | $1,000,500 | $1,280,850 | $1,548,250 | $1,924,100 |
| San Mateo | 06081 | San Francisco-Oakland-Hayward, Ca | $1,249,125 | $1,599,375 | $1,933,200 | $2,402,625 |
| Santa Barbara | 06083 | Santa Maria-Santa Barbara, Ca | $941,850 | $1,205,750 | $1,457,450 | $1,811,300 |
| Santa Clara | 06085 | San Jose-Sunnyvale-Santa Clara, Ca | $1,249,125 | $1,599,375 | $1,933,200 | $2,402,625 |
| Santa Cruz | 06087 | Santa Cruz-Watsonville, Ca | $1,249,125 | $1,599,375 | $1,933,200 | $2,402,625 |
| Sonoma | 06097 | Santa Rosa, Ca | $897,000 | $1,148,350 | $1,388,050 | $1,725,050 |
| Ventura | 06111 | Oxnard-Thousand Oaks-Ventura, Ca | $1,035,000 | $1,325,000 | $1,601,600 | $1,990,450 |
| County | 5-Digit County Code | Metropolitan Area | 1 Unit Limit | 2 Unit Limit | 3 Unit Limit | 4 Unit Limit |
|---|---|---|---|---|---|---|
| Adams | 08001 | Denver-Aurora-Lakewood, Co | $862,500 | $1,104,150 | $1,334,700 | $1,658,700 |
| Arapahoe | 08005 | Denver-Aurora-Lakewood, Co | $862,500 | $1,104,150 | $1,334,700 | $1,658,700 |
| Boulder | 08013 | Boulder, Co | $879,750 | $1,126,250 | $1,361,350 | $1,691,850 |
| Broomfield | 08014 | Denver-Aurora-Lakewood, Co | $862,500 | $1,104,150 | $1,334,700 | $1,658,700 |
| Clear Creek | 08019 | Denver-Aurora-Lakewood, Co | $862,500 | $1,104,150 | $1,334,700 | $1,658,700 |
| Denver | 08031 | Denver-Aurora-Lakewood, Co | $862,500 | $1,104,150 | $1,334,700 | $1,658,700 |
| Douglas | 08035 | Denver-Aurora-Lakewood, Co | $862,500 | $1,104,150 | $1,334,700 | $1,658,700 |
| Eagle | 08037 | Edwards, Co | $1,249,125 | $1,599,375 | $1,933,200 | $2,402,625 |
| Elbert | 08039 | Denver-Aurora-Lakewood, Co | $862,500 | $1,104,150 | $1,334,700 | $1,658,700 |
| Garfield | 08045 | Glenwood Springs, Co | $1,209,750 | $1,548,975 | $1,872,225 | $2,326,875 |
| Gilpin | 08047 | Denver-Aurora-Lakewood, Co | $862,500 | $1,104,150 | $1,334,700 | $1,658,700 |
| Grand | 08049 | Denver-Aurora-Lakewood, Co | $883,200 | $1,130,650 | $1,366,700 | $1,698,500 |
| Jefferson | 08059 | Denver-Aurora-Lakewood, Co | $862,500 | $1,104,150 | $1,334,700 | $1,658,700 |
| Lake | 08065 | Non-Metro | $1,092,500 | $1,398,600 | $1,690,600 | $2,101,000 |
| Moffat | 08081 | Non-Metro | $1,089,050 | $1,394,200 | $1,685,250 | $2,094,350 |
| Park | 08093 | Denver-Aurora-Lakewood, Co | $862,500 | $1,104,150 | $1,334,700 | $1,658,700 |
| Pitkin | 08097 | Glenwood Springs, Co | $1,209,750 | $1,548,975 | $1,872,225 | $2,326,875 |
| Routt | 08107 | Steamboat Springs, Co | $1,089,050 | $1,394,200 | $1,685,250 | $2,094,350 |
| San Miguel | 08113 | Non-Metro | $994,750 | $1,273,450 | $1,539,350 | $1,913,000 |
| Summit | 08117 | Breckenridge, Co | $1,092,500 | $1,398,600 | $1,690,600 | $2,101,000 |
| County | 5-Digit County Code | Metropolitan Area | 1 Unit Limit | 2 Unit Limit | 3 Unit Limit | 4 Unit Limit |
|---|---|---|---|---|---|---|
| Greater Bridgeport Planning Region | 09120 | Bridgeport–Stamford–Norwalk | $977,500 | $1,251,400 | $1,512,650 | $1,879,850 |
| Naugatuck Valley Planning Region | 09140 | Greater Hartford | $851,000 | $1,089,450 | $1,316,900 | $1,636,550 |
| Western Connecticut Planning Region | 09190 | Bridgeport–Stamford–Norwalk | $977,500 | $1,251,400 | $1,512,650 | $1,879,850 |
| County | 5-Digit County Code | 1 Unit Limit | 2 Unit Limit | 3 Unit Limit | 4 Unit Limit |
|---|---|---|---|---|---|
| N/A | 11001 | $1,249,125 | $1,599,375 | $1,933,200 | $2,402,625 |
| County | 5-Digit County Code | Metropolitan Area | 1 Unit Limit | 2 Unit Limit | 3 Unit Limit | 4 Unit Limit |
|---|---|---|---|---|---|---|
| Monroe | 12087 | Key West, Fl | $990,150 | $1,267,600 | $1,532,200 | $1,904,150 |
| County | 5-Digit County Code | Metropolitan Area | 1 Unit Limit | 2 Unit Limit | 3 Unit Limit | 4 Unit Limit |
|---|---|---|---|---|---|---|
| Hawaii | 15001 | Hilo, Hi | $1,249,125 | $1,599,375 | $1,933,200 | $2,402,625 |
| Honolulu | 15003 | Urban Honolulu, Hi | $1,249,125 | $1,599,375 | $1,933,200 | $2,402,625 |
| Kalawao | 15005 | Kahului-Wailuku-Lahaina, Hi | $1,299,500 | $1,663,600 | $2,010,950 | $2,499,100 |
| Kauai | 15007 | Kapaa, Hi | $1,249,125 | $1,599,375 | $1,933,200 | $2,402,625 |
| Maui | 15009 | Kahului-Wailuku-Lahaina, Hi | $1,299,500 | $1,663,600 | $2,010,950 | $2,499,100 |
| County | 5-Digit County Code | Metropolitan Area | 1 Unit Limit | 2 Unit Limit | 3 Unit Limit | 4 Unit Limit |
|---|---|---|---|---|---|---|
| Teton | 16081 | Jackson, Wy-Id | $1,249,125 | $1,599,375 | $1,933,200 | $2,402,625 |
| County | 5-Digit County Code | Metropolitan Area | 1 Unit Limit | 2 Unit Limit | 3 Unit Limit | 4 Unit Limit |
|---|---|---|---|---|---|---|
| Calvert | 24009 | Washington-Arlington-Alexandria, Dc-Va- | $1,209,750 | $1,548,975 | $1,872,225 | $2,326,875 |
| Charles | 24017 | Washington-Arlington-Alexandria, Dc-Va- | $1,249,125 | $1,599,375 | $1,933,200 | $2,402,625 |
| Frederick | 24021 | Washington-Arlington-Alexandria, Dc-Va- | $1,249,125 | $1,599,375 | $1,933,200 | $2,402,625 |
| Montgomery | 24031 | Washington-Arlington-Alexandria, Dc-Va- | $1,249,125 | $1,599,375 | $1,933,200 | $2,402,625 |
| Prince George's | 24033 | Washington-Arlington-Alexandria, Dc-Va- | $1,249,125 | $1,599,375 | $1,933,200 | $2,402,625 |
| County | 5-Digit County Code | Metropolitan Area | 1 Unit Limit | 2 Unit Limit | 3 Unit Limit | 4 Unit Limit |
|---|---|---|---|---|---|---|
| Dukes | 25007 | Vineyard Haven, Ma | $1,249,125 | $1,599,375 | $1,933,200 | $2,402,625 |
| Essex | 25009 | Boston-Cambridge-Newton, Ma-Nh | $962,550 | $1,232,250 | $1,489,500 | $1,851,100 |
| Middlesex | 25017 | Boston-Cambridge-Newton, Ma-Nh | $962,550 | $1,232,250 | $1,489,500 | $1,851,100 |
| Nantucket | 25019 | Non-Metro | $1,249,125 | $1,599,375 | $1,933,200 | $2,402,625 |
| Norfolk | 25021 | Boston-Cambridge-Newton, Ma-Nh | $962,550 | $1,232,250 | $1,489,500 | $1,851,100 |
| Plymouth | 25023 | Boston-Cambridge-Newton, Ma-Nh | $962,550 | $1,232,250 | $1,489,500 | $1,851,100 |
| Suffolk | 25025 | Boston-Cambridge-Newton, Ma-Nh | $962,550 | $1,232,250 | $1,489,500 | $1,851,100 |
| County | 5-Digit County Code | Metropolitan Area | 1 Unit Limit | 2 Unit Limit | 3 Unit Limit | 4 Unit Limit |
|---|---|---|---|---|---|---|
| Rockingham | 33015 | Boston-Cambridge-Newton, Ma-Nh | $962,550 | $1,232,250 | $1,489,500 | $1,851,100 |
| Strafford | 33017 | Boston-Cambridge-Newton, Ma-Nh | $962,550 | $1,232,250 | $1,489,500 | $1,851,100 |
| County | 5-Digit County Code | Metropolitan Area | 1 Unit Limit | 2 Unit Limit | 3 Unit Limit | 4 Unit Limit |
|---|---|---|---|---|---|---|
| Bergen | 34003 | New York-Newark-Jersey City, Ny-Nj-Pa | $1,209,750 | $1,548,975 | $1,872,225 | $2,326,875 |
| Essex | 34013 | New York-Newark-Jersey City, Ny-Nj-Pa | $1,209,750 | $1,548,975 | $1,872,225 | $2,326,875 |
| Hudson | 34017 | New York-Newark-Jersey City, Ny-Nj-Pa | $1,209,750 | $1,548,975 | $1,872,225 | $2,326,875 |
| Hunterdon | 34019 | New York-Newark-Jersey City, Ny-Nj-Pa | $1,209,750 | $1,548,975 | $1,872,225 | $2,326,875 |
| Middlesex | 34023 | New York-Newark-Jersey City, Ny-Nj-Pa | $1,209,750 | $1,548,975 | $1,872,225 | $2,326,875 |
| Monmouth | 34025 | New York-Newark-Jersey City, Ny-Nj-Pa | $1,209,750 | $1,548,975 | $1,872,225 | $2,326,875 |
| Morris | 34027 | New York-Newark-Jersey City, Ny-Nj-Pa | $1,209,750 | $1,548,975 | $1,872,225 | $2,326,875 |
| Ocean | 34029 | New York-Newark-Jersey City, Ny-Nj-Pa | $1,209,750 | $1,548,975 | $1,872,225 | $2,326,875 |
| Passaic | 34031 | New York-Newark-Jersey City, Ny-Nj-Pa | $1,209,750 | $1,548,975 | $1,872,225 | $2,326,875 |
| Somerset | 34035 | New York-Newark-Jersey City, Ny-Nj-Pa | $1,209,750 | $1,548,975 | $1,872,225 | $2,326,875 |
| Sussex | 34037 | New York-Newark-Jersey City, Ny-Nj-Pa | $1,209,750 | $1,548,975 | $1,872,225 | $2,326,875 |
| Union | 34039 | New York-Newark-Jersey City, Ny-Nj-Pa | $1,209,750 | $1,548,975 | $1,872,225 | $2,326,875 |
| County | 5-Digit County Code | Metropolitan Area | 1 Unit Limit | 2 Unit Limit | 3 Unit Limit | 4 Unit Limit |
|---|---|---|---|---|---|---|
| Bronx | 36005 | New York-Newark-Jersey City, Ny-Nj-Pa | $1,209,750 | $1,548,975 | $1,872,225 | $2,326,875 |
| Kings | 36047 | New York-Newark-Jersey City, Ny-Nj-Pa | $1,209,750 | $1,548,975 | $1,872,225 | $2,326,875 |
| Nassau | 36059 | New York-Newark-Jersey City, Ny-Nj-Pa | $1,209,750 | $1,548,975 | $1,872,225 | $2,326,875 |
| New York | 36061 | New York-Newark-Jersey City, Ny-Nj-Pa | $1,209,750 | $1,548,975 | $1,872,225 | $2,326,875 |
| Putnam | 36079 | New York-Newark-Jersey City, Ny-Nj-Pa | $1,209,750 | $1,548,975 | $1,872,225 | $2,326,875 |
| Queens | 36081 | New York-Newark-Jersey City, Ny-Nj-Pa | $1,209,750 | $1,548,975 | $1,872,225 | $2,326,875 |
| Richmond | 36085 | New York-Newark-Jersey City, Ny-Nj-Pa | $1,209,750 | $1,548,975 | $1,872,225 | $2,326,875 |
| Rockland | 36087 | New York-Newark-Jersey City, Ny-Nj-Pa | $1,209,750 | $1,548,975 | $1,872,225 | $2,326,875 |
| Suffolk | 36103 | New York-Newark-Jersey City, Ny-Nj-Pa | $1,209,750 | $1,548,975 | $1,872,225 | $2,326,875 |
| Westchester | 36119 | New York-Newark-Jersey City, Ny-Nj-Pa | $1,209,750 | $1,548,975 | $1,872,225 | $2,326,875 |
| County | 5-Digit County Code | Metropolitan Area | 1 Unit Limit | 2 Unit Limit | 3 Unit Limit | 4 Unit Limit |
|---|---|---|---|---|---|---|
| Pike | 42103 | New York-Newark-Jersey City, Ny-Nj-Pa | $1,209,750 | $1,548,975 | $1,872,225 | $2,326,875 |
| County | 5-Digit County Code | Metropolitan Area | 1 Unit Limit | 2 Unit Limit | 3 Unit Limit | 4 Unit Limit |
|---|---|---|---|---|---|---|
| Cannon | 47015 | Nashville-Davidson--Murfreesboro--Frank | $1,029,250 | $1,317,650 | $1,592,700 | $1,979,350 |
| Cheatham | 47021 | Nashville-Davidson--Murfreesboro--Frank | $1,029,250 | $1,317,650 | $1,592,700 | $1,979,350 |
| Davidson | 47037 | Nashville-Davidson--Murfreesboro--Frank | $1,029,250 | $1,317,650 | $1,592,700 | $1,979,350 |
| Dickson | 47043 | Nashville-Davidson--Murfreesboro--Frank | $1,029,250 | $1,317,650 | $1,592,700 | $1,979,350 |
| Hickman | 47081 | Nashville-Davidson--Murfreesboro--Frank | $1,029,250 | $1,317,650 | $1,592,700 | $1,979,350 |
| Macon | 47111 | Nashville-Davidson--Murfreesboro--Frank | $1,029,250 | $1,317,650 | $1,592,700 | $1,979,350 |
| Maury | 47119 | Nashville-Davidson--Murfreesboro--Frank | $1,029,250 | $1,317,650 | $1,592,700 | $1,979,350 |
| Robertson | 47147 | Nashville-Davidson--Murfreesboro--Frank | $1,029,250 | $1,317,650 | $1,592,700 | $1,979,350 |
| Rutherford | 47149 | Nashville-Davidson--Murfreesboro--Frank | $1,029,250 | $1,317,650 | $1,592,700 | $1,979,350 |
| Smith | 47159 | Nashville-Davidson--Murfreesboro--Frank | $1,029,250 | $1,317,650 | $1,592,700 | $1,979,350 |
| Sumner | 47165 | Nashville-Davidson--Murfreesboro--Frank | $1,029,250 | $1,317,650 | $1,592,700 | $1,979,350 |
| Trousdale | 47169 | Nashville-Davidson--Murfreesboro--Frank | $1,029,250 | $1,317,650 | $1,592,700 | $1,979,350 |
| Williamson | 47187 | Nashville-Davidson--Murfreesboro--Frank | $1,029,250 | $1,317,650 | $1,592,700 | $1,979,350 |
| Wilson | 47189 | Nashville-Davidson--Murfreesboro--Frank | $1,029,250 | $1,317,650 | $1,592,700 | $1,979,350 |
| County | 5-Digit County Code | Metropolitan Area | 1 Unit Limit | 2 Unit Limit | 3 Unit Limit | 4 Unit Limit |
|---|---|---|---|---|---|---|
| Grand | 49019 | Non-Metro | $839,500 | $1,074,700 | $1,299,100 | $1,614,450 |
| Summit | 49043 | Summit Park, Ut | $1,150,000 | $1,472,250 | $1,779,600 | $2,211,600 |
| Wasatch | 49051 | Salt Lake City, Ut | $1,150,000 | $1,472,250 | $1,779,600 | $2,211,600 |
| Weber | 49057 | Ogden–Clearfield, Ut | $997,050 | $1,276,400 | $1,542,900 | $1,917,450 |
| County / City | 5-Digit County Code | Metropolitan Area | 1 Unit Limit | 2 Unit Limit | 3 Unit Limit | 4 Unit Limit |
|---|---|---|---|---|---|---|
| Arlington | 51013 | Washington-Arlington-Alexandria, Dc-Va- | $1,249,125 | $1,599,375 | $1,933,200 | $2,402,625 |
| Clarke | 51043 | Washington-Arlington-Alexandria, Dc-Va- | $1,249,125 | $1,599,375 | $1,933,200 | $2,402,625 |
| Culpeper | 51047 | Washington-Arlington-Alexandria, Dc-Va- | $1,249,125 | $1,599,375 | $1,933,200 | $2,402,625 |
| Fairfax | 51059 | Washington-Arlington-Alexandria, Dc-Va- | $1,249,125 | $1,599,375 | $1,933,200 | $2,402,625 |
| Fauquier | 51061 | Washington-Arlington-Alexandria, Dc-Va- | $1,249,125 | $1,599,375 | $1,933,200 | $2,402,625 |
| Loudoun | 51107 | Washington-Arlington-Alexandria, Dc-Va- | $1,249,125 | $1,599,375 | $1,933,200 | $2,402,625 |
| Madison | 51113 | Non-Metro | $1,209,750 | $1,548,975 | $1,872,225 | $2,326,875 |
| Prince William | 51153 | Washington-Arlington-Alexandria, Dc-Va- | $1,249,125 | $1,599,375 | $1,933,200 | $2,402,625 |
| Rappahannock | 51157 | Washington-Arlington-Alexandria, Dc-Va- | $1,249,125 | $1,599,375 | $1,933,200 | $2,402,625 |
| Spotsylvania | 51177 | Washington-Arlington-Alexandria, Dc-Va- | $1,249,125 | $1,599,375 | $1,933,200 | $2,402,625 |
| Stafford | 51179 | Washington-Arlington-Alexandria, Dc-Va- | $1,249,125 | $1,599,375 | $1,933,200 | $2,402,625 |
| Warren | 51187 | Washington-Arlington-Alexandria, Dc-Va- | $1,249,125 | $1,599,375 | $1,933,200 | $2,402,625 |
| Alexandria City | 51510 | Washington-Arlington-Alexandria, Dc-Va- | $1,249,125 | $1,599,375 | $1,933,200 | $2,402,625 |
| Fairfax City | 51600 | Washington-Arlington-Alexandria, Dc-Va- | $1,249,125 | $1,599,375 | $1,933,200 | $2,402,625 |
| Falls Church City | 51610 | Washington-Arlington-Alexandria, Dc-Va- | $1,249,125 | $1,599,375 | $1,933,200 | $2,402,625 |
| Fredericksburg City | 51630 | Washington-Arlington-Alexandria, Dc-Va- | $1,249,125 | $1,599,375 | $1,933,200 | $2,402,625 |
| Manassas City | 51683 | Washington-Arlington-Alexandria, Dc-Va- | $1,249,125 | $1,599,375 | $1,933,200 | $2,402,625 |
| Manassas Park City | 51685 | Washington-Arlington-Alexandria, Dc-Va- | $1,249,125 | $1,599,375 | $1,933,200 | $2,402,625 |
| County | 5-Digit County Code | Metropolitan Area | 1 Unit Limit | 2 Unit Limit | 3 Unit Limit | 4 Unit Limit |
|---|---|---|---|---|---|---|
| King | 53033 | Seattle-Tacoma-Bellevue, Wa | $1,063,750 | $1,361,800 | $1,646,100 | $2,045,700 |
| Pierce | 53053 | Seattle-Tacoma-Bellevue, Wa | $1,063,750 | $1,361,800 | $1,646,100 | $2,045,700 |
| Snohomish | 53061 | Seattle-Tacoma-Bellevue, Wa | $1,063,750 | $1,361,800 | $1,646,100 | $2,045,700 |
| County | 5-Digit County Code | Metropolitan Area | 1 Unit Limit | 2 Unit Limit | 3 Unit Limit | 4 Unit Limit |
|---|---|---|---|---|---|---|
| Jefferson | 54037 | Washington-Arlington-Alexandria, Dc-Va- | $1,249,125 | $1,599,375 | $1,933,200 | $2,402,625 |
| County | 5-Digit County Code | Metropolitan Area | 1 Unit Limit | 2 Unit Limit | 3 Unit Limit | 4 Unit Limit |
|---|---|---|---|---|---|---|
| Teton | 56039 | Jackson, Wy-Id | $1,249,125 | $1,599,375 | $1,933,200 | $2,402,625 |
| 5-Digit County Code | 1 Unit Limit | 2 Unit Limit | 3 Unit Limit | 4 Unit Limit |
|---|---|---|---|---|
| 66010 | $1,249,125 | $1,599,375 | $1,933,200 | $2,402,625 |
| Island | 5-Digit County Code | 1 Unit Limit | 2 Unit Limit | 3 Unit Limit | 4 Unit Limit |
|---|---|---|---|---|---|
| St. Croix | 78010 | $1,249,125 | $1,599,375 | $1,933,200 | $2,402,625 |
| St. John | 78020 | $1,249,125 | $1,599,375 | $1,933,200 | $2,402,625 |
| St. Thomas | 78030 | $1,249,125 | $1,599,375 | $1,933,200 | $2,402,625 |
The default baseline conforming limits apply to all other counties in all states, along with Puerto Rico and the islands which make up the Northern Mariana Islands (Northern Island, Saipan & Tinian).
The following table lists conforming mortgage limits by year from the 1970s onward.
| Year | 1 Family | YoY Change | % △ | 2 Family | 3 Family | 4 Family | Second Loan | High Cost 1 Family |
|---|---|---|---|---|---|---|---|---|
| 2026 | $832,750 | $26,250 | 3.26% | $1,066,250 | $1,288,800 | $1,601,750 | $416,375 | $1,249,125 |
| 2025 | $806,500 | $39,950 | 5.21% | $1,032,650 | $1,248,150 | $1,551,250 | $403,250 | $1,209,750 |
| 2024 | $766,550 | $40,350 | 5.56% | $981,500 | $1,186,350 | $1,474,400 | $383,275 | $1,149,825 |
| 2023 | $726,200 | $79,000 | 12.21% | $929,850 | $1,123,900 | $1,396,800 | $363,100 | $1,089,300 |
| 2022 | $647,200 | $98,950 | 18.05% | $828,700 | $1,001,650 | $1,244,850 | $323,600 | $970,800 |
| 2021 | $548,250 | $37,850 | 7.42% | $702,000 | $848,500 | $1,054,500 | $274,125 | $822,375 |
| 2020 | $510,400 | $36,050 | 7.44% | $653,550 | $789,950 | $981,700 | $255,200 | $765,600 |
| 2019 | $484,350 | $31,250 | 6.90% | $620,200 | $749,650 | $931,600 | $242,175 | $726,525 |
| 2018 | $453,100 | $29,000 | 6.84% | $580,150 | $701,250 | $871,450 | $226,550 | $679,650 |
| 2017 | $424,100 | $7,100 | 1.70% | $543,000 | $656,350 | $815,650 | $208,500 | $636,150 |
| 2016 | $417,000 | $0 | 0.00% | $533,850 | $645,300 | $801,950 | $208,500 | $625,500 |
| 2015 | $417,000 | $0 | 0.00% | $533,850 | $645,300 | $801,950 | $208,500 | $625,500 |
| 2014 | $417,000 | $0 | 0.00% | $533,850 | $645,300 | $801,950 | $208,500 | $625,500 |
| 2013 | $417,000 | $0 | 0.00% | $533,850 | $645,300 | $801,950 | $208,500 | $625,500 |
| 2012 | $417,000 | $0 | 0.00% | $533,850 | $645,300 | $801,950 | $208,500 | $625,500 |
| 2011 | $417,000 | $0 | 0.00% | $533,850 | $645,300 | $801,950 | $208,500 | $625,500 |
| 2010 | $417,000 | $0 | 0.00% | $533,850 | $645,300 | $801,950 | $208,500 | $625,500 |
| 2009 | $417,000 | $0 | 0.00% | $533,850 | $645,300 | $801,950 | $208,500 | $625,500 |
| 2008 | $417,000 | $0 | 0.00% | $533,850 | $645,300 | $801,950 | $208,500 | $625,500 |
| 2007 | $417,000 | $0 | 0.00% | $533,850 | $645,300 | $801,950 | $208,500 | $625,500 |
| 2006 | $417,000 | $57,350 | 15.95% | $533,850 | $645,300 | $801,950 | $208,500 | $625,500 |
| 2005 | $359,650 | $25,950 | 7.78% | $460,400 | $556,500 | $691,600 | $179,825 | $539,475 |
| 2004 | $333,700 | $11,000 | 3.41% | $427,150 | $516,300 | $641,650 | $166,850 | $500,550 |
| 2003 | $322,700 | $22,000 | 7.32% | $413,100 | $499,300 | $620,500 | $161,350 | $484,050 |
| 2002 | $300,700 | $25,700 | 9.35% | $384,900 | $465,200 | $578,150 | $150,350 | $451,050 |
| 2001 | $275,000 | $22,300 | 8.82% | $351,950 | $425,400 | $528,700 | $137,500 | $412,500 |
| 2000 | $252,700 | $12,700 | 5.29% | $323,400 | $390,900 | $485,800 | $126,350 | $379,050 |
| 1999 | $240,000 | $12,850 | 5.66% | $307,100 | $371,200 | $461,350 | $120,000 | $360,000 |
| 1998 | $227,150 | $12,550 | 5.85% | $290,650 | $351,300 | $436,600 | $113,575 | $340,725 |
| 1997 | $214,600 | $7,600 | 3.67% | $274,550 | $331,850 | $412,450 | $107,300 | $321,900 |
| 1996 | $207,000 | $3,850 | 1.90% | $264,750 | $320,050 | $397,800 | $103,500 | $310,500 |
| 1995 | $203,150 | $0 | 0.00% | $259,850 | $314,100 | $390,400 | $101,575 | $304,725 |
| 1994 | $203,150 | $0 | 0.00% | $259,850 | $314,100 | $390,400 | $101,575 | $304,725 |
| 1993 | $203,150 | $850 | 0.42% | $259,850 | $314,100 | $390,400 | $101,575 | $304,725 |
| 1992 | $202,300 | $11,050 | 5.78% | $258,800 | $312,800 | $388,800 | $101,150 | $303,450 |
| 1991 | $191,250 | $3,800 | 2.03% | $244,650 | $295,650 | $367,500 | $95,625 | $286,875 |
| 1990 | $187,450 | -$150 | -0.08% | $239,750 | $289,750 | $360,150 | $93,725 | $281,175 |
| 1989 | $187,600 | $18,900 | 11.20% | $239,950 | $290,000 | $360,450 | $93,800 | $281,400 |
| 1988 | $168,700 | $15,600 | 10.19% | $215,800 | $260,800 | $324,150 | $84,350 | $253,050 |
| 1987 | $153,100 | $19,850 | 14.90% | $195,850 | $326,650 | $294,150 | $76,550 | $229,650 |
| 1986 | $133,250 | $17,950 | 15.57% | $170,450 | $205,950 | $256,000 | $66,625 | $199,875 |
| 1985 | $115,300 | $1,300 | 1.14% | $147,500 | $178,200 | $256,000 | $57,650 | $172,950 |
| 1984 | $114,000 | $5,700 | 5.26% | $145,800 | $176,100 | $218,900 | $57,000 | $171,000 |
| 1983 | $108,300 | $1,300 | 1.21% | $138,500 | $167,200 | $207,900 | $108,300 | $162,450 |
| 1982 | $107,000 | $8,500 | 8.63% | $136,800 | $165,100 | $205,300 | $107,000 | $160,500 |
| 1981 | $98,500 | $4,750 | 5.07% | $126,000 | $152,000 | $189,000 | $98,500 | $147,750 |
| 1980 | $93,750 | $24,250 | 35.93% | $120,000 | $145,000 | $180,000 | N/A | $140,625 |
| 1979 | $67,500 | $7,500 | 12.50% | |||||
| 1978 | $60,000 | $0 | 0.00% | |||||
| 1977 | $60,000 | $27,000 | 90.00% | |||||
| 1976 | $33,000 | $0 | 0.00% | |||||
| 1975 | $33,000 | $0 | 0.00% | |||||
| 1974 | $33,000 | $0 | 0.00% | |||||
| 1973 | $33,000 | $0 | 0.00% | |||||
| 1972 | $33,000 | $0 | 0.00% | |||||
| 1971 | $33,000 | $0 | 0.00% | |||||
| 1970 | $33,000 |
Alaska, Guam, Hawaii & Virgin Islands have a limit 50% higher than the conventional loan limit. In 1992 Virgin Islands was designated as a high-cost area & in 2001 Guam was designated as a high cost area.
Second mortgage limits were the same as first mortgage limits before 1984, when they were adjusted to 50% of the first mortgage limits. Fannie Mae only began offering a second mortgage program in 1981.
The Federal Reserve has hinted they are likely to taper their bond buying program later this year. Lock in today's low rates and save on your loan.
Are you paying too much for your mortgage?
Check your refinance options with a trusted El Monte lender.
Answer a few questions below and connect with a lender who can help you refinance and save today!