
This calculator quickly estimates a monthly payment based upon entering a purchase price, the down payment amount, the loan term & the APR of the laon. It will also figure the "all in" mortgage payment which includes property insurance, property tax &PMI.
We also offer the unique feature of allowing homebuyers to optionally see their cost per square foot & create a printable amortization schedule.
Usage tip: In rows with a percent-based dropdown if the "$" value is selected then the user can input the down payment amount directly, or if they select a specific percentage then the equivalent dollar amount is automatically calculated based on the purchase price of the home.
The following table shows current El Monte 30-year mortgage rates. You can use the menus to select other loan durations, alter the loan amount, change your down payment, or change your location. More features are available in the advanced drop down.
The average cost of building a house in the United States is about $125 per square foot, but that cost does not include the costs associated with financing a purchase or maintaining a home. This calculator allows home buyers to see their cost per square foot inclusive of borrowing, taxes, fees & other costs when buying a home.
To figure the annual cost per square foot of a property divide the annual rent by the square footage. For exmple, a propert which costs $30,000 to lease each year & is 1,200 square feet would have an annual cost per square foot of $25. To determine the monthly rate simply divide the annual rate by 12, which would yield a monthly cost of $2.08 per square foot.
Keep in mind when estimating costs to factor in associated fees to get a more complete view of the total cost.
People are particular about property size before deciding to buy a house. Often, your size preference depends on whether you’re single, or married with a growing family. It’s also reliant on the size of your funds. If you intend to purchase a large home, you must prepare to save more. It’s also a good idea to check the cost of property per square footage in an area, and how this affects property price.
Over the past decades, houses in America have generally tended towards the larger scale. In a 2017 survey, the U.S. was the second country with the largest average home size, with Australia being the first. Though trends such as the tiny house movement became popular around 2013 onwards, the typical home size in the U.S. is still big compared to other countries.
In this guide, we’ll take a look at how the average property size has changed over the years. Then, we’ll look into the cost of a home per square foot and how this varies in different places. We’ll review places with the most expensive property costs in the country and around the world. Finally, our guide will also discuss different factors that impact residential property prices.

How the Average Home Size Has Changed in America
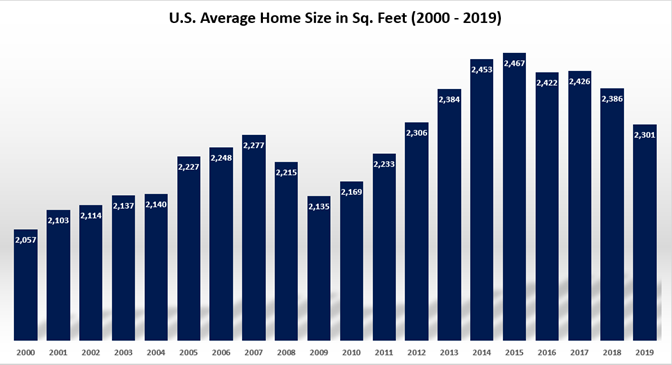
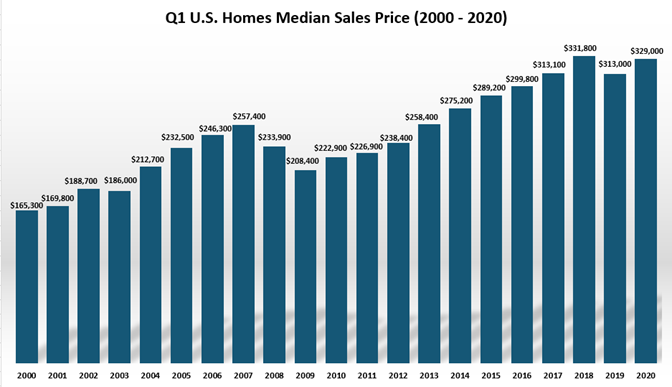
The size of the average home has generally increased between 2000 to 2015, based on the U.S. Census Bureau’s The State of the Nation’s Housing 2020. In 2000, the average size of a single-family home in the U.S. was 2,057 square feet, with most homebuyers focused on constructing larger homes. Meanwhile, the median sales price of homes sold in Q1 of 2000 was $165,300, according to Federal Reserve data. By 2007, the average size of single-family home increased to 2,277 square feet, with a median sales price of $257,400 in Q1 of 2007.
However, in 2009, the size of purchased homes significantly decreased to 2,135 square feet. This decline is attributed to the subprime housing crisis when home values suddenly dropped. It caused many homeowners to owe more on their mortgage than their property is worth, triggering widespread foreclosures. As a result, before deciding to purchase large property, many buyers became diligent about avoiding loans they could not afford. Around this time, people also began to rethink the practicality of large dwellings.
The years following the subprime housing crisis showed slow but steady recovery. By 2015, the average home size grew as high as 2,467 square feet, while the median sales price rose to $289,200 in Q1 of 2015. As home sizes expanded, the number of rooms also increased. Since American families have contracted in size over the years, these extra rooms were mostly underused.
In 1989, single-family homes with four or more bedrooms accounted for 28% of the market share. But in 2015, houses with four or more bedrooms increased as high as 47%. This resulted in homes with more bedrooms than the number of people in them. During this time, 96% of households only had five or fewer occupants. An estimated 61% of these homes had at least one extra bedroom, while 27% had two or more extra bedrooms.
By 2016, the average single-family home slightly decreased to 2,422 square feet, while the median sales price rose to $299,800 in Q1 of 2016. With increasing home prices, it makes sense to choose smaller property, especially for first-time buyers. The trend continued as a many people preferred to purchase more practical homes that fit their budget.
Since bigger houses typically require expensive upkeep, some homebuyers choose smaller and more energy efficient homes. This is one of the ideas espoused by the tiny house movement to encourage smaller housing. By 2019, the average home size declined to 2,301 square feet. Meanwhile, the median sales price continued to increase, reaching $313,000 by Q1 of 2019.
Below are graphs showing how the average home size and median sales price has changed in the last 20 years.
| Year | Average U.S. Home Size sq.ft. | Q1 U.S. Homes Median Sales Price |
|---|---|---|
| 2000 | 2,057 | $165,300 |
| 2001 | 2,103 | $169,800 |
| 2002 | 2,114 | $188,700 |
| 2003 | 2,137 | $186,000 |
| 2004 | 2,140 | $212,700 |
| 2005 | 2,227 | $232,500 |
| 2006 | 2,248 | $246,300 |
| 2007 | 2,277 | $257,400 |
| 2008 | 2,215 | $233,900 |
| 2009 | 2,135 | $208,400 |
| 2010 | 2,169 | $222,900 |
| 2011 | 2,233 | $226,900 |
| 2012 | 2,306 | $238,400 |
| 2013 | 2,384 | $258,400 |
| 2014 | 2,453 | $275,200 |
| 2015 | 2,467 | $289,200 |
| 2016 | 2,422 | $299,800 |
| 2017 | 2,426 | $313,100 |
| 2018 | 2,386 | $331,800 |
| 2019 | 2,301 | $313,000 |
| 2020 | $329,000 |
Data from the US Census Bureau and the Federal Reserve
By 2020, people were more likely to buy slightly smaller homes compared to the previous decade. The following chart is from NAR’s Home Buyers and Sellers Generational Trends Report in March 2020. It details the percentage distribution of homes people purchased according to property size. It also organized them according to homebuyers per age group.
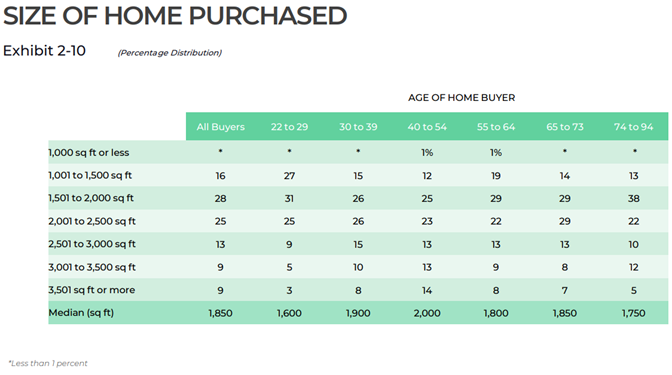
According to the data, 28% of homebuyers purchased homes between 1,501 to 2,000 square feet. Majority of those purchases were from people aged 74 to 94, accounting for 38% of purchases. Meanwhile, 31% of those purchases were made by buyers aged 22 to 29. Next, 25% of purchases were homes between 2,001 to 2,500 square feet. People who bought those homes were 65 to 73 years old, accounting for 29% of all purchases, while 26% of buyers were aged 30 to 39. Around 9% of buyers purchased the largest homes at 3,501 square feet or more, with most of those buyers aged 40 to 54 years old. Overall, this data shows most homebuyers preferred houses between 1,501 to 2,000, which is smaller than the previous decades.
In 2020, the National Association of REALTORS® (NAR) also released their annual Profile of Home Buyers and Sellers. This summary reported that the median home size for first-time homebuyers was 1,680 square feet, while it was 2,020 square feet for repeat buyers. Single men and women purchased the smallest sized properties with a median size between 1,590 and 1,650 square feet. Meanwhile, married couples and families with children under 18 years old bought the largest homes, with a median size between 2,100 to 2,200 square feet, respectively.
The Median Size of Homes in 2020 Overall, NAR reported that typical purchased homes had a median size of 1,900 square feet in 2020. Most of these homes were built in 1993 and had three bedrooms and two bathrooms. This is notably smaller compared to existing homes purchased between 2000 to 2015, which had four or more bedrooms. Despite the decline in median home size, the median home sales price rose to $329,000 in Q1 of 2020. Since there’s greater demand for homes as populations grow (especially in major cities), home prices continue to increase because of supply shortage.

Between 2018 and 2019, construction of homes less than 1,800 square feet increased by 13%, based on The State of the Nation’s Housing 2020. Smaller housing options such as condominium constructions rose by 15%, while townhome constructions increased by 21% in 2019. On the other hand, construction of large houses of at least 3,000 square feet declined by 4% in 2019.

Though it’s impractical to keep unused rooms, consider having one especially for work. This setup has mostly been adapted by large technology companies over the years, as they’ve experienced working remotely with their teams. When the COVID-19 pandemic affected the global economy, the work from home arrangement turned into a necessity. Maintaining productivity and focus is a challenge when you telecommute. Many homeowners realized the importance of having a conducive workspace right at home.
In June 2020, Stanford Economist Nicholas Bloom reported that 42% of the U.S. labor force began working from home on a full-time basis. This was largely due to the impact of stay-at-home orders and lockdowns implemented in the first few months of the pandemic. Only around 26% of employees worked in their business locations, which were mostly essential service workers.
As quarantine restrictions eased, a report showed that 24% of U.S. employees worked from home daily in August 2020, while 18% worked from home on some days. This data was based on the Real-Time Population Survey from the Dallas Federal Reserve. The report noted that around 51% of workers said they prefer to continue working from home at least a couple of days a week after the pandemic. With these circumstances in mind, it’s best to make room for work space at your home.
The average price per square foot for single-family homes was around $123 in 2019, according to Realtor.com. In 2020, home improvement resource site HomeAdvisor.com stated that property can be priced anywhere between $100 to $200 per square foot.
Based on these figures, if you’re buying a 2,000 square foot property, your home can cost anywhere between $200,000 to $400,000. This is still a general range, and it doesn’t include associated cost such as taxes, insurances, and maintenance expenses. And in reality, the exact price of residential property per square footage varies per area.
A neighborhood close to schools and business districts is more expensive than locations in suburban or rural areas. In general, prepare to pay for the convenience of living in cities that provide easy access to your needs. Since the average home price is specific to an area, be sure to compare prices of different houses. Depending on which city or county you’re planning to live, you should start preparing your budget.
In January 2020, Realtor.com compiled the top cities with the most expensive property cost per square foot. According to the list, the most expensive city is Boston, with a median price per square foot of $1,160. For such a high cost, you can only buy a 263 square foot home if you have a budget of $305,000. That’s obviously too small, which is comparable to the size of typical tiny homes.
In second place is New York City, with a median cost of $1,106 per square feet. At third place is San Francisco with a median price of $1,004 per square feet. For the full list, see the table below.
| City, State | Median Cost Per Sq. Ft. | Home Size You Can Buy w/ $305,000 |
|---|---|---|
| Boston, MA | $1,160 | 263 sq. ft. |
| New York, NY | $1,106 | 276 sq. ft. |
| San Francisco, CA | $1,004 | 304 sq. ft. |
| Los Angeles, CA | $646 | 472 sq. ft. |
| Washington, DC | $473 | 740 sq. ft. |
| Seattle, WA | $454 | 672 sq. ft. |
| Miami, FL | $313 | 974 sq. ft |
| Dallas, TX | $215 | 1,419 sq. ft |
Why Home Prices in Major Cities Are Expensive Home prices are significantly higher in cities with thriving economies. These areas offer greater job opportunities with higher paychecks to match. But as a tradeoff, it also means dealing with higher living expenses. And the more people live in a city, the less space is available for homebuyers and renters. As the law of supply and demand dictates, low home inventories drive property prices higher. This explains the exorbitant home prices in cities like Boston, New York, and San Francisco.

Meanwhile, ApartmentTherapy.com published a list of the most affordable states in 2019 to buy homes per square feet. Generally, houses in the Midwest and South are more affordable than homes in busy metropolitan areas.
On top of the list was Arkansas, with an average price of $93 per square foot. This means if your budget is $305,000, you can purchase a home as large as 3,280 square feet. Next is Indiana with an average cost of $96 per square foot. In third place is West Virginia, with an average price of $101 per square foot. See the full list below.
| State | Average Cost Per Sq. Ft. | Home Size You Can Buy w/ $305,000 |
|---|---|---|
| Arkansas | $93 | 3,280 sq. ft. |
| Indiana | $96 | 3,177 sq. ft. |
| West Virginia | $101 | 3,040 sq. ft. |
| Oklahoma | $101 | 3,040 sq. ft. |
| New Mexico | $101 | 3,040 sq. ft. |
| Alabama | $103 | 2,961 sq. ft |
| Nebraska | $103 | 2,961 sq. ft |
| Ohio | $104 | 2,933 sq. ft. |
| Wisconsin | $115 | 2,652 sq. ft. |
| Michigan | $117 | 2,607 sq. ft. |
Rural and suburban areas which are not densely populated usually have more available land and property. Thus, these places tend to have lower home prices. To stimulate economic growth in these communities, the U.S. Department of Agriculture backs USDA loans. This government-sponsored mortgage is geared towards low to moderate income homebuyers who are looking to live in rural areas. USDA loans generally help boost rural development by making credit available to qualified borrowers.
Reconsider Purchasing Large Homes Though your budget can afford large property in affordable areas, think twice before buying a big house. A larger home comes with higher maintenance costs. If you happen to purchase one with poor construction materials and design, you’ll end up spending more on fixes. This can be a huge source of frustration and financial burden. Even the cost of heating and air conditioning for larger property is much higher compared to smaller houses. Meanwhile, more compact homes consume less electricity and are easier to clean and maintain.
As for the most expensive houses around the world, CBRE Global Living 2020 announced Hong Kong as the most expensive property market in 2020. This is followed by Munich in second place, and Singapore in third place.
| City | Average Property Price | Average Property Size | Average Cost Per Sq. Ft. |
|---|---|---|---|
| Hong Kong | $1,254,442 | 631 sq. ft. | $1,987 |
| Munich | $1,000,000 | 1,477 sq. ft.* | $821 |
| Singapore | $915,601 | 721 sq. ft. | $1,214 |
| Shanghai | $905,834 | 1,270 sq. ft. | $713 |
| Shenzhen | $783,855 | 1,062 sq. ft. | $738 |
| Beijing | $763,498 | 1,258 sq ft. | $607 |
| Vancouver | $754,617 | 1,792 sq. ft.* | $1,192* |
| Los Angeles | $717,583 | 1,800 sq. ft.* | $609* |
| Paris | $650,555 | 614 sq. ft. | $1,048 |
| New York | $646,026 | 1,764 sq. ft.* | $597* |
*Figures with asterisks were gathered from other data sources since CBRE did not include estimates for them.
Again, cities with expensive housing markets receive an influx of people, including foreign investors looking to live in such areas. Job availability coupled with high paychecks motivate more people to explore employment. And when more people stay in these places, higher demand for residential property pushes home prices higher.
For small cities such as Hong Kong, Singapore, and Paris, you’ll notice that the average property size is less than 800 square feet despite the high cost. It’s indicative of the limited available space in these cities. They also have zoning laws that prohibit them from constructing residential homes and buildings up to a certain size.
Having limited space and a constant inflow of immigrants further aggravates rising property costs. In Paris, for instance, around 61% of people who bought homes in 2018 for over 4 million euros were foreigners. And since it’s a popular destination, many affluent individuals prefer to live in Paris or maintain a vacation home.
Other cities such as Munich, Los Angeles, Beijing, etc. on the list may be larger, but these are also densely populated metropolitan areas. Apart from the growing local population, people from other parts of the country aim to work in these large cities. Because of the thriving economy, most of these cities may have a positive net migration, which means there are more people arriving than leaving the area. More foreigners settling in these cities push house prices higher.
4 Primary Factors that Boost House Prices Residential property values are largely boosted by higher disposable income, population growth, looser credit conditions, and lower interest rates. These are characteristics found in top cities with expensive properties. Real estate prices also tend to rise with GDP growth, while it decreases when interest rates and returns on other investments are higher. These findings are is based on Bis.org’s Property Price Dynamics: Domestic and International Drivers report in February 2020.

Besides the size and general location of a home, here are other major factors that drive local property prices:
When people purchase a house, they typically think its value will appreciate over time. While this is true in certain cases, in reality, a home’s physical structure ages and incurs wear and tear. The house itself depreciates in value even with regular upkeep. Meanwhile, the land it occupies usually increases in value over the years. Understanding this distinction will give you a better sense of gauging a property’s price. Thus, homeowners eventually invest in major renovations to maintain or increase their home’s value.
Generally, new residential properties are appraised at a higher value. A house with new electrical wiring, HVAC systems, plumbing, roofs, and fixtures means it’s less likely to have major maintenance issues. This translates to greater savings for a homeowner. For instance, if your roof, floors, and walls have a 20-year warranty, you can save a lot in the next two decades. If you compare this to an old house that needs all sorts of fixes every couple of years, you’re likely spending more on maintenance and repairs.
With maintenance expenses in mind, many homebuyers consider purchasing a move-in ready home. It’s also the reason why most buyers insist on having an inspection contingency in their real estate contract. This clause allows them to negotiate home repairs to steer clear of major costs after buying the house.
A country’s economic health is usually measured by key indicators such as GDP growth, employment rate, manufacturing activity, and prices of goods. Generally, when the national economy is sluggish, the real estate market follows suite. In particular, when unemployment is high in certain states, it causes more foreclosures. To hedge against this risk, lenders tend to charge higher mortgage rates.
When the Great Recession occurred in the late 2000s, widespread unemployment pushed homeowners to foreclose their homes. Mortgage lenders suffered massive losses in the housing market. As a result, the Federal Housing Agency implemented an adverse market fee for loans offered by GSEs, Fannie Mae and Freddie Mac. When the market eventually recovered, this fee was revoked in 2015.
Higher mortgage rates are generally assigned to states and counties with high frequency of foreclosures. If you’re buying a home, avoid places with high unemployment. Likewise, these areas will typically have high mortgage rates, which ultimately increases the total cost of your home.
Zoning is implemented to standardize what kinds of property are allowed in an area. It groups types of buildings into particular locations for land use.
For instance, pubs and bars are not built close to elementary schools, and a manufacturing factory should not be close to a subdivision. It specifies the size and orientation of buildings and residential property. Zoning regulations can also prohibit homeowners and renters from operating businesses from their homes. These laws keep cities organized in terms of where to access residential and commercial establishments. Zoning varies per city and may change depending on how areas are planned for future use.
One way it can impact property price is when your area’s zoning class is changed by local or statewide authorities. For example, if your area’s class changed from a residential zone to a commercial zone, expect home and rental prices to increase. Likewise, if the area’s class changes from a commercial zone to a residential zone, home values will likely drop.
Since home prices increase most where there’s limited housing, zoning and land use regulations can further reduce the availability of homes. And with shortage of housing, this leads to higher property prices. If you’re planning to buy or construct a home, be sure to check zoning regulations in your area to ensure your building is compliant. Otherwise, you may face civil penalties and will be required to remove an illegal structure.
Demographics pertain to different characteristics that compose a population. This includes race, age, gender, income, as well as migration patterns and population growth. The demographics of an area is an important aspect that influences the home prices and the type of properties in demand. Real estate marketers rely on demographics to know how large or small houses should be for prospective buyers.
For instance, if the demographic is comprised of people between 30 to 45, a significant number of them may usually be married with a growing family. Thus, they require houses that have extra rooms for their children. Likewise, single men and women are likely to purchase smaller sized properties.
A household’s level of disposable income is instrumental in shaping property prices. In general, the higher a household’s real per-capita disposable income (RPDI), the more money they can spend to service a mortgage. This is the reason why property is typically more expensive in major cities where people have higher incomes. Thus, it’s not just about your home’s size, condition, and location. They type of people who live in your area will influence prices in the real estate market.

Over the years, growing real estate prices have obliged Americans to reconsider purchasing large property. Today’s homebuyers are more practical about the homes they purchase. While it’s not ideal to buy a small and cramped house, many choose compact houses that are easier to maintain with enough room for everyone. It’s also worth having enough space that will allow you to work productively from home.
Apart from a home’s size and location, other major factors that influence home prices are local economic conditions, the property’s age, the area’s demographics, as well as zoning laws and regulations. Cities and counties with high unemployment tend to have higher mortgage rates. Meanwhile, if you’re buying an old house, you can expect a lower price. However, this might mean higher maintenance costs later on, so think twice before making the purchase.
Zoning laws, on the other hand, can keep you from building at certain areas. It also limits you to certain building specifications which makes the cost of homes more expensive. Zoning laws may also keep you from finding available homes in an area. Finally, demographics indicate the type of people that live in the area. You’ll notice if a neighborhood is home to more affluent families, or if it’s more suited for average-income earners. The higher people’s incomes, the more expensive property prices tend to be. When you’re choosing the right home, it’s worth looking into these factors to gauge if you can afford to live in an area.
Furthermore, the cost per square foot of property varies depending on the location. Homes in cities and densely populated metropolitan centers typically have the most expensive cost per square foot. While these cities offer higher salaries, they also come with higher costs of living. And since more people flock to these places for employment, housing shortage results in expensive property prices. Meanwhile, homes in less densely populated locations such as suburbs and rural areas have lower cost per square foot. If you have a limited budget, this can allow you to afford a fairly spacious house. It’s also a viable arrangement if you can afford to work remotely and avoid congested cities.
Explore conventional mortgages, FHA loans, USDA loans, and VA loans to find out which option is right for you.
Check your options with a trusted El Monte lender.
Answer a few questions below and connect with a lender who can help you save today!