
While real estate investment trusts are not tax free, they are partially tax-deferred, which increase the effective tax-equivalent distribution (TED) when compared against many other investments. The following calculator helps REIT investors see the equivalent fully taxable investment yield they would need to achieve to match the distribution generated by a REIT they have invested in. A portion of distribution from REITs is considered a return of capital (RoC). This calculator helps investors see a REIT's hypothetical distribution and how the RoC impacts the tax equivalent distribution.
While REITs typically offer superior returns to ordinary savings accounts, some investors like to keep a portion of their capital liquid for diversification purposes & to take advantage of price mismatches driven by temporary liquidity issues. Some investors try to stay fully invested and have back up sources of credit on hand using a revolving HELOC.
Our rate table lists current home equity offers in your area, which you can use to find a local lender or compare against other loan options. From the [loan type] select box you can choose between HELOCs and home equity loans of a 5, 10, 15, 20 or 30 year duration.
REITs are investment equities often used by investors who want to increase yields on their portfolio. They are known for high dividend returns which allow individuals to invest in large-scale income producing properties. REITs are corporations that own and operate commercial real estate. These include properties such as shopping malls, office buildings, hotels, and storage facilities. But unlike other real estate companies, REITs do not purchase and develop properties to sell them. Instead, REIT corporations operate property to include them in their own investment portfolio. When REIT companies earn profits, they pay out at least 90% of their taxable income to shareholders.
REITs offer a primary advantage: It allows individual investors to buy a share of commercial real estate without buying and operating the property themselves. This is how you can include real estate in your investment portfolio. But before investing in REITs, you must understand how they work, including their benefits and drawbacks. Read on to find out more about REITs and how you can use them to your advantage.

Real estate investment trusts (REIT) are companies that own, manage, or finance income-generating properties across a diverse range of market sectors. In order to qualify and maintain a REIT status, these companies must satisfy certain distribution requirements. Specifically, they must distribute a minimum of 90% of their income to shareholders in the form of dividends.
According to the National Association of Real Estate Investment Trusts (NAREIT), to be eligible as a REIT company, a business must meet the following conditions:
REITs invest in a variety of commercial real estate properties, such as apartment buildings, hotels, retail complexes, and warehouses. They also invest in cell towers, data centers, offices, and medical facilities. These properties are grouped specifically into 13 REIT sectors. Generally, REITs concentrate investments on particular property types, such as residential, resort, or retail properties. But some may hold multiple types of real estate in their portfolios.
NAREIT notes that collectively, REITs of all types own over $3.5 trillion in gross assets throughout the U.S. Meanwhile, stock-exchange listed REITs own an estimated $2.5 trillion in assets, which represents over 500,000 properties. Overall, the equity market capitalization of U.S. listed REITs is estimated at more than $1 trillion.
REITs earn income by leasing space and obtaining rent from its real estate. The income they generate is then paid out to its shareholders in the form of dividends. REITs are required to pay out at least 90% of their taxable income to shareholders, and most can even pay out 100%. In exchange, the shareholders pay income taxes on those dividends. In the case of mortgage REITs (mREITs), note that these companies do not directly own real estate. Rather, they finance properties and generate income through interest on their investments.
When you invest in REITs, you’ll notice they behave similar to mutual funds and are bought and sold like stocks. Like mutual funds, REITs pool together capital from numerous investors. Meanwhile, most REITs are publicly traded like stocks. They possess the liquidity of traditional equities, making them easy to sell or purchase unlike huge capital for income property. REITs also exhibit bond-like qualities (bonds pay a fixed interest to investors) because they pay out most of their earnings by distributing 90% of their income through dividends. Note that dividends investors earn through REITs are treated as income, which is taxed accordingly. REIT companies are not subject to tax deductions like other types of corporations. So no matter how profitable the REIT, they pay zero corporate tax.
What’s the main benefit of REITs? The Congress first established REITs in the 1960s mainly to allow more people to invest in real estate. REITs make it possible for anyone to invest in the commercial real estate market the same way they invest in other industries. When you invest in REITs, you can earn profits on commercial property without buying your own apartment complex or office building. It provides small-time investors the opportunity to own valuable real estate, gain access to dividend-based income, and the chance to help communities grow.
On the other hand, purchasing apartment buildings, hotels, and office facilities require a huge amount of capital. People with limited capital cannot afford to finance real estate and rental management. These properties often remain illiquid unless owners sell or lease them out. But by investing in REITs, you can earn dividends from a diverse range of property sectors without managing or financing properties yourself.
How do you invest in REITs? You can purchase REIT shares which are listed in primary stock exchange directories just as other public stocks. You can also buy shares in an exchange-traded fund (ETF) or a REIT mutual fund. Popular exchange-traded funds that concentrate on REITs include the following:
To help you assess different REITs and the appropriate level of investment, you can consult a broker or investment advisor. Generally, publicly traded REITs can be purchased through a broker. Just note that brokerage fees will apply. If your broker participates in PNLRs or private REITs which are not publicly traded, you may have the option to buy these type of REITs.
Individual investors can open a brokerage account and purchase individual REITs directly. A few of the largest individual REITs are the following:
As for non-publicly traded REITs, these are typically sold by brokers. But note that they usually have higher upfront fees compared to publicly traded REITs. Non-publicly traded REITs sales commissions and upfront fees typically cost around 9% to 10% of the investment. Consider this before buying shares from a non-publicly traded REIT, as this can substantially lower the overall value of your investment.

Historically, REITs have provided highly profitable returns for many investors. A report by MarketWatch notes that REITs performance exceeds mutual funds by an entire percentage. In the course of 20 years, REITs can increase investors’ earnings by up to a third. This study was based on consistent dividend income and long-term capital appreciation from data between 1960 and 2017. Moreover, REITs have outperformed the S&P 500 index and other primary indexes over 20 years, including the rate of inflation.
Investors use REITs to expand their portfolio beyond publicly traded company stocks or mutual funds. They also have a comparatively low correlation with other investment equities. This means they seldom move in lockstep with stocks. For this reason, REITs are often used as a portfolio diversifier to balance and minimize overall risk. In the long run, this type of investment equity helps boost returns on investors’ portfolios.
The following chart shows all equity REITs outperforming leading U.S. benchmarks over extended periods:
| Investment benchmarks | 1-year | 3-year | 5-year | 10-year | 15-year | 20-year | 25-year | 30-year | 35-year | 40-year |
|---|---|---|---|---|---|---|---|---|---|---|
| FTSE NAREIT All equity REITS | 13.01 | 5.92 | 8.88 | 16.03 | 9.41 | 10.66 | 10.47 | 10.51 | 11.6 | 12.02 |
| FTSE EPRA/NAREIT Developed | 8.64 | 5.45 | 5.79 | 11.45 | 8.00 | 8.83 | 8.40 | n/a | n/a | n/a |
| Russell 1000 Large-cap stocks | 10.02 | 14.15 | 10.45 | 14.77 | 8.94 | 6.19 | 10.09 | 10.13 | 11.45 | 11.81 |
| Russel 2000 Small-cap stocks | -3.31 | 12.30 | 7.06 | 13.45 | 8.15 | 7.77 | 9.26 | 9.29 | 9.83 | 10.92 |
| Bloomberg Barclays US Aggregate Bond | 7.87 | 2.31 | 2.95 | 3.90 | 4.27 | 4.93 | 5.50 | 5.99 | 7.21 | 7.32 |
NAREIT notes that REITs have a dependable record of growing dividends when analyzed with stock price increases and long-term capital appreciation. Over 40 years, REITs have provided investors with competitive total return performance for most periods compared to stocks, bonds, and other assets. Since REITs are publicly traded companies that capitalize on shareholder value, they market their properties to attract more tenants and maintain a long-term property cycle.
Stocks are equity securities that represent ownership of a part of a corporation. If you purchased shares of a stock, it means you own a fraction of a corporation relative to its total number of shares. Stocks are basically an investment in a company and a part of that company’s profits. When a stock’s price is high, it indicates the corporation has good overall financial health. Investors purchase stocks to earn returns on their investment.
There’s an immense range of stocks compared to REITs with a narrower sector. Stocks come from all sorts of industries, from small start-up companies to massive corporations, including all sorts of business sectors. REITs, meanwhile, tend to focus on a particular type of real estate and are limited to several property sectors.
THE S&P 500 index is a benchmark stock market indicator that measures the performance of 500 large companies listed in U.S. stock exchanges. Meanwhile, NAREIT created the FTSE NAREIT All Equity REIT index, which keeps track of historical data for all 12 REIT sectors (mREITs are excluded because they are considered financial companies instead of real estate companies).
To compare stocks and REITs, the following chart shows how the REIT index performed in comparison to the S&P 500 index:
| Time Period | S&P 500 Total Annual Return | FTSE NAREIT All equity REITS Total Annual Return |
|---|---|---|
| 1972 – 2019 | 12.01% | 13.3% |
| The last 25 years | 11.9% | 12.6% |
| The last 20 years | 7.7% | 13.3% |
| The last 10 years | 14.2% | 13.2% |
| The last 5 years | 12.5% | 9.0% |
| The last year (2019) | 31.5% | 28.7% |
REITs have outperformed the S&P 500’s total return between 1972 to 2019. This is the case for the last 25 years and 20 years on the chart. Based on this data, we can say that REITs outperformed stocks over the long term. But that could change if S&P 500 outpaces REITs by a wide margin over the succeeding years. This has actually been the case in 2019 and the previous 10-year and 5-year periods on the chart. In 2019, the S&P 500 total annual return was 31.5%, while all equity REITs total annual return was at 28.7%. However, historically, REITs have always emerged with higher returns over much longer timeframes.
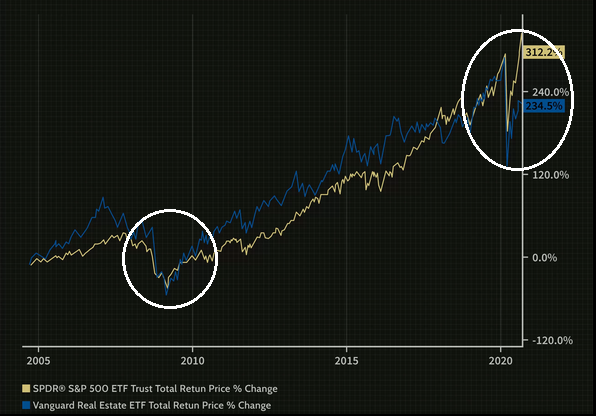
Similarly, both stocks and REITs are negatively affected during periods of economic downturn. The graph below illustrates how both returns for S&P 500 stocks and the Vanguard REIT were impacted by economic recessions. Notice the considerable declines in the trend during the Great Recession in 2008 and the COVID-19 crisis in 2020.
When we compare REITs and bonds, we’ll notice how REITs exhibit more similar characteristics with bonds. Bonds are investment securities that represent a loan made by an investor to a borrower. These are commonly issued by governments, corporations, and organizations. Companies and organizations sell bonds to finance operations, expansions, or new projects. Meanwhile, governments sell bonds to supplement revenue from taxes as well as to fund projects.
When investors purchase a bond, they lend money to the bond issuer for a set period of time. Once the bond reaches the maturity date, the issuer returns the investor’s money in the form of regular interest payments called coupons. Bonds are also characterized as fixed income because your investment earns fixed interest payments over the life of the bond. Investors can hold on to the bond until maturity or sell it for profit.
Once the bond matures, issuers guarantee to pay back the face value of the security to shareholders. On the other hand, stocks offer no such guarantees for investors. Moreover, bond prices tend to move in opposition to prevailing interest rates. So when rates fall, bond prices increase. Thus, bonds can help mitigate the risk of more volatile investments. They can also provide you with a steady stream of income, which is ideal for people who want to save for retirement. On the other hand, bonds are very sensitive to rate fluctuations. When market rates rise, the value of bonds decrease. If you need to sell the bond at that period, you’ll receive less than the original face value.
Similarly, REITs are used to balance risk in investors’ portfolio. These are considered viable investments for reliable, long-term returns for retirement savings. REITs are also sensitive to market rate fluctuations. During times of economic growth, REIT prices rise with market interest rates. However, in a slowing economy, when the Federal Reserve imposes tight monetary policies, REIT prices decrease. This happens when the Federal Reserve raises short-term interest rates through policy changes to discount general market rates. So depending on market conditions, REIT values can decrease even if market rates rise. In this respect, REITs cannot guarantee the value of shares at any given time. So if you’re looking for a really low risk investment, bonds have a lower risk profile. Bond dividend yields are also usually higher than REITs, except for government bonds that have lower risk and yields.
The following graph compares all equity yield for REITs compared to the 10-year U.S. Treasury bond yield. It shows data between 2000 to 2014.
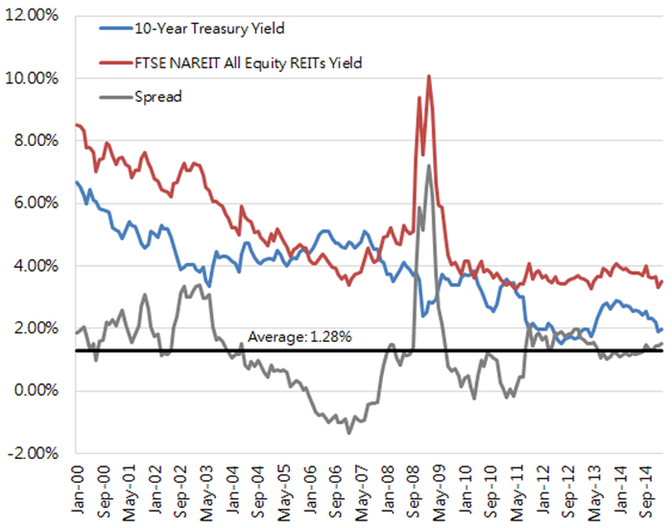
Between 2004 to 2005, investors generally thought that high inflation protected real estate investments that couldn’t go down in value. Around this time, dividend yields on REITs dropped lower than 10-Year Treasury bond yields. It continued to be lower towards 2007 when long-term rates became lower than short-term rates. And when long-term rates are substantially lower than short-term rates, the long-term duration should result in REITs generating lower yields than the Treasuries.
However, towards 2010, many investors bought back REITs to take part in recovering real estate prices, especially after the Great Recession. 2010 was considered one of the best years for REITs. The spread also inverted, with REIT yields higher than Treasury yields thanks to high REIT price appreciation. In 2011, investors anticipated that long-term yields would fall while short-term rates would increase, which could invert the yield curve. However, the yield did not invert. And from 2011 to 2014, REIT yield remained higher than 20-year Treasury yields.
But of course, yields largely depend on the REIT company you invested in. For instance, in 2020, retail REITs have mostly struggled as the COVID-19 crisis drove malls and retailers to close down. In particular, REITs such as the Simon Property Group (SPG) were hit very hard, with most mall tenants classified as nonessential businesses. In 2020, Simon Property Group’s stock fell as much as 43% in 2020.
However, not all retail REITs suffered gravely. REIT company Realty Income, which concentrates on essential businesses such as drugstores and convenience stores, was also affected by the COVID-19 crisis. However, they were still allowed to operate even with lockdowns and stay-at-home orders. Realty Income’s stock fell by only 17%, which is not as bad as SPG. Both REIT companies are the top performers in their niche: SPG pays 6.2% to its investors, while Realty Income pays 4.6% as of 2020.
Bonds compared to stocks. Generally, bonds are considered less risky compared to stocks. These are more conservative investments taken by investors who can tolerate less volatility. Historically, stocks usually beat bonds in long-term returns in a growing economic environment. But in May 2020, the New York Times reported that bonds have outperformed stocks in the last 20 years. And in the past two decades, this might make sense, especially after two major economic recessions, such as the 2008 Great Recession and the 2020 COVID-19 crisis.
But according to Ben Carlson, CFA, the early 2000’s was the worst entry point for U.S. stock market history. During this time, the long-term government bond yields were more than 6.5%. When we factor in high starting yields together with falling interest rates, and high duration of a fixed income asset, this results in higher returns for bonds compared to stocks. But if we look over a shorter period, stocks typically outperform bonds.
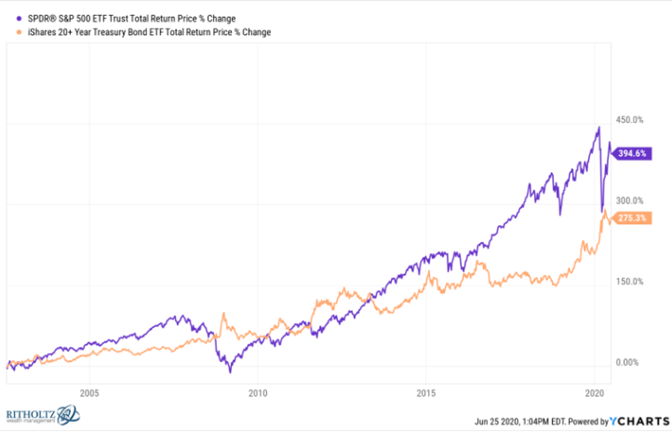
The following graph starts at 2002 and compares total returns for S&P 500 and the i-Shares 20+ year Treasury Bond ETF (TLT). When the graph starts at a later date, you’ll see how stocks still outperformed long-term bonds.

Type of Shareholders That Invest in REITs
According to a 2020 study, approximately 145 million Americans have invested in REITs. That’s around 44% of all U.S. households. REITs are investments that are mainly included in more than 250,000 401(k) retirement plans. Thus, numerous working individuals with retirement accounts and investment portfolios can purchase REITs.
REITs are a prominent feature in majority of target-date funds. These are a type of investment funds that automatically rebalances your investments from high-risk, to a low-risk and high-reward status as you age. It basically changes your asset allocation from a growth status toward more conservative investments as you reach retirement. So while many people can access REITs, they seem prevalent among people who are more diligent about planning for retirement and maximizing their savings.

The following sections summarizes the benefits of REITs and how you can use them to your advantage:
Compared to buying investment property, publicly traded REITs are a lot easier to purchase and sell, making them highly liquid. You don’t have to spend a fortune to invest in commercial property. With REITs, you can earn through dividends, or sell your REIT shares anytime as needed. REITs also have publicly available historical data, which allows you to easily track how well your investment is performing. Management costs for REITs are also spread across multiple properties, which helps boost its performance.
In contrast, physical real estate such as condominiums and office buildings, are a lot harder to purchase. They require large capital from investors, which also takes time if they’re trying to sell the property. Managing physical property entails spending for maintenance and utilities to keep it marketable to tenants. And as the property owner, you must periodically evaluate key operating ratios to track your investment’s performance. If you have limited capital and manpower, diversifying properties to different locations is a lot harder. Compared to REITs, operating your own investment property is a fulltime commitment with more costly expenses. On the other hand, you don’t have hands-on control over property management if you only invest in REITs.
Because REITs pay at least 90% of their taxable income to shareholders, they usually provide above average dividend yields. As mentioned above, REITs can outperform other equity indexes such as stocks, making it a good option if you want to diversify your portfolio and boost your returns. REITs can have an average dividend yield of 5% and up, while the average S&P 500 stock may only yield below 2%.
Since REITs provide larger dividends and a resilient cash flow, they tend to be less volatile than stocks. This is also because real estate expenses become more predictable over long periods of time. So when other asset classes frequently fluctuate, REITs can be relatively more stable within a long time horizon. This is why investors obtain REITs to diversify their portfolio. It can balance other volatile asset classes and reduce overall risk. However, no investment is completely risk-free. Depending on market conditions and the type of REIT you have, investments are not immune to volatility.
As the value of their underlying assets grow, REITs possess the potential for capital appreciation over the long term. Real estate values generally increase with time, and REITs can come up with several improvements to increase their value. These companies might keep developing more properties, or sell properties to revitalize more marketable real estate sectors. When you invest in REITs, you are basically banking on the growth of commercial real estate industries.

While REITs have many benefits, it’s important to consider the following disadvantages:
Because REITs are not taxed at the corporate level, investors are required to pay for taxes on the dividends they receive. Unfortunately, REIT earnings do not satisfy the IRS’s definition of ‘qualified dividends.’ This means REIT dividends are taxed at a higher rate than ordinary income. However, if you collect your dividends through a tax advantaged account, such as an individual retirement account (IRA), it will not be taxed. Consider taking an IRA for REIT investments to boost your retirement funds.
In contrast to bonds that provide fixed interest payments, a REIT’s value is not fixed. When interest rates rise as influenced by the Federal Reserve, investors commonly react by selling REITs before their value drops. REITs start to look less appealing to investors compared to fixed-income investments like bonds. However, note that rising market rates do not always mean REIT values will fall. When combined with a strong economy and favorable real estate conditions, REIT prices can actually have better overall returns.
REITs are most beneficial as long-term investments. Apart from sensitivity to rate fluctuations, there are many other factors that impact rate values over short periods of time. Generally, financial advisors do not recommend putting money on REITs if you plan to earn your investment within five years. Thus, REITs are ideal investments with an extended timeframe, which is why it’s a good investment for retirement savings.
While investing in REITs diversifies your portfolio, REITs in themselves are not that diversified. Most REITs tend to focus on a particular property sector, such as industrial, hotel, or retail commercial real estate. Remember that each sector has economic strengths and weaknesses. For instance, during the 2020 COVID-19 crisis, lockdown and stay-at-home orders negatively affected the hotel and restaurant industry. Many cafes, hotels, and recreational centers were forced to shut down. REITs under these sectors suffered massive losses, which spelled bad news for investors. So before investing in REITs, consider putting your money in multiple sectors with varying levels of risk.
While publicly traded REITs are highly liquid, non-traded or private REITs are harder to sell or buy. These come with expensive commissions and upfront fees that cost between 9% to 10% of your investment. Private REITs must also be kept for a very long time to obtain significant gains. And since these are non-traded REITs, you cannot readily track them in published performance data. Think about this drawback before deciding to purchase private or non-traded REITs.
Because REITs are required to pay most of their profits as dividends, they must raise more money by issuing new shares for investors. However, investors may not always buy them, especially during a financial crisis or recession. Without enough money, REIT companies may not expand their property or acquire new property right away. Thus, it takes time for them to grow and increase their real estate’s value. But during a growing economy, people tend to make more investments, which means REITs can continue to grow.
Investing in REITs is a wise strategy for anyone willing to open a long-term investment. They usually provide higher returns compared to stocks over the long-term. Once you open a brokerage account, you can buy and sell REITs just as people do with other stocks. It’s a viable way to invest in commercial real estate without having to spend a fortune on directly buying property. Since REITs tend to have a lower risk profile than stocks, they are used by investors to diversify their portfolio and balance out other high-risk investments.
For those who don’t want to trade individual REIT stocks, it makes sense to simply purchase an ETF or mutual fund. This vets and invests a range of REITs for you, which provides you with immediate diversification and less risk. Finally, since REITs pay out large dividends, it’s smart to keep your earnings in a tax advantaged IRA account. It helps you avoid high tax rates and allows you to defer on the distributions. Consider investing in REITs to boost your retirement savings.
REITs allow investors to place specific bets on sectors of the economy or geographic regions.
When Amazon.com announced their plans to launch a second headquarters, some experts like Scott Galloway predicted they would choose either New York City or Washington D.C. Ultimately Amazon.com chose both locations. Investors who believe Amazon.com's real estate transactions in Crystal City will boost the value of neighboring real estate could invest in a REIT like JBS Smith Properties (JBGS) to bet on that thesis. Most REITs have lower liquidity than large corporate stock, so if an investor exits a large position they might push price significantly. While the Amazon.com HQ2 choice should be a boon for JBGS investors, Yale has a large position in the REIT and has sold a significant portion of their stake.
The value of land (and the cashflow it can produce) can change dramatically overnight depending on broader economic conditions & the local economy. The same Crystal City that is viewed as hot before the COVID-19 crisis, crashed about 15 years ago.
Crystal City was once a thriving hub of government agencies and military contractors, but its fortunes sank after a 2005 mandate, in part for antiterrorism concerns, to relocate thousands of jobs from suburban office buildings to nearby military bases. In the following years, Crystal City lost 17,000 jobs, and 4.2 million square feet of office space became vacant.
The COVID-19 crisis impacted the value of many types of commercial real estate with some savvy investors like Jim Chanos considering the untethering to be an interesting investment opportunity to the short side for office REITs like SL Green Realty (NYSE:SLG) and Vornado Realty Trust (NYSE:VNO), as office space was oversupplied before lockdowns and remote work declined demand for office space. Jim Chanos said the office vacancy rate in the United States before COVID-19 was 14% and the all time high prior to the COVID-19 crisis was 19%.

REITs allow investors to invest in many categorical themes. A representitive set of examples by category are listed below.

Know What You Own & Why
The above sectors also have subsectors. and in some cases the business itself can be broken up into component parts with separate valuations and market performance. After the COVID-19 crisis IAC Corporation invested roughly $1 billion in MGM to acquire a 12% stake in the company, betting on the growth of online gambling. They invested in MGM Resorts International (MGM), which is a separate company from MGM Growth Properties (MGP), the REIT segment of the business.
Nareit offers a searchable directory of REIT investments by category including data centers, diversified, health care, industrial, infrastructure, lodging/resorts, mortgage, office, residential, retail, self-storage, specialty & timberlands. They list a total of 192 entities in their database.
The following table lists 165 publicly traded REITs in the United States with their stock price and market capitalization as of close of trade on June 19, 2020.
| Company Name | Ticker | REIT Type | Beta | Yield | 52-week low | share price | 52 week high | Market Cap |
|---|---|---|---|---|---|---|---|---|
| American Tower | AMT | Telecommunications | 0.98 | 1.54% | $174.32 | $265.60 | $269.25 | $117,742,200,000 |
| Crown Castle | CCI | Telecommunications | 0.96 | 2.81% | $114.18 | $170.45 | $176.85 | $71,035,250,000 |
| Prologis | PLD | Industrial | 1.13 | 2.28% | $59.82 | $91.87 | $99.79 | $67,900,160,000 |
| Equinix | EQIX | Data Center | 0.39 | 1.50% | $477.87 | $711.43 | $718.33 | $62,971,910,000 |
| Digital Realty | DLR | Data Center | 0.87 | 3.05% | $105.00 | $139.85 | $158.36 | $37,523,580,000 |
| SBA Communications | SBAC | Telecommunications | 0.42 | 0.64% | $205.20 | $302.30 | $323.03 | $33,744,200,000 |
| Public Storage | PSA | Self-Storage | 0.72 | 4.08% | $155.37 | $190.59 | $266.76 | $33,313,750,000 |
| Equity Residential | EQR | Apartments | 1.00 | 3.72% | $49.62 | $59.58 | $89.55 | $22,171,240,000 |
| AvalonBay Communities | AVB | Apartments | 1.07 | 3.84% | $118.17 | $155.09 | $229.40 | $21,826,020,000 |
| Welltower | WELL | Healthcare | 1.37 | 6.24% | $24.27 | $51.00 | $93.17 | $21,291,440,000 |
| Realty Income Corporation | O | Single Tenant/NNN | 1.22 | 4.32% | $38.00 | $61.53 | $84.92 | $21,130,390,000 |
| Alexandria Real Estate Equities | ARE | Office | 1.04 | 2.38% | $109.22 | $165.84 | $175.74 | $20,928,150,000 |
| Simon Property Group | SPG | Regional Malls | 1.52 | 11.77% | $42.25 | $67.12 | $165.48 | $20,521,750,000 |
| Weyerhaeuser | WY | Timber | 1.76 | 6.07% | $13.10 | $22.70 | $31.58 | $16,938,880,000 |
| Invitation Homes | INVH | Single-Family Houses | 0.89 | 2.11% | $15.64 | $27.84 | $32.70 | $15,544,100,000 |
| Essex Property Trust | ESS | Apartments | 1.04 | 3.26% | $175.81 | $233.78 | $334.17 | $15,293,270,000 |
| Healthpeak Properties | PEAK | Healthcare | 0.25 | 4.14% | $18.63 | $26.32 | $37.93 | $14,167,270,000 |
| Boston Properties | BXP | Office | 1.19 | 4.07% | $71.57 | $90.76 | $147.83 | $14,101,300,000 |
| Sun Communities | SUI | Manufactured Housing | 0.93 | 2.10% | $95.34 | $142.36 | $173.98 | $13,989,650,000 |
| Ventas | VTR | Healthcare | 1.55 | 8.06% | $13.35 | $35.80 | $75.40 | $13,356,080,000 |
| MGM Growth Properties | MGP | Lodging | 1.38 | 6.55% | $11.43 | $28.24 | $34.37 | $13,133,760,000 |
| Mid-America Apartment Communities | MAA | Apartments | 1.05 | 3.35% | $82.00 | $114.68 | $148.88 | $13,113,790,000 |
| Duke Realty | DRE | Logistics | 1.16 | 2.46% | $25.19 | $35.60 | $38.88 | $13,113,010,000 |
| W. P. Carey | WPC | Diversified | 1.22 | 5.83% | $38.62 | $68.96 | $93.62 | $12,267,250,000 |
| Extra Space Storage | EXR | Self-Storage | 0.69 | 3.77% | $72.70 | $92.97 | $124.46 | $12,001,180,000 |
| Vici Properties | VICI | Lodging | 1.23 | 5.20% | $9.85 | $22.48 | $28.75 | $11,996,850,000 |
| Equity LifeStyle Properties | ELS | Manufactured Housing | 0.96 | 1.72% | $41.97 | $64.28 | $77.55 | $11,708,410,000 |
| UDR, Inc. | UDR | Apartments | 1.04 | 3.66% | $29.20 | $37.76 | $51.25 | $11,134,900,000 |
| Medical Properties Trust | MPW | Healthcare | 1.32 | 5.30% | $12.35 | $19.25 | $24.29 | $10,170,400,000 |
| Annaly Capital Management | NLY | Mortgage | 1.06 | 14.37% | $3.51 | $6.69 | $10.50 | $9,569,539,000 |
| Camden Property Trust | CPT | Apartments | 1.07 | 3.42% | $62.48 | $93.51 | $120.73 | $9,106,111,000 |
| CyrusOne | CONE | Data Center | 0.43 | 2.67% | $43.72 | $76.67 | $79.73 | $8,831,795,000 |
| Gaming and Leisure Properties | GLPI | Lodging | 1.02 | 6.37% | $12.81 | $38.00 | $50.08 | $8,323,038,000 |
| Host Hotels & Resorts | HST | Lodging | 1.19 | 6.56% | $7.86 | $11.67 | $18.85 | $8,226,871,000 |
| American Homes 4 Rent | AMH | Single-Family Houses | 0.91 | 0.74% | $17.50 | $26.92 | $29.89 | $8,106,905,000 |
| Iron Mountain | IRM | Data Center | 0.96 | 9.11% | $21.00 | $26.34 | $34.49 | $7,582,834,000 |
| Regency Centers | REG | Shopping Centers | 1.23 | 5.06% | $31.80 | $44.64 | $70.13 | $7,571,392,000 |
| Lamar Advertising Company | LAMR | Advertising | 1.39 | 2.73% | $30.89 | $74.37 | $96.82 | $7,492,967,000 |
| Vornado Realty Trust | VNO | Diversified | 1.31 | 11.46% | $27.64 | $39.15 | $68.68 | $7,482,181,000 |
| VEREIT | VER | Single Tenant/NNN | 1.41 | 7.88% | $3.56 | $6.78 | $10.18 | $7,307,813,000 |
| Kilroy Realty | KRC | Diversified | 1.18 | 2.99% | $45.96 | $62.53 | $88.99 | $7,195,197,000 |
| Omega Healthcare Investors | OHI | Healthcare | 1.32 | 8.27% | $13.33 | $29.56 | $45.22 | $6,707,214,000 |
| Federal Realty Investment Trust | FRT | Shopping Centers | 1.18 | 4.73% | $64.11 | $84.75 | $141.35 | $6,409,900,000 |
| National Retail Properties | NNN | Single Tenant/NNN | 1.17 | 5.55% | $24.04 | $35.84 | $59.26 | $6,163,195,000 |
| STORE Capital | STOR | Single Tenant/NNN | 1.29 | 5.51% | $13.00 | $24.50 | $40.96 | $5,990,371,000 |
| Healthcare Trust of America | HTA | Healthcare | 0.97 | 4.42% | $20.61 | $27.26 | $34.22 | $5,955,792,000 |
| Aimco | AIV | Apartments | 1.18 | 4.05% | $24.53 | $38.15 | $55.68 | $5,679,167,000 |
| Kimco Realty | KIM | Shopping Centers | 1.29 | 8.40% | $7.45 | $12.72 | $21.86 | $5,501,723,000 |
| Douglas Emmett | DEI | Diversified | 1.15 | 3.50% | $23.16 | $30.23 | $45.59 | $5,301,583,000 |
| CubeSmart | CUBE | Self-Storage | 0.80 | 4.66% | $19.61 | $26.91 | $36.32 | $5,209,451,000 |
| Rexford Industrial Realty | REXR | Industrial | 1.05 | 1.84% | $31.79 | $40.99 | $53.48 | $5,067,279,000 |
| American Campus Communities | ACC | Student Housing | 1.36 | 5.06% | $20.13 | $36.63 | $50.94 | $5,040,451,000 |
| First Industrial Realty Trust | FR | Industrial | 1.17 | 2.42% | $25.89 | $38.19 | $46.12 | $4,857,557,000 |
| CoreSite | COR | Data Center | 0.76 | 4.07% | $90.07 | $121.49 | $128.47 | $4,604,878,000 |
| EastGroup Properties | EGP | Industrial | 1.29 | 2.46% | $83.40 | $117.55 | $142.69 | $4,590,860,000 |
| Cousins Properties | CUZ | Office | 1.26 | 3.72% | $21.15 | $30.74 | $42.99 | $4,566,110,000 |
| JBG Smith | JBGS | Diversified | 0.70 | 2.95% | $21.88 | $30.28 | $42.36 | $4,504,475,000 |
| Life Storage | LSI | Self-Storage | 0.86 | 4.25% | $67.31 | $93.98 | $119.61 | $4,408,724,000 |
| STAG Industrial | STAG | Industrial | 1.26 | 4.79% | $17.54 | $29.10 | $33.48 | $4,327,551,000 |
| Starwood Property Trust | STWD | Commercial Mortgage | 1.23 | 12.31% | $7.59 | $15.20 | $26.33 | $4,290,265,000 |
| Healthcare Realty Trust | HR | Healthcare | 0.93 | 3.82% | $24.10 | $30.44 | $37.97 | $4,107,338,000 |
| Highwoods Properties | HIW | Office | 1.30 | 4.86% | $25.10 | $38.60 | $52.76 | $4,009,996,000 |
| SL Green Realty | SLG | Office | 1.47 | 5.38% | $35.16 | $51.87 | $96.39 | $3,970,057,000 |
| Hudson Pacific Properties | HPP | Office | 0.78 | 3.83% | $16.14 | $25.22 | $38.81 | $3,866,123,000 |
| Equity Commonwealth | EQC | Office | 0.34 | 10.92% | $27.62 | $31.56 | $35.08 | $3,834,620,000 |
| Quality Technology Services | QTS | Data Center | 0.86 | 2.81% | $42.64 | $63.08 | $68.97 | $3,810,021,000 |
| Brixmor Property Group | BRX | Shopping Centers | 1.37 | 8.71% | $7.51 | $12.66 | $22.74 | $3,753,050,000 |
| Blackstone Mortgage Trust | BXMT | Mortgage | 1.26 | 9.82% | $12.67 | $25.01 | $40.62 | $3,656,378,000 |
| Agree Realty | ADC | Retail | 0.97 | 3.37% | $45.23 | $67.48 | $80.51 | $3,633,872,000 |
| PS Business Parks | PSB | Industrial | 1.03 | 3.12% | $102.48 | $131.82 | $192.13 | $3,622,340,000 |
| Physicians Realty | DOC | Healthcare | 1.00 | 5.01% | $11.01 | $17.83 | $20.78 | $3,611,635,000 |
| Rayonier | RYN | Timber | 1.35 | 4.53% | $15.96 | $25.08 | $33.10 | $3,419,214,000 |
| New Residential Investment | NRZ | Mortgage | 1.34 | 20.31% | $2.91 | $7.45 | $17.66 | $3,096,587,000 |
| Lexington Realty Trust | LXP | Single Tenant/NNN | 1.01 | 3.78% | $7.86 | $10.67 | $11.82 | $2,947,650,000 |
| Corporate Office Properties Trust | OFC | Office | 1.12 | 4.28% | $15.23 | $25.36 | $30.57 | $2,844,618,000 |
| EPR Properties | EPR | Diversified | 1.82 | 12.00% | $12.56 | $36.68 | $79.80 | $2,841,977,000 |
| National Health Investors | NHI | Healthcare | 1.54 | 6.71% | $31.37 | $59.93 | $91.12 | $2,675,875,000 |
| PotlatchDeltic | PCH | Timber | 1.34 | 4.18% | $22.40 | $38.30 | $45.42 | $2,564,247,000 |
| Park Hotels & Resorts | PK | Lodging | 2.08 | 20.25% | $3.99 | $10.71 | $28.37 | $2,523,214,000 |
| Weingarten Realty | WRI | Shopping Centers | 1.31 | 8.20% | $12.21 | $18.51 | $32.17 | $2,371,190,000 |
| Outfront Media | OUT | Advertising | 2.08 | 9.51% | $7.07 | $16.02 | $31.20 | $2,312,543,000 |
| Taubman Centers | TCO | Regional Malls | 0.64 | 7.23% | $26.24 | $37.31 | $53.40 | $2,298,609,000 |
| Apple Hospitality | APLE | Lodging | 1.47 | 8.56% | $4.48 | $10.02 | $16.88 | $2,236,631,000 |
| Hannon Armstrong Sustainable Infrastructure Capital | HASI | Energy Infrastructure | 1.26 | 4.57% | $15.01 | $29.17 | $39.91 | $2,140,728,000 |
| Chimera Investment | CIM | Mortgage | 1.05 | 18.67% | $6.42 | $10.26 | $22.99 | $1,972,159,000 |
| Ryman Hospitality Properties | RHP | Lodging | 1.81 | 10.00% | $13.25 | $35.18 | $91.57 | $1,933,861,000 |
| National Storage Affiliates Trust | NSA | Self-storage | 0.92 | 4.22% | $19.34 | $28.27 | $38.22 | $1,926,424,000 |
| Pebblebrook Hotel Trust | PEB | Lodging | 1.41 | 8.08% | $5.39 | $13.57 | $29.57 | $1,774,362,000 |
| Brandywine Realty Trust | BDN | Office | 1.28 | 7.25% | $7.48 | $10.36 | $16.25 | $1,766,334,000 |
| Easterly Government Properties | DEA | Governmental | 0.72 | 4.32% | $17.72 | $23.50 | $29.70 | $1,765,241,000 |
| Paramount Group | PGRE | Office | 1.22 | 4.94% | $6.42 | $7.86 | $15.00 | $1,742,958,000 |
| American Assets Trust | AAT | Office | 1.29 | 3.90% | $20.15 | $28.28 | $49.26 | $1,698,729,000 |
| Four Corners Property Trust | FCPT | Retail - Restaurants | 1.69 | 4.81% | $12.80 | $23.72 | $32.50 | $1,668,082,000 |
| PennyMac Mortgage Investment Trust | PMT | Mortgage | 1.32 | 10.09% | $3.50 | $16.69 | $23.79 | $1,666,353,000 |
| RLJ Lodging Trust | RLJ | Lodging | 1.80 | 9.67% | $3.88 | $9.67 | $18.17 | $1,596,566,000 |
| Columbia Property Trust | CXP | Office | 1.54 | 5.90% | $7.63 | $13.63 | $22.71 | $1,559,452,000 |
| Apollo Commercial Real Estate Finance | ARI | Commercial Mortgages | 1.32 | 17.71% | $4.12 | $9.83 | $19.76 | $1,512,078,000 |
| Global Net Lease | GNL | Single Tenant/NNN | 1.44 | 9.51% | $8.77 | $16.68 | $21.71 | $1,492,264,000 |
| LTC Properties | LTC | Healthcare / Senior Housing | 1.35 | 5.84% | $24.49 | $37.74 | $53.04 | $1,480,082,000 |
| SITE Centers | SITC | Shopping Centers | 1.36 | N/A | $3.60 | $7.56 | $15.85 | $1,460,208,000 |
| GEO Group | GEO | Private Prisons | 1.17 | 15.87% | $9.95 | $11.83 | $23.29 | $1,435,712,000 |
| Two Harbors Investment | TWO | Mortgage | 1.02 | 24.39% | $2.25 | $5.24 | $15.85 | $1,433,307,000 |
| Mack-Cali Realty Corporation | CLI | Office | 1.11 | 4.97% | $12.90 | $15.74 | $24.24 | $1,425,990,000 |
| Monmouth Real Estate Investment | MNR | Single Tenant/NNN | 1.26 | 4.46% | $8.42 | $14.49 | $15.53 | $1,418,326,000 |
| Retail Properties of America | RPAI | Shopping Centers | 1.22 | 9.73% | $2.87 | $6.47 | $14.30 | $1,385,369,000 |
| Macerich | MAC | Regional Malls | 1.45 | 32.29% | $4.56 | $8.85 | $32.36 | $1,345,313,000 |
| Alexander's | ALX | Diversified | 0.67 | 7.04% | $223.03 | $257.27 | $394.70 | $1,313,953,000 |
| Empire State Realty Trust | ESRT | Office & Retail | 1.15 | 6.07% | $6.47 | $6.85 | $15.71 | $1,201,910,000 |
| CoreCivic | CXW | Private Prisons | 1.50 | 17.27% | $8.33 | $9.84 | $23.37 | $1,177,145,000 |
| Universal Health Realty Income Trust | UHT | Healthcare | 1.58 | 3.08% | $54.54 | $85.18 | $132.41 | $1,171,910,000 |
| MFA Financial | MFA | Mortgage | 0.83 | 30.65% | $0.32 | $2.54 | $8.09 | $1,150,914,000 |
| Acadia Realty Trust | AKR | Retail | 1.08 | 8.24% | $9.59 | $13.29 | $29.55 | $1,144,134,000 |
| DiamondRock Hospitality | DRH | Lodging | 1.47 | 6.36% | $1.96 | $5.66 | $11.79 | $1,127,717,000 |
| iStar | STAR | Commercial & Retail Ground Lease | 1.50 | 3.09% | $5.48 | $12.85 | $17.50 | $1,102,304,000 |
| Xenia Hotels & Resorts | XHR | Lodging | 1.13 | N/A | $6.15 | $9.57 | $22.39 | $1,085,783,000 |
| Arbor Realty Trust | ABR | Commercial Mortgages | 1.32 | 12.11% | $3.54 | $9.67 | $15.77 | $1,066,131,000 |
| Community Healthcare Trust | CHCT | Healthcare | 1.51 | 3.80% | $20.12 | $43.44 | $52.33 | $962,797,900 |
| Kite Realty Group Trust | KRG | Shopping Centers | 1.58 | 10.68% | $6.87 | $11.34 | $19.77 | $953,896,000 |
| Ladder Capital | LADR | Commercial Mortgages | 1.79 | 17.04% | $2.65 | $7.76 | $18.97 | $935,054,500 |
| Investors Real Estate Trust | IRET | Apartments | 0.90 | 6.62% | $43.58 | $70.45 | $85.24 | $927,537,400 |
| Alexander & Baldwin | ALEX | Shopping Centers | 1.50 | 5.84% | $8.32 | $12.70 | $25.38 | $918,292,700 |
| NexPoint Residential Trust | NXRT | Apartments | 1.36 | 3.31% | $21.06 | $34.84 | $52.87 | $846,592,900 |
| Invesco Mortgage Capital | IVR | Mortgage | 1.38 | 41.48% | $1.56 | $4.34 | $15.73 | $833,110,100 |
| Redwood Trust | RWT | Mortgage | 1.13 | 17.38% | $2.14 | $6.61 | $18.01 | $759,019,200 |
| Saul Centers | BFS | Shopping Centers | 1.46 | 6.39% | $23.58 | $32.49 | $57.29 | $753,768,000 |
| Tanger Factory Outlet Centers | SKT | Shopping Centers | 1.47 | 18.97% | $4.05 | $7.17 | $17.94 | $670,151,300 |
| Summit Hotel Properties | INN | Lodging | 1.40 | 11.21% | $2.32 | $6.09 | $12.59 | $643,122,400 |
| ARMOUR Residential | ARR | Mortgage | 1.38 | 23.08% | $4.95 | $8.99 | $21.15 | $580,630,800 |
| Global Medical | GMRE | Healthcare | 1.15 | 6.48% | $6.98 | $12.07 | $15.95 | $543,303,900 |
| RPT Realty | RPT | Shopping Centers | 1.35 | 12.43% | $4.62 | $6.71 | $15.18 | $540,732,400 |
| Capstead Mortgage | CMO | Mortgage | 1.31 | 9.54% | $1.97 | $5.47 | $9.25 | $527,279,100 |
| UMH Properties | UMH | Manufactured Housing | 1.25 | 5.71% | $8.63 | $12.68 | $16.64 | $522,043,500 |
| City Office | CIO | Office | 1.07 | 8.19% | $6.50 | $9.96 | $14.50 | $473,812,300 |
| Urstadt Biddle Properties | UBA | Shopping Centers | 1.68 | 8.85% | $10.05 | $11.99 | $24.88 | $461,355,800 |
| Urstadt Biddle Properties | UBP | Shopping Centers | 1.11 | 10.67% | $8.30 | $10.10 | $19.87 | $461,355,800 |
| CatchMark Timber Trust | CTT | Timber | 1.35 | 6.43% | $5.13 | $8.55 | $12.54 | $416,744,400 |
| Preferred Apartment Communities | APTS | Apartments | 1.05 | 13.82% | $5.27 | $7.48 | $15.32 | $355,937,600 |
| One Liberty Properties | OLP | Diversified | 1.25 | 9.75% | $9.71 | $17.14 | $31.32 | $345,406,200 |
| Dynex Capital | DX | Mortgage | 0.89 | 13.16% | $7.04 | $14.33 | $20.34 | $329,331,700 |
| Jernigan Capital | JCAP | Self-storage | 0.95 | 8.91% | $8.83 | $14.13 | $21.48 | $328,828,400 |
| Transcontinental Realty Investors | TCI | Diversified | 0.82 | N/A | $16.00 | $36.15 | $41.50 | $315,147,300 |
| New Senior Investment Group | SNR | Healthcare / Senior Living | 1.78 | 14.29% | $1.72 | $3.76 | $8.35 | $311,629,600 |
| Ares Commercial Real Estate | ACRE | Commercial Mortgages | 1.72 | 14.55% | $2.78 | $9.12 | $17.72 | $304,990,500 |
| Orchid Island Capital | ORC | Mortgage | 1.24 | 20.56% | $1.53 | $4.52 | $6.94 | $299,389,600 |
| Chatham Lodging Trust | CLDT | Lodging | 1.73 | 14.35% | $3.44 | $6.29 | $19.52 | $295,398,000 |
| Whitestone | WSR | Diversified | 1.39 | 13.35% | $4.71 | $6.88 | $14.65 | $289,895,500 |
| Hersha Hospitality Trust | HT | Lodging | 2.02 | 17.26% | $2.29 | $6.23 | $17.10 | $241,190,800 |
| Great Ajax | AJX | Mortgage | 1.06 | 14.20% | $3.96 | $9.01 | $15.42 | $206,526,600 |
| Farmland Partners | FPI | Agriculture | 0.77 | 2.95% | $5.05 | $6.60 | $7.50 | $197,115,600 |
| Washington Prime Group | WPG | Regional Malls | 1.95 | 90.93% | $0.56 | $1.00 | $4.69 | $187,361,300 |
| BRT Apartments | BRT | Apartments | 1.10 | 7.12% | $6.00 | $10.66 | $18.75 | $183,100,400 |
| Anworth Mortgage Asset Corporation | ANH | Mortgage | 1.44 | 16.48% | $0.79 | $1.78 | $3.95 | $176,115,600 |
| Cherry Hill Mortgage Investment | CHMI | Mortgage | 1.60 | 18.41% | $2.76 | $9.22 | $16.04 | $157,243,700 |
| CorEnergy Infrastructure Trust | CORR | Energy | 1.58 | 26.02% | $9.25 | $11.34 | $49.75 | $154,808,200 |
| Western Asset Mortgage Capital | WMC | Mortgage | 1.11 | 32.29% | $1.37 | $2.75 | $11.33 | $146,915,700 |
| Ellington Residential Mortgage | EARN | Mortgage | 1.43 | 10.87% | $2.70 | $10.40 | $11.88 | $128,124,000 |
| Braemar Hotels & Resorts | BHR | Lodging | 2.14 | 14.20% | $1.14 | $3.31 | $10.39 | $111,000,800 |
| Pennsylvania Real Estate Investment Trust | PEI | Regional Malls | 1.52 | 57.93% | $0.80 | $1.36 | $6.68 | $107,271,900 |
| Arlington Asset Investment | AI | Mortgage | 1.75 | N/A | $1.40 | $2.82 | $7.07 | $103,820,400 |
| Cedar Realty Trust | CDR | Shopping Centers | 1.72 | 14.95% | $0.53 | $1.01 | $3.69 | $90,221,270 |
| Ashford Hospitality Trust | AHT | Lodging | 1.49 | 20.27% | $0.47 | $0.84 | $3.44 | $88,430,040 |
| Exantas Capital | XAN | Commercial Mortgages | 1.90 | 36.35% | $0.95 | $2.65 | $12.51 | $84,911,460 |
| Hunt Companies Financial Trust | HCFT | Commercial Mortgages | 0.78 | 11.19% | $0.86 | $2.52 | $3.50 | $62,845,990 |
| CBL Properties | CBL | Regional Malls | 1.57 | N/A | $0.18 | $0.30 | $1.78 | $56,842,570 |
| InnSuites Hospitality | IHT | Lodging | 0.47 | N/A | $0.67 | $0.98 | $1.70 | $9,122,840 |
Explore conventional mortgages, FHA loans, USDA loans, and VA loans to find out which option is right for you.
Check your options with a trusted El Monte lender.
Answer a few questions below and connect with a lender who can help you save today!