
If you're interested in the current state of the US mortgage market, you need look no further. We've gathered together some of the most telling mortgage statistics to give you a general overview of the American housing market.
The financial crisis of 2007 and 2008 sent the American housing market into a tailspin. New construction all but ground to a halt, and the market for existing homes was at its lowest point in recent history. As hundreds of thousands of families watched the equity in their homes slip away, the demand for new mortgages dropped sharply. It's been a long slow struggle back, but the US economy is finally making a welcome recovery. New constructions are on the rise, the real estate market has rebounded strongly in the 15 years since the crisis. Proof of the recovery, if proof were needed, can be found in the annual mortgage statistics that are collated by both the government and other independent research firms.

COVID-19 & The American Mortgage Market
The COVID-19 crisis of 2020 had a much more muted impact on real estate prices than the popping of the prior housing bubble as politicians and central bankers acted much faster and much more aggressively to counteract the economic slowdown. As a matter of fact, Fannie Mae predicted 2020 would be a record year for residential mortgage originations across the United States. They projected $4.1 trillion in total loan volume with around $2.7 trillion of that being refinance volume. In the years after the COVID-19 crisis the easy money policies which papered over the market uncertainty led to a real estate boom. The Federal Reserve then raised interest rates quickly in 2022 and 2023, which has led to transaction volume slowdown while price appreciation slowed markedly.
The US mortgage market continues to feel the effects of the sub-prime mortgage crisis, but the numbers are on the rise. According to the Federal Reserve, outstanding mortgage debt for single family residences declined significantly from 2011 to 2012, but has been growing in fits and starts since 2013. Interestingly, outstanding mortgages for multifamily residences held steady, and even managed grow, despite the economic crisis. By contrast, commercial mortgages have remained relatively steady, even showing some consistent growth over the same four year period.
Nearly a decade after the 2008-2009 financial crisis the Federal Reserve started raising interest rates in earnest in 2017 & 2018. Increased rates caused the total residential mortgage production volume to fall nearly 7% between 2017 and 2018. The MBA estimated $1.64 trillion in production in 2018, while production stood at $1.76 trillion in 2017.
In October 3, 2017 Federal Reserve Chairman Jerome Powell stated rates were "a long way" from neutral. The stock market fell hard for the duration of the year, with the bottom happening on Christmas eve. In early 2019 the Federal Reserve changed their stated approach, announcing they did not expect to raise rates in 2019 & were going to end the wind down of their balance sheet this year. Rates which rose throughout most of 2018 fell hard in early 2019, reinvigorating what was a stagnant refinance market.
The COVID-19 crisis created a boom in home purchase loans and in mortgage refinances. Interest rates fell, causing refinance volume to jump to around $2.7 trillion while the total transaction volume for 2020 amounted to $4.1 trillion. Social unrest, lock downs, high urban living costs, and working from home from tight quarters made many city dwellers buy second larger homes in the suburbs or more remote areas. 2021 was another record year, with $4.43 trillion in mortgage originations.

Typical Annual Mortgage Loan Origination Volume in the United States
Typically there is around $1.5 to $2.3 trillion of mortgage originations in the United States annually. When interest rates fall sharply the production volume increases as refinance becomes a larger share of the overall market. This graph from the MBA shows how refinance became the vast majority of the market after the dot-com crash, in the wake of the Great Recession, & after the COVID-19 crisis. Data shown for 2024 and 2025 are estimates. 2023 contains estimates for the back half of the year.
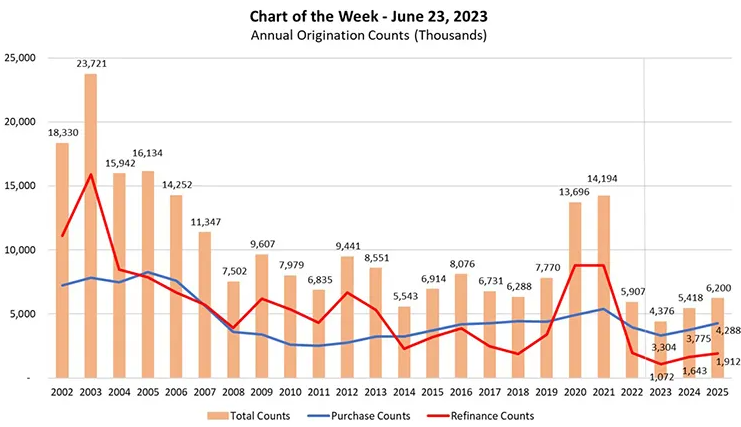
The aftermath of rate hikes from persistently high inflation in 2022 and 2023 caused home purchases, refinance, and home-equity lending to fall by 2/3, with purchases and refinances falling from over 14 million to under 5 million in 2 years. In the first quarter of 2023 there were 1.25 million mortgage originations - down 19% QoQ, 56% YoY, and 70% from the peak in Q1 2021.
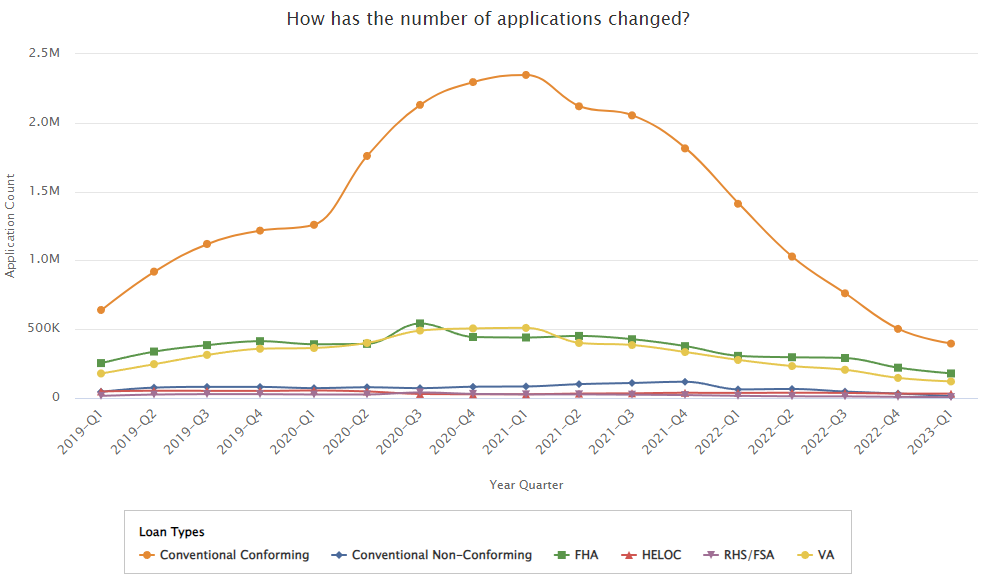
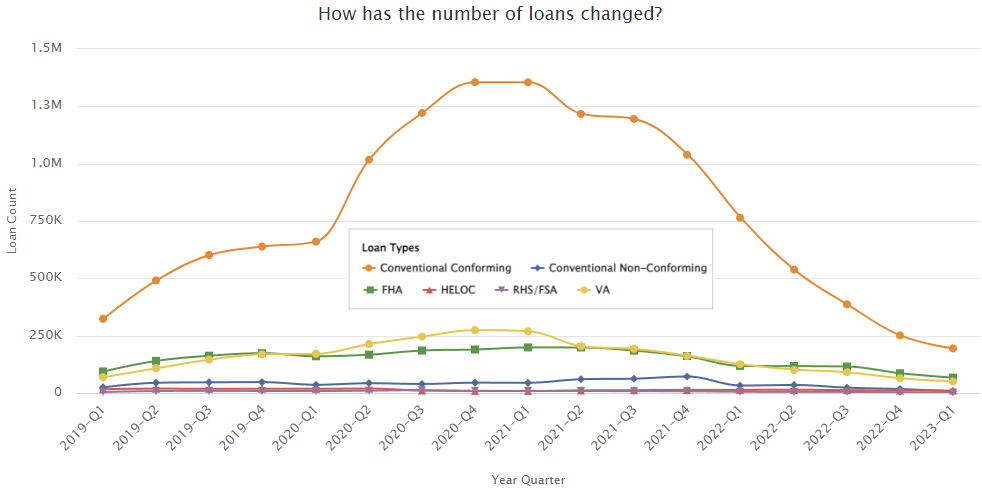
The following graphs show how mortgage applications and approvals changed over the past half decade. It is easy to see how the Federal Reserve ZIRP and QE policies drove a big spike in mortgage refinances. In the second graph you can see that the spike was mostly in conforming conventional loans, which makes sense since most refinances are into conventional loans since they do not require PMI if the LTV is 80% or below.
The following GIFs of the United States break down annual demand for mortgage refinances versus mortgage purchases. You can see how refinances respond much more quickly to changes in interest rates as they do not require moving.
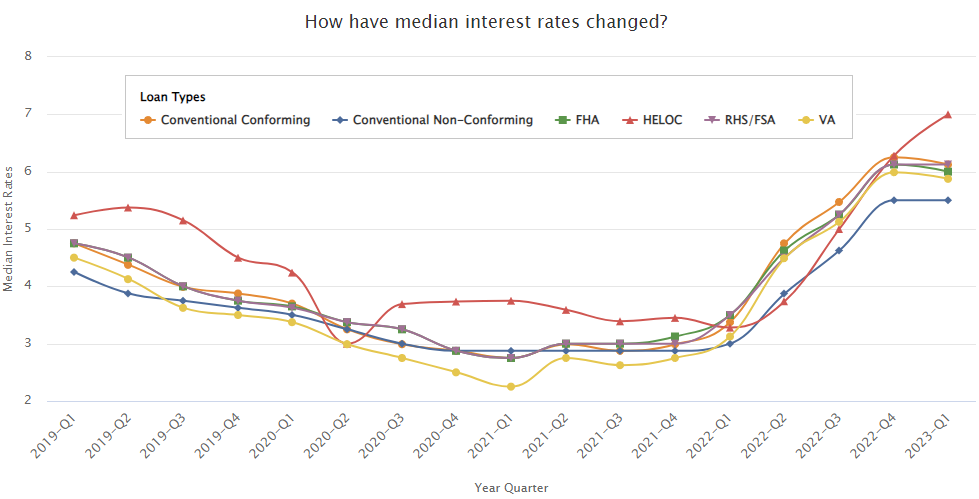
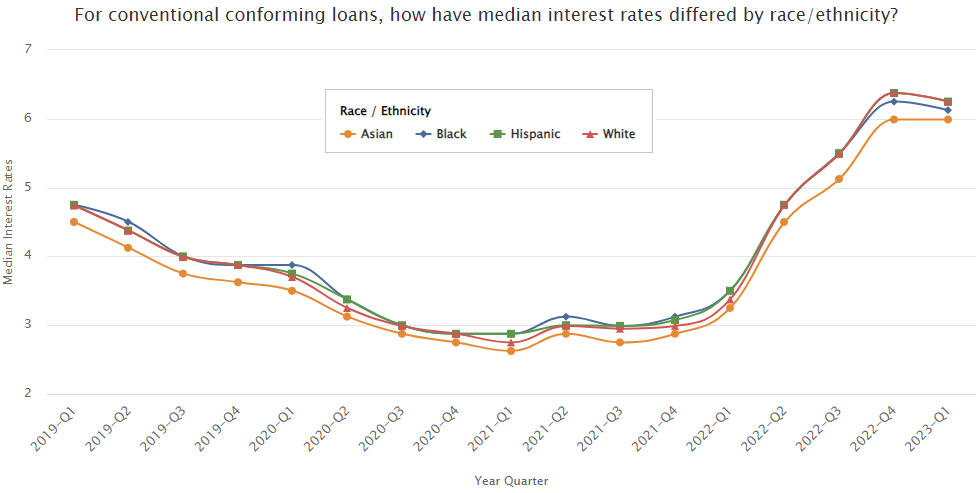
The following graph of median interest rates by quarter does a good job explaining the above trends.
Each year the Mortgage Bankers Association estimates the total production volume of 1 to 4 family unit residiential mortgages across the United States. Here is their annual mortgage origination volume estimate data from 1990 through 2026, with amounts listed in billions of Dollars.
| Year | Total | Purchase | Refinance | Refi Share |
|---|---|---|---|---|
| 1990 | 458 | 389 | 70 | 15.3% |
| 1991 | 562 | 385 | 177 | 31.5% |
| 1992 | 894 | 472 | 421 | 47.1% |
| 1993 | 1,020 | 486 | 535 | 52.5% |
| 1994 | 769 | 557 | 211 | 27.4% |
| 1995 | 639 | 494 | 145 | 22.7% |
| 1996 | 785 | 559 | 225 | 28.7% |
| 1997 | 834 | 590 | 243 | 29.1% |
| 1998 | 1,656 | 795 | 862 | 52.1% |
| 1999 | 1,379 | 878 | 500 | 36.3% |
| 2000 | 1,139 | 905 | 234 | 20.5% |
| 2001 | 2,243 | 960 | 1,283 | 57.2% |
| 2002 | 2,854 | 1,097 | 1,757 | 61.6% |
| 2003 | 3,812 | 1,280 | 2,532 | 66.4% |
| 2004 | 2,773 | 1,309 | 1,463 | 52.8% |
| 2005 | 3,027 | 1,512 | 1,514 | 50.0% |
| 2006 | 2,726 | 1,399 | 1,326 | 48.6% |
| 2007 | 2,306 | 1,140 | 1,166 | 50.6% |
| 2008 | 1,509 | 731 | 777 | 51.5% |
| 2009 | 1,995 | 664 | 1,331 | 66.7% |
| 2010 | 1,698 | 530 | 1,168 | 68.8% |
| 2011 | 1,436 | 505 | 931 | 64.8% |
| 2012 | 2,044 | 588 | 1,456 | 71.2% |
| 2013 | 1,845 | 734 | 1,111 | 60.2% |
| 2014 | 1,261 | 759 | 502 | 39.8% |
| 2015 | 1,679 | 903 | 776 | 46.2% |
| 2016 | 2,051 | 1,052 | 999 | 48.7% |
| 2017 | 1,760 | 1,143 | 616 | 35.0% |
| 2018 | 1,677 | 1,209 | 467 | 27.8% |
| 2019 | 2,253 | 1,225 | 1,028 | 45.6% |
| 2020 | 4,108 | 1,482 | 2,625 | 64% |
| 2021 | 4,436 | 1,863 | 2,574 | 58% |
| 2022 | 2,305 | 1,619 | 686 | 30% |
| 2023 | 1,639 | 1,325 | 314 | 19% |
| 2024 | 1,949 | 1,471 | 478 | 25% |
| 2025 | 2,254 | 1,639 | 616 | 27% |
| 2026 | 2,382 | 1,747 | 635 | 27% |
Data from years 2023 through 2026 contain estimates, made using information available on October 15, 2023.
The MBA estimates $13.61 trillion in mortgage debt oustanding on 1-to-4 family homes at the end of 2022. They anticipate the following mortgage debt outstanding in future years:
Each real estate market is local, however on a nationwide basis homes are not particularly affordable. In the wake of the COVID-19 lockdowns the Federal Reserve engaged in ZIRP and QE. This in turn drove a large wave of mortgage activity which stimulated the economy. Home prices increased to reflect the lower interest rates. As inflation took hold and became more persistent than expected the Federal Reserve had to sharply increase the Fed Funds rate in 2022 and 2023.
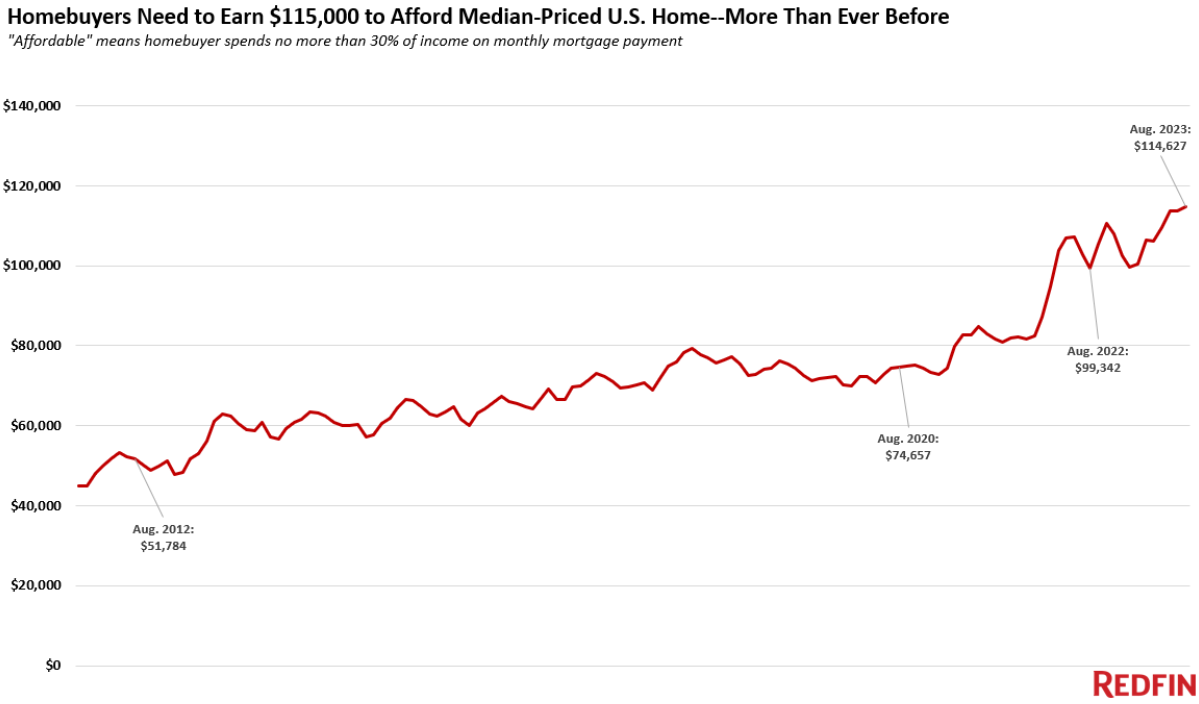
At the end of Q2 in 2023 Redfin estimated buying a median-priced home would require an annual income of around $115,000 after factoring in all costs of ownership - an amount that has jumped 50% since the COVID-19 crisis. The median U.S. household income in 2022 was only $75,000 according to the U.S. Census Bureau.
Redfin also compiled median home price and required income statics for 100 large metro areas across the country.
| U.S. metro area | Required annual income | YoY change | Monthly mortgage payment | Median home-sale price |
|---|---|---|---|---|
| Akron, OH | $59,702 | 18.4% | $1,493 | $218,900 |
| Albany, NY | $87,276 | 26.0% | $2,182 | $320,000 |
| Allentown, PA | $88,639 | 23.2% | $2,216 | $325,000 |
| Anaheim, CA | $300,010 | 28.6% | $7,500 | $1,100,000 |
| Atlanta, GA | $107,731 | 19.4% | $2,693 | $395,000 |
| Austin, TX | $126,208 | 7.7% | $3,155 | $462,748 |
| Bakersfield, CA | $100,258 | 22.2% | $2,506 | $367,600 |
| Baltimore, MD | $103,640 | 21.1% | $2,591 | $380,000 |
| Baton Rouge, LA | $71,184 | 21.5% | $1,780 | $261,000 |
| Birmingham, AL | $76,912 | 16.3% | $1,923 | $282,000 |
| Boise City, ID | $126,869 | 9.1% | $3,172 | $465,170 |
| Boston, MA | $194,188 | 22.7% | $4,855 | $712,000 |
| Bridgeport, CT | $182,734 | 32.1% | $4,568 | $670,000 |
| Buffalo, NY | $70,093 | 25.1% | $1,752 | $257,000 |
| Camden, NJ | $91,367 | 27.8% | $2,284 | $335,000 |
| Cape Coral, FL | $108,249 | 16.9% | $2,706 | $396,900 |
| Charleston, SC | $112,231 | 17.9% | $2,806 | $411,500 |
| Charlotte, NC | $108,822 | 16.0% | $2,721 | $399,000 |
| Chicago, IL | $91,367 | 25.7% | $2,284 | $335,000 |
| Cincinnati, OH | $77,730 | 27.5% | $1,943 | $285,000 |
| Cleveland, OH | $61,536 | 22.1% | $1,538 | $225,625 |
| Columbus, OH | $90,276 | 23.8% | $2,257 | $331,000 |
| Dallas, TX | $115,913 | 15.0% | $2,898 | $425,000 |
| Dayton, OH | $60,002 | 31.2% | $1,500 | $220,000 |
| Denver, CO | $158,187 | 17.3% | $3,955 | $579,999 |
| Des Moines, IA | $79,094 | 25.0% | $1,977 | $290,000 |
| Detroit, MI | $51,793 | 19.4% | $1,295 | $189,900 |
| El Paso, TX | $69,548 | 23.6% | $1,739 | $255,000 |
| Elgin, IL | $92,730 | 27.6% | $2,318 | $340,000 |
| Fort Lauderdale, FL | $114,549 | 22.2% | $2,864 | $420,000 |
| Fort Worth, TX | $98,185 | 13.2% | $2,455 | $360,000 |
| Frederick, MD | $145,407 | 18.1% | $3,635 | $533,140 |
| Fresno, CA | $114,275 | 23.4% | $2,857 | $418,995 |
| Gary, IN | $72,125 | 18.3% | $1,803 | $264,450 |
| Grand Rapids, MI | $88,639 | 24.0% | $2,216 | $325,000 |
| Greensboro, NC | $76,503 | 23.1% | $1,913 | $280,500 |
| Greenville, SC | $87,821 | 18.9% | $2,196 | $322,000 |
| Hartford, CT | $94,640 | 30.2% | $2,366 | $347,000 |
| Honolulu, HI | $188,188 | 15.9% | $4,705 | $690,000 |
| Houston, TX | $92,185 | 15.6% | $2,305 | $338,000 |
| Indianapolis, IN | $81,794 | 23.7% | $2,045 | $299,900 |
| Jacksonville, FL | $99,549 | 15.2% | $2,489 | $365,000 |
| Kansas City, MO | $89,185 | 23.1% | $2,230 | $327,000 |
| Knoxville, TN | $102,276 | 28.1% | $2,557 | $375,000 |
| Lake County, IL | $95,458 | 28.9% | $2,386 | $350,000 |
| Lakeland, FL | $88,639 | 13.4% | $2,216 | $325,000 |
| Las Vegas, NV | $113,186 | 14.9% | $2,830 | $415,000 |
| Little Rock, AR | $62,729 | 13.9% | $1,568 | $230,000 |
| Los Angeles, CA | $237,281 | 19.8% | $5,932 | $870,000 |
| Louisville, KY | $73,612 | 20.8% | $1,840 | $269,900 |
| McAllen, TX | $68,184 | 29.8% | $1,705 | $249,999 |
| Memphis, TN | $79,094 | 16.3% | $1,977 | $290,000 |
| Miami, FL | $143,187 | 33.4% | $3,580 | $525,000 |
| Milwaukee, WI | $87,548 | 28.8% | $2,189 | $321,000 |
| Minneapolis, MN | $103,640 | 19.5% | $2,591 | $380,000 |
| Montgomery County, PA | $130,886 | 28.3% | $3,272 | $479,900 |
| Nashville, TN | $124,095 | 19.0% | $3,102 | $455,000 |
| Nassau County, NY | $177,279 | 20.0% | $4,432 | $650,000 |
| New Brunswick, NJ | $141,823 | 26.9% | $3,546 | $520,000 |
| New Haven, CT | $91,367 | 21.8% | $2,284 | $335,000 |
| New Orleans, LA | $75,003 | 15.1% | $1,875 | $275,000 |
| New York, NY | $197,734 | 20.5% | $4,943 | $725,000 |
| Newark, NJ | $159,551 | 33.4% | $3,989 | $585,000 |
| North Port, FL | $123,888 | 17.4% | $3,097 | $454,240 |
| Oakland, CA | $249,554 | 17.0% | $6,239 | $915,000 |
| Oklahoma City, OK | $71,457 | 19.1% | $1,786 | $262,000 |
| Omaha, NE | $83,185 | 25.8% | $2,080 | $305,000 |
| Orlando, FL | $108,597 | 18.5% | $2,715 | $398,175 |
| Oxnard, CA | $233,190 | 23.6% | $5,830 | $855,000 |
| Philadelphia, PA | $75,003 | 16.3% | $1,875 | $275,000 |
| Phoenix, AZ | $121,368 | 13.6% | $3,034 | $445,000 |
| Pittsburgh, PA | $64,639 | 22.5% | $1,616 | $237,000 |
| Portland, OR | $149,023 | 15.6% | $3,726 | $546,400 |
| Providence, RI | $125,459 | 28.9% | $3,136 | $460,000 |
| Raleigh, NC | $120,004 | 17.4% | $3,000 | $440,000 |
| Richmond, VA | $102,276 | 24.6% | $2,557 | $375,000 |
| Riverside, CA | $151,369 | 17.6% | $3,784 | $555,000 |
| Rochester, NY | $65,866 | 30.7% | $1,647 | $241,500 |
| Sacramento, CA | $156,824 | 17.8% | $3,921 | $575,000 |
| Salt Lake City, UT | $139,096 | 13.0% | $3,477 | $510,000 |
| San Antonio, TX | $87,273 | 14.5% | $2,182 | $319,990 |
| San Diego, CA | $241,372 | 28.7% | $6,034 | $885,000 |
| San Francisco, CA | $404,332 | 23.2% | $10,108 | $1,482,500 |
| San Jose, CA | $402,287 | 24.8% | $10,057 | $1,475,000 |
| Seattle, WA | $214,904 | 18.3% | $5,373 | $787,956 |
| St. Louis, MO | $70,912 | 21.0% | $1,773 | $260,000 |
| Stockton, CA | $144,550 | 15.2% | $3,614 | $530,000 |
| Tacoma, WA | $149,855 | 17.7% | $3,746 | $549,450 |
| Tampa, FL | $103,613 | 17.3% | $2,590 | $379,900 |
| Tucson, AZ | $99,549 | 21.3% | $2,489 | $365,000 |
| Tulsa, OK | $69,548 | 23.6% | $1,739 | $255,000 |
| Virginia Beach, VA | $93,003 | 25.9% | $2,325 | $341,000 |
| Warren, MI | $82,571 | 21.4% | $2,064 | $302,749 |
| Washington, DC | $150,005 | 23.0% | $3,750 | $550,000 |
| West Palm Beach, FL | $125,459 | 24.4% | $3,136 | $460,000 |
| Wilmington, DE | $90,412 | 21.5% | $2,260 | $331,500 |
| Worcester, MA | $118,640 | 23.4% | $2,966 | $435,000 |

It's Getting A Bit Frothy
The recent run up in mortgage rates has made buying much more expensive. According to CBRE analysis the average new monthly mortgage payment in 2023 is 52% higher than the average appartment rent. In the second quarter of 2006 that ratio peaked at 33%, which led to the housing crash Great Recession.
For these numbers to come in better alignment some combination of the following 3 are required:
The Mortgage Bankers Association records quarterly data on how much independent mortgage companies and hom-loan subsidiaries of chartered banks make on loans. Due to heavy buying of mortgage-backed securities by the Federal Reserve and record loan volumes from falling interest rates loan originators made 203 basis points of the loan principal in the third quarter of 2020. Given an average loan size of $282,660 that equated to a profit of $5,535 per loan. This performance was significantly above the same quarter in the year prior, when lenders earned 73.8 basis points, or $1,924 of net income on each loan. The strong performance was due in part to the large share of refinance loans after the Federal Reserve implemented ZIRP, did QE, and bought MBS paper.
Many nonbank mortgage lenders publicly listed their stock during the refinance boom to take advantage of valuations based on the temporary elevated profitability levels.
Don't Fight The Federal Reserve!
All of the above companies quickly fell as the Federal Reserve raised the Fed Funds Rate and mortgage volumes cratered as mortgage rates took off. Other nonbank lenders like AmeriHome and Caliber Home Loans also considered listing, but pulled IPOs which would have likely turned out similar to the Better SPAC.
After the Federal Reserve hiked rates rapidly in 2022 and 2023 the mortgage market rapidly deteriorated, with the refinance share falling from 64% in 2020 down to 19% in 2023. Independent mortgage banks had an average profit of $2,339 per loan in 2021 and lost an average of $301 per originated loan in 2022.
The MBA sells a detailed production statistics report with stats going back to 2008. Since 2008 most quarters have seen a net production income of between 25 and 75 basis points.
In Q3 2020 mortgage lenders had a per-loan expense of $7,452. This is up from $7,217 in the same quarter of 2019. Costs rose in the third quarter of 2020 over a cost of $6,566 in the second quarter of 2020 due to increased spending on hiring personnel to service unusually high demand caused by record low mortgage rates.
On December 1, 2020 the FHFA allowed the GSEs Fannie Mae and Freddie Mac to pass on a 50 basis point adverse market conditions fee for most mortgage refinances with a balance above $125,000. This fee was implemented to help protect the GSEs from an estimated $6 billion in COVID-19 related losses.
The cost to originate each loan had ballooned to $10,624 in 2022.
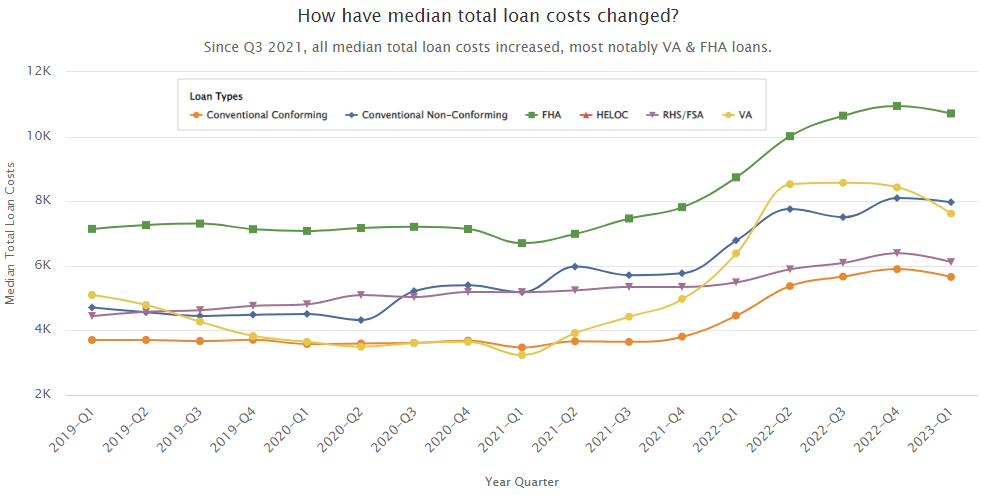
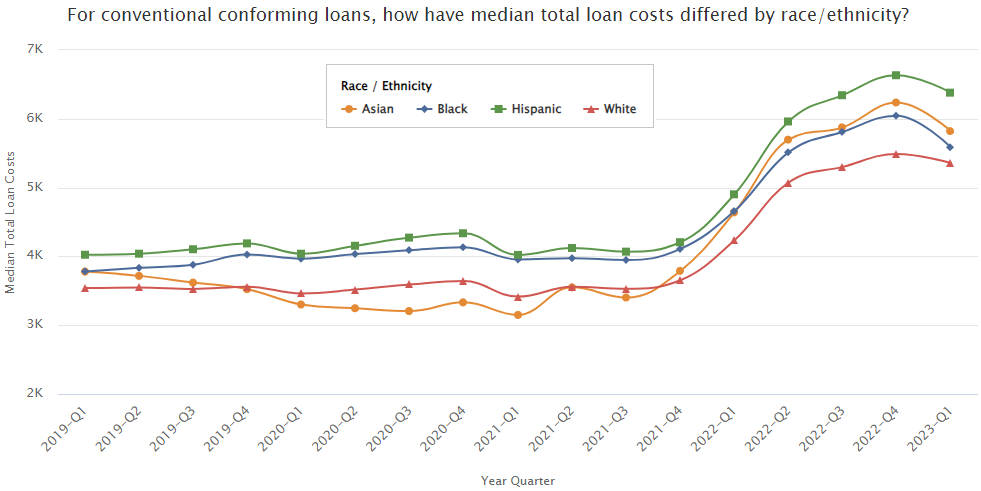
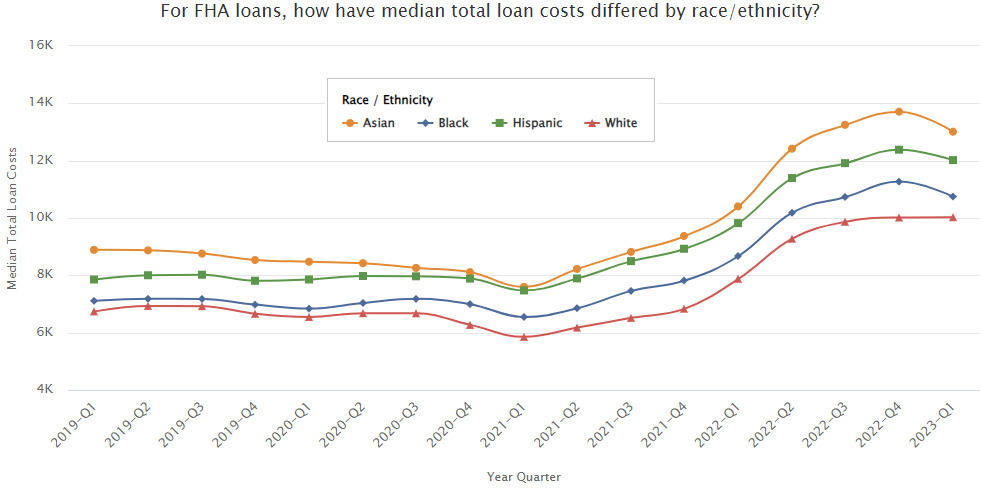
The following graph shows how the median loan origination costs have changed quarterly by loan type.
Almost nobody knows where mortgage rates will go in the future as the economy is inherently unpredictible. Black swans like the COVID-19 crisis are not easy to predict, though even more normal market conditions can be hard to predict. Many predictions are nothing more than a linear projection of the recent past onto the future.
The Federal Reserve raised rates 4 times in 2018 at their meetings in March, June, September and December. On October 3, 2018 Federal Reserve Chairman Jerome Powell stated the central bank was "a long way" from neutral, hinting many more rate hikes would be coming.
With that trend and guidance in place, many mortgage industry veterans predicted mortgage rate would rise in 2019. Rates actually fell as the Federal Reserve delivered no more rate hikes and instead began loosening monetary policy.
| Organization | Analyst | Rate prediction |
|---|---|---|
| Freddie Mac | Actual PMMS 30-Year Rates | 3.94% |
| Mortgage Banker's Association | Mike Fratantoni | 5.1% |
| Fannie Mae | Doug Duncan | 4.8% |
| Freddie Mac | Sam Khater | 5.1% |
| Realtor.com | Danielle Hale | 5.3% |
| Moody's Analytics | Mark Zandi | 5.0% |
| Wells Fargo | Sam Bullard | 4.9% |
| Carrington Mortgage | Rick Sharga | 5.25% |
| CoreLogic | Frank Nothaft | 5.25% |
| National Association of Home Builders | 4.81% | |
| Zillow | 5.8% |
Table sources: MBA, Fannie Mae, Freddie Mac, NAR, NAHB, CoreLogic
The NAHB saw 30-year fixed rates rising to 5.08% in 2020, when they anticipated ARMs to jump from 2019 estimates of 4.46% to 4.63%.
Despite being old data, the above predictions remain published on this page to show how significantly off major industry associations and leading experts at companies worth billions of dollars can be even in relatively benign environments. The average rate predicted for 2019 was 5.13% while the actual average rate throughout the year was 3.94%.
Industry experts can be that far off in relatively benign conditions. A true crisis can make accurate predictions nearly impossible.
As the COVID-19 healthcare crisis swept the globe governments pushed lockdowns which contracted many economies at record rates. In the second quarter of 2020 the United States economy contracted at a record annualized rate of 31.4%.
As the global economy crashed the Federal Reserve's FOMC cut interest rates twice, announced they would conduct unlimited quantitative easing, and gave forward guidance suggesting they were unlikely to lift rates through 2023.
As the Federal Reserve bought Treasury bonds and mortgage-backed securities while the economy cooled mortgage rates fell to new record lows. On the week of November 5th, the average 30-year fixed-rate fell to 2.78%. 2020 was a record year for mortgage originations with Fannie Mae predicting $4.1 trillion in originations and refinance loans contributing $2.7 to the total.
What Impact Did COVID-19 Have On US Home Prices?
In January 2020 the Case Shiller U.S National Home Price Index stood a 212.41. In July of 2023 it reached 310.16. The rate of change over 3.5 years amounts to 9.958% appreciation per year. From 1963 to 2019 the median house (of constant size) increased at a rate of 4.32% annually.
In the 2 years following the pandemic owner occupied housing added $9 trillion in wealth. Nearly half the price increase in 2020 was due to the stay-at-home demand phenomenon. Roughly 1/3 of the increase was due to lower interest rates, and most of the remainder was due to government stimulus.
Some areas appreciated faster than other areas. The following chart from the NAR analyzes FHFA data, showing that in most states the prices of homes increased 30% to 50% in the 3 years following the onset of the COVID-19 emergency policies.
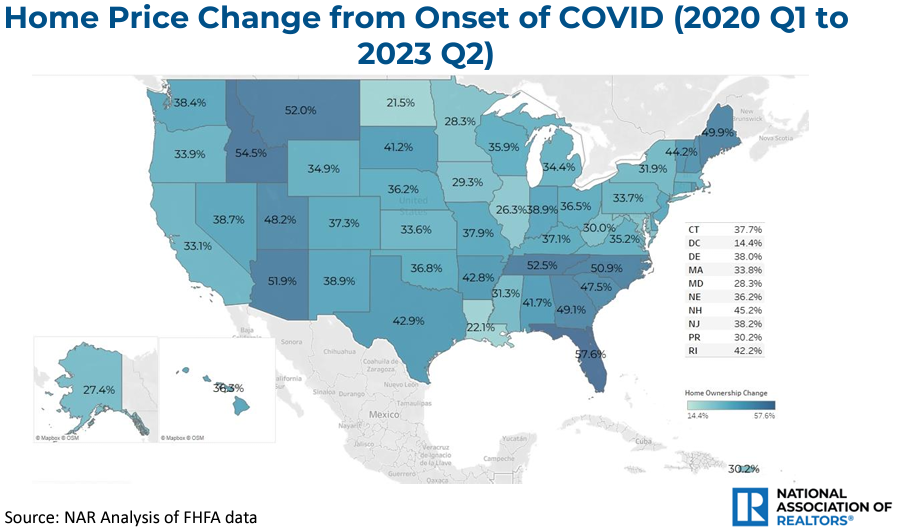
Home price appreciation not only impacts the value of the homes & the equity homeowners have in them, but it also impacts other costs of ownership including property taxes and homeowners insurance. Homeowners have record home equity, but many are stuck in place as most mortgages in the United States are not assumable, and it is hard to sell a property with a 3% or 4% fixed mortgage rate and then go out and buy a similar home elsewhere while paying a 7% or 8% mortgage rate.

On a quarterly basis, here is a prediction of mortgage rates for 2024.
| Source | Q1 2024 | Q2 2024 | Q3 2024 | Q4 2024 |
|---|---|---|---|---|
| Mortgage Bankers Association | 6.8% | 6.6% | 6.3% | 6.1% |
| Fannie Mae | 7.1% | 7.0% | 6.9% | 6.7% |
| National Association of Realtors | 6.1% | 6.0% | 6.0% | 6.0% |
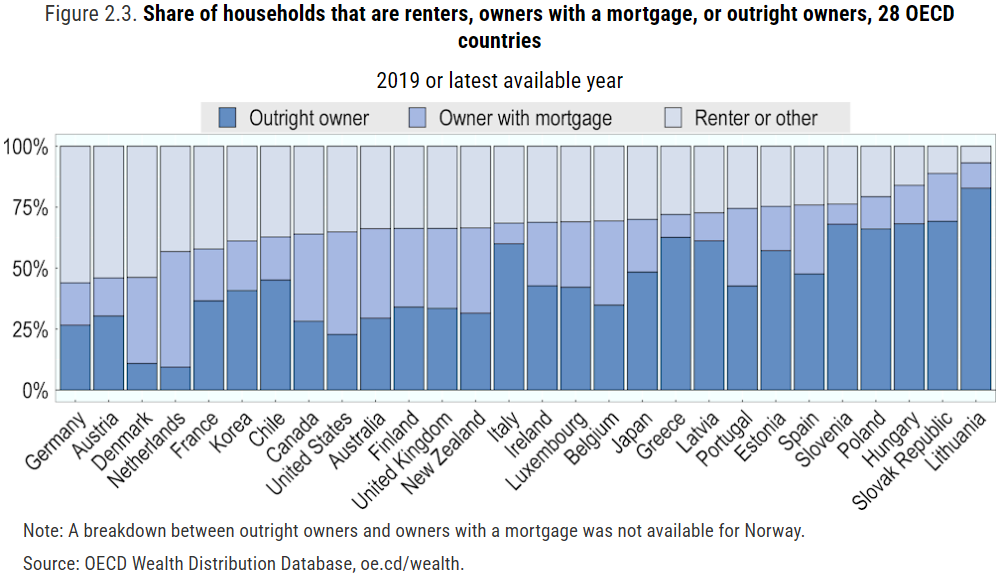
The OECD compared homeownership rates across 28 different countries in 2019. Among the 28 countries the United States ranked 26th in outright ownership and 20th in overall ownership including debt. In 2019 22.78% of United States households owned their home free-and-clear, while another 42.07% of the populous owned their home while holding mortgage debt against the properties, for a blended overall homeownership rate of 64.85%. Lithuania scored best in both categories, with 82.77% of homeowners owning free-and-clear and an additional 10.38% owing mortgage debt on their homes, for an overall homeownership rate of 93.15%.
| Country | Year | Outright Owner | Own Rank | Owner w Mortgage | Own + Mort | Own + Mort Rank | Renter / Other |
|---|---|---|---|---|---|---|---|
| Australia | 2018 | 29.47% | 23 | 36.72% | 66.19% | 19 | 33.81% |
| Austria | 2017 | 30.35% | 22 | 15.59% | 45.94% | 27 | 54.06% |
| Belgium | 2017 | 34.83% | 18 | 34.51% | 69.34% | 12 | 30.66% |
| Canada | 2019 | 28.20% | 24 | 35.75% | 63.95% | 21 | 36.05% |
| Chile | 2017 | 45.10% | 12 | 17.67% | 62.77% | 22 | 37.23% |
| Denmark | 2019 | 10.91% | 27 | 35.29% | 46.20% | 26 | 53.80% |
| Estonia | 2017 | 57.17% | 9 | 18.13% | 75.30% | 7 | 24.70% |
| Finland | 2016 | 34.02% | 19 | 32.25% | 66.27% | 18 | 33.73% |
| France | 2017 | 36.57% | 17 | 21.28% | 57.85% | 24 | 42.15% |
| Germany | 2017 | 26.61% | 25 | 17.34% | 43.95% | 28 | 56.05% |
| Greece | 2018 | 62.63% | 6 | 9.37% | 72.00% | 10 | 28.00% |
| Hungary | 2017 | 68.18% | 3 | 15.79% | 83.97% | 3 | 16.03% |
| Ireland | 2018 | 42.72% | 13 | 26.06% | 68.78% | 14 | 31.22% |
| Italy | 2016 | 60.01% | 8 | 8.45% | 68.46% | 15 | 31.55% |
| Japan | 2019 | 48.37% | 10 | 21.60% | 69.97% | 11 | 30.03% |
| Korea | 2019 | 40.77% | 16 | 20.40% | 61.17% | 23 | 38.83% |
| Latvia | 2017 | 61.18% | 7 | 11.49% | 72.67% | 9 | 27.32% |
| Lithuania | 2016 | 82.77% | 1 | 10.38% | 93.15% | 1 | 6.84% |
| Luxembourg | 2018 | 42.17% | 15 | 26.83% | 69.00% | 13 | 31.00% |
| Netherlands | 2019 | 9.41% | 28 | 47.38% | 56.79% | 25 | 43.21% |
| New Zealand | 2018 | 31.53% | 21 | 34.96% | 66.49% | 16 | 33.51% |
| Poland | 2016 | 66.05% | 5 | 13.26% | 79.31% | 4 | 20.70% |
| Portugal | 2017 | 42.66% | 14 | 31.83% | 74.49% | 8 | 25.51% |
| Slovak Republic | 2017 | 69.20% | 2 | 19.62% | 88.82% | 2 | 11.18% |
| Slovenia | 2017 | 68.03% | 4 | 8.23% | 76.26% | 5 | 23.74% |
| Spain | 2018 | 47.59% | 11 | 28.30% | 75.89% | 6 | 24.12% |
| United Kingdom | 2017 | 33.48% | 20 | 32.80% | 66.28% | 17 | 33.72% |
| United States | 2019 | 22.78% | 26 | 42.07% | 64.85% | 20 | 35.15% |
Source: OECD (2022), Housing Taxation in OECD Countries, OECD Tax Policy Studies, No. 29, OECD Publishing, Paris.
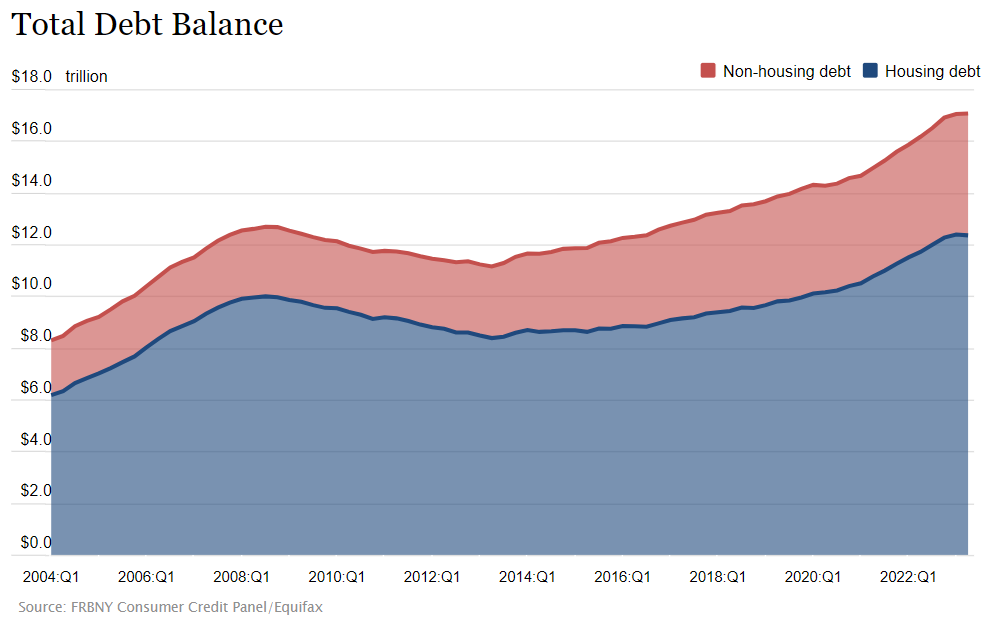
At the end of the second quarter of 2019 there were $13.86 trillion Dollars in outstanding household debt across the United States. Housing debt totaled $9.81 trillion, or 70.78% of the total. By the end of the second quarter of 2023 household debt reached $17.06 trillion. Housing debt totaled $12.35 trillion, or 72.39% of the total.
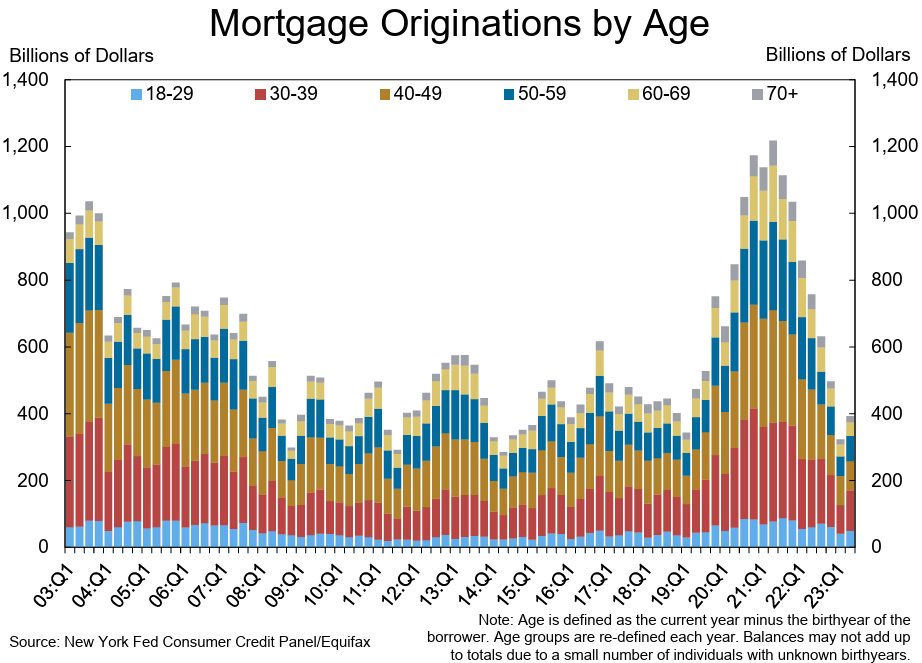
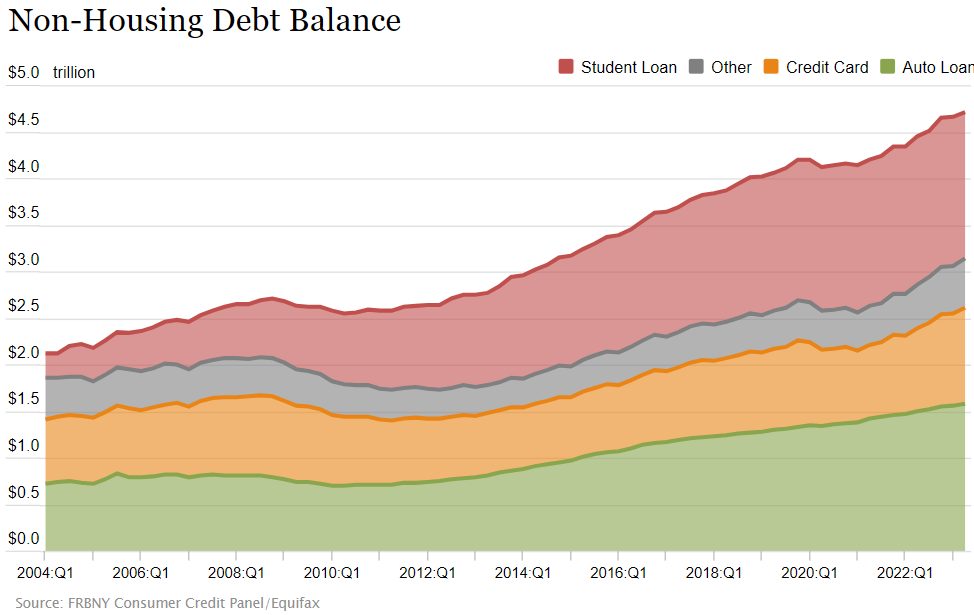
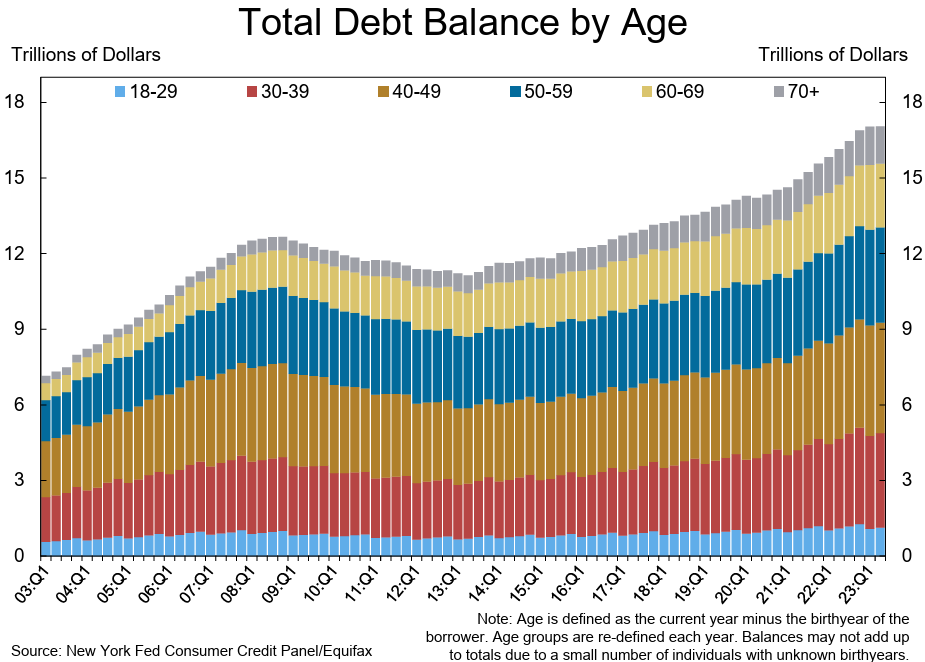
Most mortgage debt is originated by people in the 30 to 49 year old age group.
The following graph further breaks down the non-household debt composition.
The next graph highlights debt balance composition by age cohort.
According to HMDA, first mortgages represented 85.44% of originated home loans & 95.05% of all new mortgage debt originated in 2018. Secondary mortgages represented 14.56% of new loans & 4.95% of new mortgage debt.
| Loan Type | Lien Type | # of Records | % of loans | $ Amount | $ % |
|---|---|---|---|---|---|
| Conventional | First | 4,963,197 | 75.26% of first | 1,524,366,245,000 | 80.5% of first |
| FHA | First | 970,901 | 14.72% of first | 206,447,255,000 | 10.9% of first |
| USDA | First | 103,808 | 1.57% of first | 15,177,360,000 | 0.8% of first |
| VA | First | 556,414 | 8.44% of first | 147,733,570,000 | 7.8% of first |
| Total | First | 6,594,320 | 85.44% of total | 1,893,724,430,000 | 95.05% of total |
| Conventional | Second | 1,119,755 | 99.67% of second | 98,428,855,000 | 4.95% of second |
| FHA | Second | 3,468 | 0.31% of second | 165,760,000 | 0.17% of second |
| USDA | Second | 42 | 0% of second | 2,520,000 | 0% of second |
| VA | Second | 200 | 0.02% of second | 15,350,000 | 0.02% of second |
| Total | Second | 1,123,465 | 14.56% of total | 98,612,485,000 | 4.95% of total |
| Total | First & Second | 7,717,785 | 1,992,336,915,000 |
In 2022 conventional mortgages still dominated the market in terms of volume and dollar amount.
| Loan Type | # of Records | # % | $ Amount | $ % |
|---|---|---|---|---|
| Conventional | 6,917,131 | 82.40% | 2,393,440,925,000 | 84.29% |
| FHA | 861,740 | 10.27% | 237,654,580,000 | 8.37% |
| VA | 558,745 | 6.66% | 198,299,085,000 | 6.98% |
| USDA | 56,662 | 0.68% | 10,175,080,000 | 0.36% |
| Total | 8,394,278 | 2,839,569,670,000 |
The HMDA also breaks down the 2022 originated mortgages by purpose.
| Originated Loans | # of Loans | # % | $ Loan Amount | $ % |
|---|---|---|---|---|
| Home Purchase | 4,366,283 | 52.01% | 1,721,735,925,000 | 60.63% |
| Home Improvement | 782,649 | 9.32% | 98,385,435,000 | 3.46% |
| Refinancing | 1,082,136 | 12.89% | 407,474,440,000 | 14.35% |
| Cash Out Refinancing | 1,547,728 | 18.44% | 478,630,970,000 | 16.86% |
| Other Purpose | 613,131 | 7.30% | 111,360,395,000 | 3.92% |
| Not Applicable | 2,351 | 0.03% | 21,982,505,000 | 0.77% |
| Total | 8,394,278 | 2,839,569,670,000 |
The following data from the Federal Reserve shows how mortgage debt has grown over time.
Since 1945 through Q2 of 2033 mortgage debt has grown at an annual rate of 8.584% in nominal terms.
In recent years total mortgage debt has been growing at a rate of roughly 3.5% to 3.7% annually. The biggest pullback from the 2008 to 2009 global recession was in Q4 of 2010 with mortgage debt falling by 4.21%.
All numbers are in millions of United States Dollars at the end of the associated time period.
| Date | Total | YoY △ | % △ | 1-4 Family | Multifamily | Commercial | Farm |
|---|---|---|---|---|---|---|---|
| 1945 | $35,853 | $18,706 | $4,922 | $7,465 | $4,760 | ||
| 1946 | $42,032 | $6,179 | 17.234% | $23,100 | $5,270 | $8,765 | $4,897 |
| 1947 | $49,198 | $7,166 | 17.049% | $28,267 | $5,787 | $10,080 | $5,064 |
| 1948 | $56,568 | $7,370 | 14.980% | $33,422 | $6,662 | $11,196 | $5,288 |
| 1949 | $62,679 | $6,111 | 10.803% | $37,406 | $7,829 | $11,865 | $5,579 |
| 1950 | $73,108 | $10,429 | 16.639% | $45,250 | $9,301 | $12,486 | $6,071 |
| 1951 | $82,573 | $9,465 | 12.947% | $51,792 | $10,642 | $13,488 | $6,651 |
| 1952:Q1 | $84,413 | $53,066 | $10,820 | $13,713 | $6,814 | ||
| 1952:Q2 | $86,783 | $54,798 | $11,037 | $13,927 | $7,021 | ||
| 1952:Q3 | $89,210 | $56,640 | $11,275 | $14,161 | $7,134 | ||
| 1952:Q4 | $91,530 | $8,957 | 10.847% | $58,416 | $11,481 | $14,397 | $7,236 |
| 1953:Q1 | $93,649 | $9,236 | 10.941% | $60,006 | $11,587 | $14,660 | $7,396 |
| 1953:Q2 | $96,517 | $9,734 | 11.216% | $62,225 | $11,766 | $14,939 | $7,587 |
| 1953:Q3 | $99,018 | $9,808 | 10.994% | $64,205 | $11,934 | $15,212 | $7,667 |
| 1953:Q4 | $101,360 | $9,830 | 10.740% | $65,938 | $12,121 | $15,564 | $7,737 |
| 1954:Q1 | $103,321 | $9,672 | 10.328% | $67,351 | $12,174 | $15,880 | $7,916 |
| 1954:Q2 | $106,366 | $9,849 | 10.204% | $69,614 | $12,312 | $16,324 | $8,116 |
| 1954:Q3 | $109,757 | $10,739 | 10.846% | $72,336 | $12,452 | $16,782 | $8,187 |
| 1954:Q4 | $113,580 | $12,220 | 12.056% | $75,356 | $12,665 | $17,313 | $8,246 |
| 1955:Q1 | $117,256 | $13,935 | 13.487% | $78,237 | $12,782 | $17,765 | $8,472 |
| 1955:Q2 | $121,656 | $15,290 | 14.375% | $81,697 | $12,989 | $18,263 | $8,707 |
| 1955:Q3 | $125,896 | $16,139 | 14.704% | $85,032 | $13,179 | $18,819 | $8,866 |
| 1955:Q4 | $129,823 | $16,243 | 14.301% | $87,936 | $13,490 | $19,375 | $9,022 |
| 1956:Q1 | $133,258 | $16,002 | 13.647% | $90,356 | $13,657 | $19,954 | $9,291 |
| 1956:Q2 | $137,325 | $15,669 | 12.880% | $93,327 | $13,827 | $20,582 | $9,589 |
| 1956:Q3 | $141,104 | $15,208 | 12.080% | $96,174 | $13,972 | $21,199 | $9,759 |
| 1956:Q4 | $144,447 | $14,624 | 11.265% | $98,745 | $14,064 | $21,803 | $9,835 |
| 1957:Q1 | $147,290 | $14,032 | 10.530% | $100,851 | $14,085 | $22,321 | $10,033 |
| 1957:Q2 | $150,246 | $12,921 | 9.409% | $103,039 | $14,182 | $22,794 | $10,231 |
| 1957:Q3 | $153,602 | $12,498 | 8.857% | $105,397 | $14,379 | $23,478 | $10,348 |
| 1957:Q4 | $156,641 | $12,194 | 8.442% | $107,374 | $14,611 | $24,259 | $10,397 |
| 1958:Q1 | $159,336 | $12,046 | 8.178% | $108,975 | $15,025 | $24,812 | $10,524 |
| 1958:Q2 | $162,909 | $12,663 | 8.428% | $111,142 | $15,517 | $25,496 | $10,754 |
| 1958:Q3 | $167,216 | $13,614 | 8.863% | $114,035 | $16,020 | $26,204 | $10,957 |
| 1958:Q4 | $172,073 | $15,432 | 9.852% | $117,177 | $16,565 | $27,222 | $11,109 |
| 1959:Q1 | $176,185 | $16,849 | 10.575% | $119,935 | $17,132 | $27,761 | $11,357 |
| 1959:Q2 | $181,322 | $18,413 | 11.303% | $123,346 | $17,679 | $28,553 | $11,744 |
| 1959:Q3 | $186,450 | $19,234 | 11.502% | $127,007 | $18,212 | $29,283 | $11,948 |
| 1959:Q4 | $191,128 | $19,055 | 11.074% | $130,099 | $18,700 | $30,228 | $12,101 |
| 1960:Q1 | $194,949 | $18,764 | 10.650% | $132,580 | $19,199 | $30,899 | $12,271 |
| 1960:Q2 | $199,295 | $17,973 | 9.912% | $135,366 | $19,702 | $31,668 | $12,559 |
| 1960:Q3 | $204,103 | $17,653 | 9.468% | $138,582 | $20,293 | $32,531 | $12,697 |
| 1960:Q4 | $208,409 | $17,281 | 9.042% | $141,378 | $20,786 | $33,407 | $12,838 |
| 1961:Q1 | $212,253 | $17,304 | 8.876% | $143,645 | $21,424 | $34,121 | $13,063 |
| 1961:Q2 | $217,156 | $17,861 | 8.962% | $146,603 | $21,943 | $35,173 | $13,437 |
| 1961:Q3 | $222,791 | $18,688 | 9.156% | $150,179 | $22,790 | $36,085 | $13,737 |
| 1961:Q4 | $228,969 | $20,560 | 9.865% | $154,027 | $23,622 | $37,403 | $13,917 |
| 1962:Q1 | $233,302 | $21,049 | 9.917% | $156,488 | $24,218 | $38,374 | $14,222 |
| 1962:Q2 | $239,432 | $22,276 | 10.258% | $160,237 | $24,937 | $39,584 | $14,674 |
| 1962:Q3 | $245,791 | $23,000 | 10.324% | $164,345 | $25,769 | $40,733 | $14,944 |
| 1962:Q4 | $252,438 | $23,469 | 10.250% | $168,307 | $26,732 | $42,206 | $15,193 |
| 1963:Q1 | $257,443 | $24,141 | 10.348% | $171,352 | $27,382 | $43,148 | $15,561 |
| 1963:Q2 | $264,646 | $25,214 | 10.531% | $175,801 | $28,202 | $44,492 | $16,151 |
| 1963:Q3 | $272,064 | $26,273 | 10.689% | $180,662 | $28,994 | $45,835 | $16,573 |
| 1963:Q4 | $279,256 | $26,818 | 10.624% | $185,106 | $30,024 | $47,304 | $16,822 |
| 1964:Q1 | $284,877 | $27,434 | 10.656% | $188,776 | $30,936 | $47,831 | $17,334 |
| 1964:Q2 | $292,203 | $27,557 | 10.413% | $193,368 | $32,095 | $48,672 | $18,068 |
| 1964:Q3 | $299,773 | $27,709 | 10.185% | $198,076 | $33,313 | $49,848 | $18,536 |
| 1964:Q4 | $307,034 | $27,778 | 9.947% | $202,335 | $34,578 | $51,179 | $18,942 |
| 1965:Q1 | $312,731 | $27,854 | 9.778% | $205,891 | $35,384 | $51,982 | $19,474 |
| 1965:Q2 | $320,010 | $27,807 | 9.516% | $210,329 | $36,300 | $53,197 | $20,184 |
| 1965:Q3 | $327,395 | $27,622 | 9.214% | $215,042 | $37,243 | $54,413 | $20,697 |
| 1965:Q4 | $334,510 | $27,476 | 8.949% | $219,449 | $38,213 | $55,661 | $21,187 |
| 1966:Q1 | $341,259 | $28,528 | 9.122% | $223,358 | $39,187 | $57,017 | $21,697 |
| 1966:Q2 | $348,424 | $28,414 | 8.879% | $227,232 | $40,075 | $58,796 | $22,321 |
| 1966:Q3 | $354,072 | $26,677 | 8.148% | $230,272 | $40,708 | $60,317 | $22,775 |
| 1966:Q4 | $358,537 | $24,027 | 7.183% | $232,742 | $41,275 | $61,468 | $23,052 |
| 1967:Q1 | $361,862 | $20,603 | 6.037% | $234,221 | $41,968 | $62,233 | $23,440 |
| 1967:Q2 | $367,447 | $19,023 | 5.460% | $237,076 | $42,801 | $63,577 | $23,993 |
| 1967:Q3 | $374,765 | $20,693 | 5.844% | $241,547 | $43,748 | $64,924 | $24,546 |
| 1967:Q4 | $382,055 | $23,518 | 6.559% | $245,974 | $44,815 | $66,249 | $25,017 |
| 1968:Q1 | $388,021 | $26,159 | 7.229% | $249,378 | $45,477 | $67,543 | $25,623 |
| 1968:Q2 | $395,418 | $27,971 | 7.612% | $253,675 | $46,242 | $69,114 | $26,387 |
| 1968:Q3 | $403,087 | $28,322 | 7.557% | $258,183 | $47,141 | $70,927 | $26,836 |
| 1968:Q4 | $411,381 | $29,326 | 7.676% | $262,934 | $48,251 | $73,019 | $27,177 |
| 1969:Q1 | $416,067 | $28,046 | 7.228% | $264,857 | $49,196 | $74,367 | $27,647 |
| 1969:Q2 | $424,224 | $28,806 | 7.285% | $269,738 | $50,352 | $75,792 | $28,342 |
| 1969:Q3 | $432,047 | $28,960 | 7.185% | $274,512 | $51,512 | $77,271 | $28,752 |
| 1969:Q4 | $439,911 | $28,530 | 6.935% | $278,689 | $53,176 | $79,051 | $28,995 |
| 1970:Q1 | $442,980 | $26,913 | 6.468% | $280,971 | $53,467 | $78,950 | $29,592 |
| 1970:Q2 | $450,595 | $26,371 | 6.216% | $284,366 | $55,054 | $81,253 | $29,922 |
| 1970:Q3 | $460,315 | $28,268 | 6.543% | $288,349 | $57,668 | $84,057 | $30,241 |
| 1970:Q4 | $469,364 | $29,453 | 6.695% | $292,240 | $60,129 | $86,503 | $30,492 |
| 1971:Q1 | $477,184 | $34,204 | 7.721% | $296,349 | $62,312 | $87,700 | $30,823 |
| 1971:Q2 | $490,134 | $39,539 | 8.775% | $303,206 | $65,052 | $90,090 | $31,786 |
| 1971:Q3 | $504,220 | $43,905 | 9.538% | $311,379 | $67,399 | $93,327 | $32,115 |
| 1971:Q4 | $517,869 | $48,505 | 10.334% | $318,411 | $70,094 | $96,983 | $32,381 |
| 1972:Q1 | $531,563 | $54,379 | 11.396% | $325,753 | $72,680 | $100,034 | $33,096 |
| 1972:Q2 | $550,187 | $60,053 | 12.252% | $335,726 | $76,046 | $104,306 | $34,109 |
| 1972:Q3 | $569,366 | $65,146 | 12.920% | $347,347 | $78,834 | $108,330 | $34,855 |
| 1972:Q4 | $589,786 | $71,917 | 13.887% | $357,381 | $82,876 | $114,168 | $35,361 |
| 1973:Q1 | $605,291 | $73,728 | 13.870% | $365,955 | $84,593 | $118,253 | $36,490 |
| 1973:Q2 | $627,950 | $77,763 | 14.134% | $378,024 | $87,957 | $124,008 | $37,961 |
| 1973:Q3 | $649,008 | $79,642 | 13.988% | $389,894 | $91,127 | $129,035 | $38,952 |
| 1973:Q4 | $666,543 | $76,757 | 13.014% | $399,840 | $93,191 | $133,706 | $39,806 |
| 1974:Q1 | $681,413 | $76,122 | 12.576% | $407,909 | $95,355 | $137,455 | $40,694 |
| 1974:Q2 | $700,754 | $72,804 | 11.594% | $418,838 | $97,221 | $142,377 | $42,318 |
| 1974:Q3 | $716,574 | $67,566 | 10.411% | $428,859 | $98,933 | $145,045 | $43,737 |
| 1974:Q4 | $728,426 | $61,883 | 9.284% | $435,176 | $100,049 | $148,279 | $44,922 |
| 1975:Q1 | $737,733 | $56,320 | 8.265% | $439,951 | $100,586 | $150,411 | $46,785 |
| 1975:Q2 | $753,522 | $52,768 | 7.530% | $450,826 | $100,735 | $153,431 | $48,530 |
| 1975:Q3 | $769,738 | $53,164 | 7.419% | $462,776 | $100,820 | $157,058 | $49,084 |
| 1975:Q4 | $785,568 | $57,142 | 7.845% | $474,003 | $100,693 | $161,019 | $49,853 |
| 1976:Q1 | $802,392 | $64,659 | 8.765% | $486,205 | $102,169 | $163,221 | $50,797 |
| 1976:Q2 | $823,307 | $69,785 | 9.261% | $501,045 | $103,607 | $166,345 | $52,310 |
| 1976:Q3 | $847,760 | $78,022 | 10.136% | $518,784 | $104,909 | $170,146 | $53,921 |
| 1976:Q4 | $870,518 | $84,950 | 10.814% | $535,022 | $105,895 | $174,189 | $55,412 |
| 1977:Q1 | $892,257 | $89,865 | 11.200% | $550,282 | $107,142 | $177,453 | $57,380 |
| 1977:Q2 | $926,270 | $102,963 | 12.506% | $575,838 | $109,746 | $180,348 | $60,338 |
| 1977:Q3 | $963,193 | $115,433 | 13.616% | $603,197 | $111,835 | $185,795 | $62,366 |
| 1977:Q4 | $999,213 | $128,695 | 14.784% | $627,724 | $114,279 | $193,261 | $63,949 |
| 1978:Q1 | $1,026,813 | $134,556 | 15.080% | $646,079 | $116,827 | $197,958 | $65,949 |
| 1978:Q2 | $1,066,897 | $140,627 | 15.182% | $674,540 | $120,272 | $203,343 | $68,742 |
| 1978:Q3 | $1,109,961 | $146,768 | 15.238% | $707,359 | $122,681 | $208,876 | $71,045 |
| 1978:Q4 | $1,150,674 | $151,461 | 15.158% | $738,254 | $125,152 | $214,511 | $72,757 |
| 1979:Q1 | $1,186,117 | $159,304 | 15.514% | $762,873 | $127,635 | $219,175 | $76,434 |
| 1979:Q2 | $1,231,418 | $164,521 | 15.421% | $794,869 | $129,903 | $225,711 | $80,935 |
| 1979:Q3 | $1,278,932 | $168,971 | 15.223% | $828,850 | $132,396 | $233,353 | $84,333 |
| 1979:Q4 | $1,317,030 | $166,356 | 14.457% | $855,779 | $135,048 | $239,448 | $86,755 |
| 1980:Q1 | $1,357,614 | $171,497 | 14.459% | $886,093 | $137,027 | $243,912 | $90,582 |
| 1980:Q2 | $1,383,696 | $152,278 | 12.366% | $902,289 | $138,408 | $248,864 | $94,135 |
| 1980:Q3 | $1,421,427 | $142,495 | 11.142% | $931,530 | $140,218 | $253,808 | $95,871 |
| 1980:Q4 | $1,457,828 | $140,798 | 10.691% | $957,912 | $142,526 | $259,903 | $97,487 |
| 1981:Q1 | $1,484,685 | $127,071 | 9.360% | $973,129 | $143,948 | $267,511 | $100,097 |
| 1981:Q2 | $1,523,566 | $139,870 | 10.108% | $996,937 | $144,952 | $278,496 | $103,181 |
| 1981:Q3 | $1,555,141 | $133,714 | 9.407% | $1,014,571 | $146,039 | $288,922 | $105,609 |
| 1981:Q4 | $1,579,504 | $121,676 | 8.346% | $1,030,213 | $142,377 | $299,685 | $107,229 |
| 1982:Q1 | $1,600,795 | $116,110 | 7.821% | $1,041,585 | $143,640 | $306,619 | $108,951 |
| 1982:Q2 | $1,625,667 | $102,101 | 6.701% | $1,055,044 | $144,694 | $315,647 | $110,282 |
| 1982:Q3 | $1,635,406 | $80,265 | 5.161% | $1,055,314 | $144,215 | $324,780 | $111,097 |
| 1982:Q4 | $1,661,290 | $81,786 | 5.178% | $1,070,187 | $146,112 | $333,680 | $111,311 |
| 1983:Q1 | $1,692,029 | $91,234 | 5.699% | $1,087,139 | $147,020 | $346,330 | $111,540 |
| 1983:Q2 | $1,739,644 | $113,977 | 7.011% | $1,116,296 | $150,761 | $360,215 | $112,372 |
| 1983:Q3 | $1,796,351 | $160,945 | 9.841% | $1,153,484 | $155,784 | $373,975 | $113,108 |
| 1983:Q4 | $1,850,645 | $189,355 | 11.398% | $1,186,271 | $161,229 | $389,424 | $113,721 |
| 1984:Q1 | $1,904,844 | $212,815 | 12.578% | $1,216,062 | $167,158 | $408,654 | $112,970 |
| 1984:Q2 | $1,972,432 | $232,788 | 13.381% | $1,254,448 | $174,957 | $429,688 | $113,339 |
| 1984:Q3 | $2,034,727 | $238,376 | 13.270% | $1,289,107 | $180,374 | $451,779 | $113,467 |
| 1984:Q4 | $2,091,991 | $241,346 | 13.041% | $1,321,526 | $186,145 | $471,898 | $112,422 |
| 1985:Q1 | $2,168,248 | $263,404 | 13.828% | $1,385,660 | $182,816 | $487,050 | $112,722 |
| 1985:Q2 | $2,234,883 | $262,451 | 13.306% | $1,428,061 | $189,290 | $505,953 | $111,579 |
| 1985:Q3 | $2,303,008 | $268,281 | 13.185% | $1,477,181 | $194,964 | $522,126 | $108,737 |
| 1985:Q4 | $2,368,542 | $276,551 | 13.220% | $1,526,876 | $205,915 | $541,661 | $94,090 |
| 1986:Q1 | $2,416,495 | $248,247 | 11.449% | $1,557,666 | $212,974 | $554,231 | $91,624 |
| 1986:Q2 | $2,492,143 | $257,260 | 11.511% | $1,616,328 | $220,862 | $565,823 | $89,130 |
| 1986:Q3 | $2,578,098 | $275,090 | 11.945% | $1,683,521 | $228,838 | $579,130 | $86,609 |
| 1986:Q4 | $2,655,581 | $287,039 | 12.119% | $1,730,129 | $239,394 | $601,970 | $84,088 |
| 1987:Q1 | $2,737,635 | $321,140 | 13.289% | $1,770,490 | $245,492 | $639,606 | $82,047 |
| 1987:Q2 | $2,829,845 | $337,702 | 13.551% | $1,843,953 | $250,241 | $655,668 | $79,983 |
| 1987:Q3 | $2,899,473 | $321,375 | 12.466% | $1,898,660 | $254,693 | $668,224 | $77,896 |
| 1987:Q4 | $2,957,964 | $302,383 | 11.387% | $1,928,861 | $258,744 | $694,549 | $75,810 |
| 1988:Q1 | $3,027,489 | $289,854 | 10.588% | $1,975,292 | $268,754 | $708,871 | $74,572 |
| 1988:Q2 | $3,116,342 | $286,497 | 10.124% | $2,045,358 | $266,426 | $731,225 | $73,333 |
| 1988:Q3 | $3,190,355 | $290,882 | 10.032% | $2,106,338 | $269,771 | $742,165 | $72,081 |
| 1988:Q4 | $3,277,078 | $319,114 | 10.788% | $2,163,251 | $275,085 | $767,913 | $70,829 |
| 1989:Q1 | $3,332,288 | $304,799 | 10.068% | $2,197,391 | $280,374 | $784,203 | $70,320 |
| 1989:Q2 | $3,402,085 | $285,743 | 9.169% | $2,255,840 | $285,544 | $790,897 | $69,804 |
| 1989:Q3 | $3,478,229 | $287,874 | 9.023% | $2,322,096 | $286,378 | $800,472 | $69,283 |
| 1989:Q4 | $3,528,977 | $251,899 | 7.687% | $2,370,024 | $287,571 | $802,621 | $68,761 |
| 1990:Q1 | $3,623,288 | $291,000 | 8.733% | $2,450,635 | $291,160 | $813,010 | $68,483 |
| 1990:Q2 | $3,687,991 | $285,906 | 8.404% | $2,517,657 | $285,196 | $816,936 | $68,202 |
| 1990:Q3 | $3,743,933 | $265,704 | 7.639% | $2,567,754 | $287,536 | $820,726 | $67,917 |
| 1990:Q4 | $3,785,715 | $256,738 | 7.275% | $2,607,360 | $288,098 | $822,624 | $67,633 |
| 1991:Q1 | $3,829,584 | $206,296 | 5.694% | $2,642,099 | $289,653 | $830,244 | $67,588 |
| 1991:Q2 | $3,894,145 | $206,154 | 5.590% | $2,701,076 | $290,916 | $834,611 | $67,542 |
| 1991:Q3 | $3,896,975 | $153,042 | 4.088% | $2,723,333 | $283,382 | $822,764 | $67,496 |
| 1991:Q4 | $3,937,254 | $151,539 | 4.003% | $2,775,229 | $284,847 | $809,728 | $67,450 |
| 1992:Q1 | $3,967,677 | $138,093 | 3.606% | $2,814,898 | $284,670 | $800,552 | $67,557 |
| 1992:Q2 | $3,989,669 | $95,524 | 2.453% | $2,846,334 | $280,821 | $794,851 | $67,663 |
| 1992:Q3 | $4,027,823 | $130,848 | 3.358% | $2,899,642 | $277,326 | $783,084 | $67,771 |
| 1992:Q4 | $4,047,322 | $110,068 | 2.796% | $2,942,618 | $271,664 | $765,161 | $67,879 |
| 1993:Q1 | $4,048,279 | $80,602 | 2.031% | $2,952,698 | $269,565 | $758,000 | $68,016 |
| 1993:Q2 | $4,090,751 | $101,082 | 2.534% | $3,006,984 | $266,733 | $748,880 | $68,154 |
| 1993:Q3 | $4,136,200 | $108,377 | 2.691% | $3,059,398 | $265,452 | $743,057 | $68,293 |
| 1993:Q4 | $4,177,719 | $130,397 | 3.222% | $3,101,618 | $268,532 | $739,136 | $68,433 |
| 1994:Q1 | $4,200,782 | $152,503 | 3.767% | $3,133,137 | $268,405 | $730,443 | $68,797 |
| 1994:Q2 | $4,249,492 | $158,741 | 3.880% | $3,180,691 | $269,593 | $730,042 | $69,166 |
| 1994:Q3 | $4,300,478 | $164,278 | 3.972% | $3,231,432 | $269,472 | $730,035 | $69,539 |
| 1994:Q4 | $4,342,268 | $164,549 | 3.939% | $3,279,108 | $269,282 | $723,966 | $69,912 |
| 1995:Q1 | $4,375,146 | $174,364 | 4.151% | $3,307,244 | $268,251 | $729,293 | $70,358 |
| 1995:Q2 | $4,430,192 | $180,700 | 4.252% | $3,357,165 | $270,503 | $731,714 | $70,810 |
| 1995:Q3 | $4,491,364 | $190,886 | 4.439% | $3,413,968 | $271,677 | $734,453 | $71,266 |
| 1995:Q4 | $4,528,785 | $186,517 | 4.295% | $3,446,997 | $275,296 | $734,769 | $71,723 |
| 1996:Q1 | $4,599,965 | $224,819 | 5.139% | $3,509,533 | $276,167 | $741,871 | $72,394 |
| 1996:Q2 | $4,672,846 | $242,654 | 5.477% | $3,569,098 | $279,414 | $751,269 | $73,065 |
| 1996:Q3 | $4,741,067 | $249,703 | 5.560% | $3,633,992 | $281,819 | $751,512 | $73,744 |
| 1996:Q4 | $4,808,938 | $280,153 | 6.186% | $3,683,264 | $287,628 | $763,624 | $74,422 |
| 1997:Q1 | $4,862,729 | $262,764 | 5.712% | $3,721,435 | $289,522 | $776,341 | $75,431 |
| 1997:Q2 | $4,938,946 | $266,100 | 5.695% | $3,775,714 | $293,633 | $793,148 | $76,451 |
| 1997:Q3 | $5,051,258 | $310,191 | 6.543% | $3,867,990 | $295,929 | $809,857 | $77,482 |
| 1997:Q4 | $5,121,238 | $312,300 | 6.494% | $3,909,675 | $301,406 | $831,643 | $78,514 |
| 1998:Q1 | $5,210,527 | $347,798 | 7.152% | $3,978,064 | $308,055 | $844,763 | $79,645 |
| 1998:Q2 | $5,328,748 | $389,802 | 7.892% | $4,068,420 | $315,474 | $864,066 | $80,788 |
| 1998:Q3 | $5,451,828 | $400,570 | 7.930% | $4,159,820 | $324,062 | $886,002 | $81,944 |
| 1998:Q4 | $5,609,352 | $488,114 | 9.531% | $4,266,987 | $337,503 | $921,762 | $83,100 |
| 1999:Q1 | $5,734,727 | $524,200 | 10.060% | $4,356,768 | $347,273 | $946,573 | $84,113 |
| 1999:Q2 | $5,873,760 | $545,012 | 10.228% | $4,464,844 | $353,850 | $969,930 | $85,136 |
| 1999:Q3 | $6,074,895 | $623,067 | 11.429% | $4,596,401 | $364,573 | $1,027,750 | $86,171 |
| 1999:Q4 | $6,216,198 | $606,846 | 10.818% | $4,690,967 | $378,520 | $1,059,505 | $87,206 |
| 2000:Q1 | $6,320,022 | $585,295 | 10.206% | $4,761,885 | $385,354 | $1,086,194 | $86,589 |
| 2000:Q2 | $6,482,084 | $608,324 | 10.357% | $4,885,589 | $393,879 | $1,116,644 | $85,972 |
| 2000:Q3 | $6,632,609 | $557,714 | 9.181% | $5,009,339 | $399,275 | $1,138,647 | $85,348 |
| 2000:Q4 | $6,772,855 | $556,657 | 8.955% | $5,113,414 | $408,088 | $1,166,629 | $84,724 |
| 2001:Q1 | $6,856,668 | $536,646 | 8.491% | $5,210,083 | $412,909 | $1,148,011 | $85,665 |
| 2001:Q2 | $7,063,242 | $581,158 | 8.966% | $5,381,711 | $424,334 | $1,170,580 | $86,617 |
| 2001:Q3 | $7,270,293 | $637,684 | 9.614% | $5,540,603 | $433,847 | $1,208,264 | $87,579 |
| 2001:Q4 | $7,456,108 | $683,253 | 10.088% | $5,664,880 | $450,045 | $1,252,642 | $88,541 |
| 2002:Q1 | $7,625,812 | $769,144 | 11.217% | $5,811,881 | $456,375 | $1,267,318 | $90,238 |
| 2002:Q2 | $7,853,481 | $790,239 | 11.188% | $5,999,286 | $466,817 | $1,295,424 | $91,954 |
| 2002:Q3 | $8,098,902 | $828,609 | 11.397% | $6,207,940 | $473,989 | $1,323,285 | $93,688 |
| 2002:Q4 | $8,364,913 | $908,805 | 12.189% | $6,419,560 | $490,694 | $1,359,236 | $95,423 |
| 2003:Q1 | $8,562,912 | $937,100 | 12.289% | $6,587,145 | $501,335 | $1,382,026 | $92,406 |
| 2003:Q2 | $8,858,931 | $1,005,450 | 12.803% | $6,832,053 | $521,553 | $1,415,970 | $89,355 |
| 2003:Q3 | $9,138,575 | $1,039,673 | 12.837% | $7,059,689 | $540,143 | $1,452,472 | $86,271 |
| 2003:Q4 | $9,369,407 | $1,004,494 | 12.008% | $7,241,064 | $564,969 | $1,480,187 | $83,187 |
| 2004:Q1 | $9,631,943 | $1,069,031 | 12.484% | $7,445,131 | $575,182 | $1,525,344 | $86,286 |
| 2004:Q2 | $9,985,771 | $1,126,840 | 12.720% | $7,738,588 | $592,785 | $1,565,012 | $89,386 |
| 2004:Q3 | $10,307,843 | $1,169,268 | 12.795% | $7,998,610 | $604,299 | $1,612,415 | $92,519 |
| 2004:Q4 | $10,657,641 | $1,288,234 | 13.749% | $8,273,492 | $617,673 | $1,670,823 | $95,653 |
| 2005:Q1 | $10,948,924 | $1,316,981 | 13.673% | $8,516,556 | $626,802 | $1,707,665 | $97,901 |
| 2005:Q2 | $11,335,164 | $1,349,393 | 13.513% | $8,821,636 | $641,966 | $1,771,389 | $100,173 |
| 2005:Q3 | $11,713,985 | $1,406,142 | 13.641% | $9,130,560 | $652,217 | $1,828,737 | $102,471 |
| 2005:Q4 | $12,091,992 | $1,434,351 | 13.458% | $9,410,975 | $670,735 | $1,905,514 | $104,768 |
| 2006:Q1 | $12,503,771 | $1,554,847 | 14.201% | $9,740,178 | $684,322 | $1,973,694 | $105,577 |
| 2006:Q2 | $12,904,133 | $1,568,969 | 13.842% | $10,068,934 | $692,204 | $2,036,600 | $106,395 |
| 2006:Q3 | $13,242,460 | $1,528,475 | 13.048% | $10,325,457 | $700,546 | $2,109,236 | $107,221 |
| 2006:Q4 | $13,504,255 | $1,412,263 | 11.679% | $10,489,862 | $713,985 | $2,192,360 | $108,048 |
| 2007:Q1 | $13,777,812 | $1,274,041 | 10.189% | $10,703,696 | $729,354 | $2,235,571 | $109,191 |
| 2007:Q2 | $14,082,407 | $1,178,274 | 9.131% | $10,912,564 | $746,219 | $2,313,278 | $110,346 |
| 2007:Q3 | $14,375,948 | $1,133,488 | 8.559% | $11,097,176 | $768,126 | $2,399,132 | $111,514 |
| 2007:Q4 | $14,580,431 | $1,076,176 | 7.969% | $11,204,451 | $804,637 | $2,458,661 | $112,682 |
| 2008:Q1 | $14,717,831 | $940,019 | 6.823% | $11,276,445 | $819,820 | $2,503,418 | $118,148 |
| 2008:Q2 | $14,754,083 | $671,676 | 4.770% | $11,251,527 | $834,895 | $2,544,047 | $123,614 |
| 2008:Q3 | $14,743,930 | $367,982 | 2.560% | $11,209,813 | $848,052 | $2,556,924 | $129,141 |
| 2008:Q4 | $14,686,916 | $106,485 | 0.730% | $11,113,726 | $857,880 | $2,580,610 | $134,700 |
| 2009:Q1 | $14,689,490 | -$28,341 | -0.193% | $11,109,992 | $864,248 | $2,577,764 | $137,486 |
| 2009:Q2 | $14,634,640 | -$119,443 | -0.810% | $11,061,352 | $870,522 | $2,562,462 | $140,304 |
| 2009:Q3 | $14,537,629 | -$206,301 | -1.399% | $10,982,717 | $873,244 | $2,538,516 | $143,152 |
| 2009:Q4 | $14,448,644 | -$238,272 | -1.622% | $10,926,487 | $870,245 | $2,505,912 | $146,000 |
| 2010:Q1 | $14,293,448 | -$396,042 | -2.696% | $10,795,176 | $866,217 | $2,484,058 | $147,997 |
| 2010:Q2 | $14,186,176 | -$448,464 | -3.064% | $10,732,686 | $865,089 | $2,438,384 | $150,017 |
| 2010:Q3 | $14,076,790 | -$460,839 | -3.170% | $10,657,779 | $867,613 | $2,399,340 | $152,058 |
| 2010:Q4 | $13,896,512 | -$552,132 | -3.821% | $10,489,045 | $870,539 | $2,382,828 | $154,100 |
| 2011:Q1 | $13,811,867 | -$481,581 | -3.369% | $10,427,727 | $868,742 | $2,358,068 | $157,330 |
| 2011:Q2 | $13,720,142 | -$466,034 | -3.285% | $10,362,872 | $868,993 | $2,327,681 | $160,596 |
| 2011:Q3 | $13,641,720 | -$435,070 | -3.091% | $10,306,983 | $871,181 | $2,299,658 | $163,898 |
| 2011:Q4 | $13,580,530 | -$315,982 | -2.274% | $10,250,735 | $874,772 | $2,287,823 | $167,200 |
| 2012:Q1 | $13,502,737 | -$309,130 | -2.238% | $10,186,794 | $877,889 | $2,269,312 | $168,742 |
| 2012:Q2 | $13,429,049 | -$291,093 | -2.122% | $10,124,930 | $884,092 | $2,249,744 | $170,283 |
| 2012:Q3 | $13,375,563 | -$266,157 | -1.951% | $10,073,148 | $891,839 | $2,238,734 | $171,842 |
| 2012:Q4 | $13,347,159 | -$233,371 | -1.718% | $10,017,647 | $903,930 | $2,252,182 | $173,400 |
| 2013:Q1 | $13,298,869 | -$203,868 | -1.510% | $9,964,690 | $909,460 | $2,248,409 | $176,310 |
| 2013:Q2 | $13,299,766 | -$129,283 | -0.963% | $9,929,805 | $919,530 | $2,271,179 | $179,252 |
| 2013:Q3 | $13,341,503 | -$34,060 | -0.255% | $9,938,060 | $933,777 | $2,287,440 | $182,226 |
| 2013:Q4 | $13,342,459 | -$4,700 | -0.035% | $9,917,615 | $946,526 | $2,293,118 | $185,200 |
| 2014:Q1 | $13,329,835 | $30,966 | 0.233% | $9,878,894 | $958,230 | $2,304,651 | $188,060 |
| 2014:Q2 | $13,361,220 | $61,454 | 0.462% | $9,870,562 | $973,271 | $2,326,435 | $190,952 |
| 2014:Q3 | $13,417,351 | $75,848 | 0.569% | $9,882,692 | $991,126 | $2,349,657 | $193,876 |
| 2014:Q4 | $13,485,609 | $143,150 | 1.073% | $9,890,868 | $1,016,222 | $2,381,719 | $196,800 |
| 2015:Q1 | $13,502,471 | $172,636 | 1.295% | $9,858,887 | $1,037,542 | $2,406,283 | $199,759 |
| 2015:Q2 | $13,616,026 | $254,806 | 1.907% | $9,903,198 | $1,064,546 | $2,445,531 | $202,751 |
| 2015:Q3 | $13,722,772 | $305,421 | 2.276% | $9,953,171 | $1,084,711 | $2,479,115 | $205,775 |
| 2015:Q4 | $13,869,244 | $383,635 | 2.845% | $10,019,313 | $1,121,505 | $2,519,626 | $208,800 |
| 2016:Q1 | $13,924,517 | $422,046 | 3.126% | $10,025,097 | $1,147,822 | $2,538,521 | $213,077 |
| 2016:Q2 | $14,035,440 | $419,414 | 3.080% | $10,079,832 | $1,173,584 | $2,564,671 | $217,353 |
| 2016:Q3 | $14,190,940 | $468,168 | 3.412% | $10,155,377 | $1,204,525 | $2,609,361 | $221,677 |
| 2016:Q4 | $14,314,452 | $445,208 | 3.210% | $10,211,952 | $1,237,859 | $2,638,641 | $226,000 |
| 2017:Q1 | $14,413,346 | $488,829 | 3.511% | $10,268,509 | $1,263,195 | $2,653,127 | $228,515 |
| 2017:Q2 | $14,561,469 | $526,029 | 3.748% | $10,345,688 | $1,290,096 | $2,694,627 | $231,058 |
| 2017:Q3 | $14,702,804 | $511,864 | 3.607% | $10,438,226 | $1,317,216 | $2,713,733 | $233,629 |
| 2017:Q4 | $14,886,168 | $571,716 | 3.994% | $10,519,478 | $1,363,968 | $2,766,522 | $236,200 |
| 2018:Q1 | $14,985,744 | $572,398 | 3.971% | $10,562,697 | $1,390,957 | $2,793,523 | $238,567 |
| 2018:Q2 | $15,152,626 | $591,157 | 4.060% | $10,647,421 | $1,419,165 | $2,845,079 | $240,961 |
| 2018:Q3 | $15,299,264 | $596,460 | 4.057% | $10,747,127 | $1,455,229 | $2,853,528 | $243,380 |
| 2018:Q4 | $15,443,532 | $557,364 | 3.744% | $10,814,951 | $1,492,819 | $2,889,962 | $245,800 |
| 2019:Q1 | $15,536,227 | $550,483 | 3.673% | $10,844,026 | $1,518,847 | $2,922,105 | $251,249 |
| 2019:Q2 | $15,680,945 | $528,319 | 3.487% | $10,930,020 | $1,548,175 | $2,945,991 | $256,759 |
| 2019:Q3 | $15,876,937 | $577,673 | 3.776% | $11,024,144 | $1,595,900 | $2,994,563 | $262,330 |
| 2019:Q4 | $16,029,700 | $586,168 | 3.796% | $11,095,414 | $1,635,103 | $3,031,283 | $267,900 |
| 2020:Q1 | $16,173,374 | $637,147 | 4.101% | $11,162,253 | $1,662,707 | $3,075,367 | $273,047 |
| 2020:Q2 | $16,330,384 | $649,439 | 4.142% | $11,249,912 | $1,700,186 | $3,102,093 | $278,193 |
| 2020:Q3 | $16,568,458 | $691,521 | 4.356% | $11,419,970 | $1,735,651 | $3,129,440 | $283,397 |
| 2020:Q4 | $16,817,065 | $787,365 | 4.912% | $11,571,759 | $1,787,612 | $3,169,094 | $288,600 |
| 2021:Q1 | $17,000,303 | $826,929 | 5.113% | $11,697,173 | $1,817,270 | $3,188,433 | $297,427 |
| 2021:Q2 | $17,566,274 | $1,235,890 | 7.568% | $12,176,666 | $1,855,392 | $3,227,863 | $306,353 |
| 2021:Q3 | $17,901,158 | $1,332,700 | 8.044% | $12,420,033 | $1,886,378 | $3,279,371 | $315,376 |
| 2021:Q4 | $18,316,173 | $1,499,108 | 8.914% | $12,675,062 | $1,938,444 | $3,378,267 | $324,400 |
| 2022:Q1 | $18,672,653 | $1,672,350 | 9.837% | $12,923,374 | $1,980,659 | $3,441,754 | $326,866 |
| 2022:Q2 | $19,094,483 | $1,528,209 | 8.700% | $13,203,812 | $2,025,927 | $3,535,385 | $329,359 |
| 2022:Q3 | $19,415,037 | $1,513,879 | 8.457% | $13,427,896 | $2,065,991 | $3,589,271 | $331,879 |
| 2022:Q4 | $19,673,725 | $1,357,552 | 7.412% | $13,587,914 | $2,107,168 | $3,644,243 | $334,400 |
| 2023:Q1 | $19,814,368 | $1,141,715 | 6.114% | $13,650,332 | $2,135,500 | $3,691,547 | $336,989 |
| 2023:Q2 | $19,968,692 | $874,209 | 4.578% | $13,750,758 | $2,159,423 | $3,718,904 | $339,607 |
| 2023:Q3 | $20,149,157 | $734,120 | 3.781% | $13,875,395 | $2,183,290 | $3,748,219 | $342,253 |
| 2023:Q4 | $20,291,101 | $617,376 | 3.138% | $13,970,512 | $2,202,789 | $3,772,900 | $344,900 |
| 2024:Q1 | $20,387,381 | $573,013 | 2.892% | $14,016,347 | $2,227,027 | $3,793,538 | $350,469 |
| 2024:Q2 | $20,530,512 | $561,820 | 2.814% | $14,128,249 | $2,245,681 | $3,800,543 | $356,039 |
| 2024:Q3 | $20,706,592 | $557,435 | 2.767% | $14,243,603 | $2,270,258 | $3,831,062 | $361,669 |
| 2024:Q4 | $20,868,343 | $577,242 | 2.845% | $14,359,200 | $2,305,365 | $3,836,478 | $367,300 |
| 2025:Q1 | $20,962,792 | $575,411 | 2.822% | $14,407,989 | $2,327,843 | $3,854,950 | $372,010 |
| 2025:Q2 | $21,145,928 | $615,416 | 2.998% | $14,523,193 | $2,355,769 | $3,890,194 | $376,772 |
| 2025:Q3 | $21,351,614 | $645,022 | 3.115% | $14,638,823 | $2,396,104 | $3,935,101 | $381,586 |
As the Federal Reserve lifted interest rates to offset stimulus economic policies by the Trump administration (including the 2017 TCJA) many home owners shifted away from cash out refinancing toward using home equity lines of credit. The COVID-19 crisis caused interest rates to crater with mortgage rates reaching fresh all-time lows. This in turn caused 2020 to be a record year for home loan origination volume, with roughly $2.7 trillion of $4.1 trillion in mortgage volume being refinance loans. 2021 then went on to beat 2020.
Median incomes have not kept pace with home price increases, which has slowed the pace of home purchases.
Through the first 9 months of 2018 home builders were one of the weakest performing categories across the domestic stock market, which has offset a massive 76% total return they achieved in 2017. Home builders rebounded strongly in 2019 & were one of the strongest categories after the COVID-19 crisis. While the mortgage market has been weak in the face of higher interest rates this provides an advantage to new home builders, which can use mortgage rate buydown offers to maintain the sale prices on their homes while giving home buyers lower interest rates either for an introductory period or for the duration of the loan.
| Borrower details | 2004 | 2005 | 2006 | 2007 | 2008 | 2009 | 2010 | 2011 | 2012 | 2013 | 2014 | 2015 | 2016 | 2017 |
|---|---|---|---|---|---|---|---|---|---|---|---|---|---|---|
| Asian | 4.8% | 5.0% | 4.5% | 4.5% | 4.9% | 5.3% | 5.5% | 5.2% | 5.3% | 5.7% | 5.4% | 5.3% | 5.5% | 5.8% |
| African American | 7.1% | 7.7% | 8.7% | 7.6% | 6.3% | 5.7% | 6.0% | 5.5% | 5.1% | 4.8% | 5.2% | 5.5% | 6.0% | 6.4% |
| Hispanic white | 7.6% | 10.5% | 11.7% | 9.0% | 7.9% | 8.0% | 8.1% | 8.3% | 7.7% | 7.3% | 7.9% | 8.3% | 8.8% | 8.8% |
| Non-Hispanic white | 57.1% | 61.7% | 61.2% | 65.4% | 67.5% | 67.9% | 67.6% | 68.7% | 70.0% | 70.2% | 69.1% | 68.1% | 66.4% | 64.9% |
| Other minority | 1.4% | 1.3% | 1.1% | 1.0% | 0.9% | 0.9% | 0.9% | 0.8% | 0.8% | 0.7% | 0.8% | 0.8% | 0.8% | 0.9% |
| Joint | 2.3% | 2.3% | 2.3% | 2.5% | 2.8% | 2.8% | 2.7% | 2.8% | 2.9% | 3.1% | 3.4% | 3.5% | 3.6% | 3.7% |
| Missing | 19.8% | 11.5% | 10.5% | 10.1% | 9.6% | 9.3% | 9.1% | 8.6% | 8.2% | 8.2% | 8.3% | 8.5% | 8.9% | 9.6% |
| Low or moderate income | 27.7% | 24.6% | 23.6% | 24.6% | 28.0% | 36.6% | 35.4% | 34.4% | 33.3% | 28.5% | 27.0% | 27.9% | 26.2% | 26.3% |
| Middle income | 26.9% | 25.7% | 24.7% | 25.1% | 27.0% | 26.6% | 25.6% | 25.2% | 25.1% | 25.2% | 25.6% | 26.1% | 26.4% | 26.7% |
| High income | 41.4% | 45.5% | 46.7% | 46.9% | 42.9% | 34.6% | 37.3% | 38.8% | 40.0% | 44.7% | 46.1% | 44.9% | 46.4% | 46.0% |
| Income not used or N/A | 4.0% | 4.2% | 5.0% | 3.4% | 2.1% | 2.2% | 1.7% | 1.6% | 1.5% | 1.6% | 1.3% | 1.1% | 1.0% | 1.0% |
| Low or moderate income neighborhood | 14.5% | 15.1% | 15.7% | 14.4% | 13.2% | 12.6% | 12.1% | 11.0% | 12.8% | 12.7% | 13.3% | 13.5% | 14.1% | 16.1% |
| Middle income neighborhood | 48.7% | 49.2% | 49.5% | 49.6% | 49.8% | 50.2% | 49.5% | 49.4% | 43.6% | 43.7% | 44.6% | 45.2% | 45.8% | 44.2% |
| High income neighborhood | 35.8% | 34.7% | 33.7% | 35.1% | 35.9% | 35.8% | 37.7% | 39.1% | 43.2% | 43.2% | 41.8% | 41.0% | 40.0% | 39.6% |
| Home Purchase loans (thousands) | 3,331 | 2,533 | 2,391 | 2,157 | 2,018 | 2,284 | 2,638 | 2,747 | 3,134 | 3,463 | 3,594 |
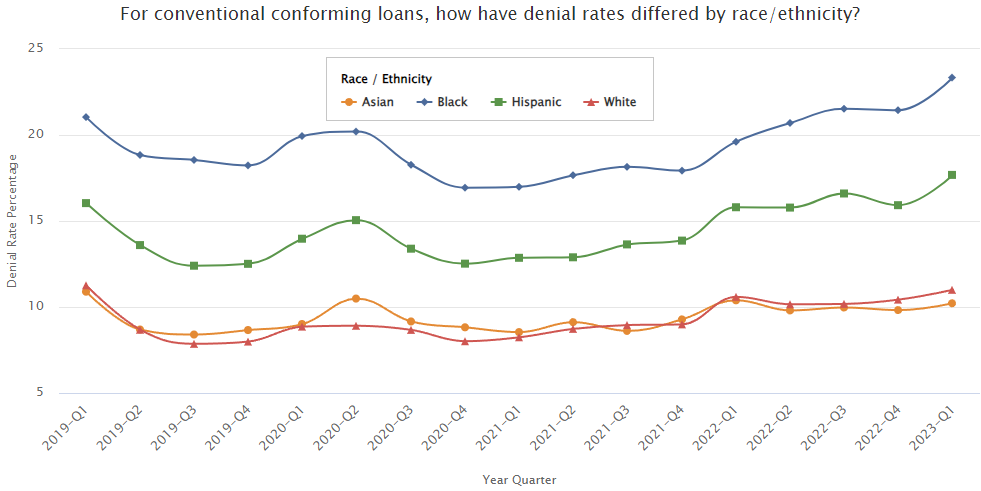
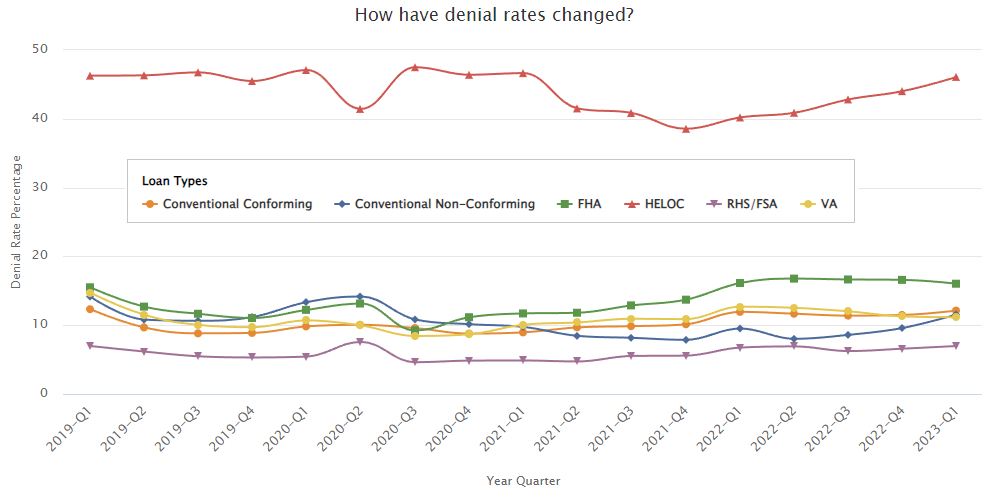
Most mortgage applications are approved. Only second mortgages have a denial rate above 20%.
The following table shows current mortgage rates in your local market.
Here are historical average annual interest rates for popular home loan products.
| Year | 30-YR FRM Rate | 30-YR Points | 15-YR FRM Rate | 15-YR Points | 1-YR ARM Rate | 1-YR Points | 1-YR Margin | 5/1-YR ARM Rate | 5/1-YR Points | 5/1-YR Margin |
|---|---|---|---|---|---|---|---|---|---|---|
| 2024 | 6.72 | 5.97 | ||||||||
| 2023 | 6.81 | 6.11 | ||||||||
| 2022 | 5.34 | 0.81 | 4.58 | 0.84 | 4.09 | 0.29 | 2.75 | |||
| 2021 | 2.96 | 0.68 | 2.27 | 0.64 | 2.61 | 0.29 | 2.75 | |||
| 2020 | 3.10 | 0.73 | 2.59 | 0.69 | 3.07 | 0.30 | 2.75 | |||
| 2019 | 3.94 | 0.5 | 3.39 | 0.5 | 3.57 | 0.4 | 2.75 | |||
| 2018 | 4.54 | 0.5 | 4.00 | 0.5 | 3.82 | 0.3 | 2.76 | |||
| 2017 | 3.99 | 0.5 | 3.27 | 0.5 | 3.20 | 0.4 | 2.74 | |||
| 2016 | 3.65 | 0.5 | 2.93 | 0.5 | 2.87 | 0.5 | 2.74 | |||
| 2015 | 3.85 | 0.6 | 3.09 | 0.6 | 2.53 | 0.3 | 2.74 | 2.94 | 0.5 | 2.74 |
| 2014 | 4.17 | 0.6 | 3.29 | 0.6 | 2.44 | 0.4 | 2.73 | 3.02 | 0.5 | 2.74 |
| 2013 | 3.98 | 0.7 | 3.11 | 0.7 | 2.62 | 0.4 | 2.76 | 2.88 | 0.5 | 2.75 |
| 2012 | 3.66 | 0.7 | 2.93 | 0.7 | 2.69 | 0.5 | 2.76 | 2.78 | 0.6 | 2.74 |
| 2011 | 4.45 | 0.7 | 3.68 | 0.7 | 3.03 | 0.6 | 2.76 | 3.31 | 0.6 | 2.74 |
| 2010 | 4.69 | 0.7 | 4.1 | 0.7 | 3.78 | 0.6 | 2.76 | 3.82 | 0.6 | 2.74 |
| 2009 | 5.04 | 0.7 | 4.57 | 0.7 | 4.7 | 0.6 | 2.75 | 4.75 | 0.6 | 2.74 |
| 2008 | 6.03 | 0.6 | 5.62 | 0.6 | 5.17 | 0.6 | 2.74 | 5.74 | 0.6 | 2.75 |
| 2007 | 6.34 | 0.4 | 6.03 | 0.4 | 5.56 | 0.6 | 2.75 | 6.07 | 0.5 | 2.76 |
| 2006 | 6.41 | 0.5 | 6.07 | 0.5 | 5.54 | 0.7 | 2.76 | 6.08 | 0.6 | 2.77 |
| 2005 | 5.87 | 0.6 | 5.42 | 0.6 | 4.49 | 0.7 | 2.77 | 5.32 | 0.6 | 2.78 |
| 2004 | 5.84 | 0.7 | 5.21 | 0.6 | 3.9 | 0.7 | 2.77 | |||
| 2003 | 5.83 | 0.6 | 5.17 | 0.6 | 3.76 | 0.6 | 2.76 | |||
| 2002 | 6.54 | 0.6 | 5.98 | 0.6 | 4.62 | 0.7 | 2.77 | |||
| 2001 | 6.97 | 0.9 | 6.5 | 0.9 | 5.82 | 0.9 | 2.77 | |||
| 2000 | 8.05 | 1 | 7.72 | 1 | 7.04 | 1 | 2.78 | |||
| 1999 | 7.44 | 1 | 7.06 | 1 | 5.99 | 1.1 | 2.79 | |||
| 1998 | 6.94 | 1.1 | 6.59 | 1.1 | 5.58 | 1.1 | 2.79 | |||
| 1997 | 7.6 | 1.7 | 7.13 | 1.7 | 5.61 | 1.4 | 2.79 | |||
| 1996 | 7.81 | 1.7 | 7.32 | 1.7 | 5.67 | 1.4 | 2.79 | |||
| 1995 | 7.93 | 1.8 | 7.48 | 1.8 | 6.06 | 1.5 | 2.8 | |||
| 1994 | 8.38 | 1.8 | 7.86 | 1.8 | 5.36 | 1.5 | 2.79 | |||
| 1993 | 7.31 | 1.6 | 6.83 | 1.6 | 4.58 | 1.5 | 2.77 | |||
| 1992 | 8.39 | 1.7 | 7.96 | 1.7 | 5.62 | 1.7 | 2.76 | |||
| 1991 | 9.25 | 2 | 7.09 | 1.9 | 2.77 | |||||
| 1990 | 10.13 | 2.1 | 8.36 | 2.1 | 2.77 | |||||
| 1989 | 10.32 | 2.1 | 8.8 | 2.3 | 2.77 | |||||
| 1988 | 10.34 | 2.1 | 7.9 | 2.3 | 2.75 | |||||
| 1987 | 10.21 | 2.2 | 7.83 | 2.2 | ||||||
| 1986 | 10.19 | 2.2 | 8.43 | 2.3 | ||||||
| 1985 | 12.43 | 2.5 | 10.05 | 2.5 | ||||||
| 1984 | 13.88 | 2.5 | 11.51 | 2.5 | ||||||
| 1983 | 13.24 | 2.1 | ||||||||
| 1982 | 16.04 | 2.2 | ||||||||
| 1981 | 16.63 | 2.1 | ||||||||
| 1980 | 13.74 | 1.8 | ||||||||
| 1979 | 11.2 | 1.6 | ||||||||
| 1978 | 9.64 | 1.3 | ||||||||
| 1977 | 8.85 | 1.1 | ||||||||
| 1976 | 8.87 | 1.1 | ||||||||
| 1975 | 9.05 | 1.1 | ||||||||
| 1974 | 9.19 | 1.2 | ||||||||
| 1973 | 8.04 | 1 | ||||||||
| 1972 | 7.38 | 0.9 |
Source: Freddie Mac PMMS
The following table lists purchase loans by type from the Home Mortgage Disclosure Act (HMDA). Conventional mortgages consist of the majority of the purchase market, with both FHA & VA loans being popular choices.
| Year | Conventional | Conventional % | FHA | FHA % | VA | VA % | FSA/RHS | Rural / Farm % | Total |
|---|---|---|---|---|---|---|---|---|---|
| 2015 | 1,950,245 | 60.95% | 809,236 | 25.29% | 324,769 | 10.15% | 115,395 | 3.61% | 3,199,645 |
| 2016 | 2,182,458 | 61.57% | 883,469 | 24.92% | 364,471 | 10.28% | 114,196 | 3.22% | 3,544,594 |
| 2017 | 2,357,454 | 63.95% | 830,638 | 22.53% | 379,554 | 10.30% | 118,870 | 3.22% | 3,686,516 |
Here is the same data series continued forward, with both quarterly and annual data.
| Year Quarter | Conventional Conforming | Conventional Non-Conforming | Conventional Total | Conventional % | FHA | FHA % | VA | VA % | RHS/FSA | Rural/Farm % | Total |
|---|---|---|---|---|---|---|---|---|---|---|---|
| 2018-Q1 | 161,031 | 18,945 | 179,976 | 65.90% | 49,140 | 17.99% | 39,319 | 14.40% | 4,674 | 1.71% | 273,109 |
| 2018-Q2 | 245,296 | 32,908 | 278,204 | 68.29% | 69,042 | 16.95% | 54,167 | 13.30% | 5,961 | 1.46% | 407,374 |
| 2018-Q3 | 243,118 | 30,252 | 273,370 | 68.32% | 67,199 | 16.79% | 53,142 | 13.28% | 6,430 | 1.61% | 400,141 |
| 2018-Q4 | 206,297 | 25,118 | 231,415 | 67.58% | 59,606 | 17.41% | 46,318 | 13.53% | 5,088 | 1.49% | 342,427 |
| 2018 Total | 855,742 | 107,223 | 962,965 | 67.67% | 244,987 | 17.22% | 192,946 | 13.56% | 22,153 | 1.56% | 1,423,051 |
| 2019-Q1 | 190,019 | 20,129 | 210,148 | 67.03% | 56,337 | 17.97% | 43,052 | 13.73% | 3,993 | 1.27% | 313,530 |
| 2019-Q2 | 284,136 | 35,394 | 319,530 | 67.92% | 80,749 | 17.16% | 63,226 | 13.44% | 6,973 | 1.48% | 470,478 |
| 2019-Q3 | 269,897 | 31,022 | 300,919 | 66.48% | 81,312 | 17.96% | 62,978 | 13.91% | 7,433 | 1.64% | 452,642 |
| 2019-Q4 | 223,738 | 26,134 | 249,872 | 64.52% | 74,777 | 19.31% | 55,730 | 14.39% | 6,913 | 1.78% | 387,292 |
| 2019 Total | 967,790 | 112,679 | 1,080,469 | 66.53% | 293,175 | 18.05% | 224,986 | 13.85% | 25,312 | 1.56% | 1,623,942 |
| 2020-Q1 | 209,630 | 21,154 | 230,784 | 63.83% | 71,064 | 19.66% | 52,795 | 14.60% | 6,905 | 1.91% | 361,548 |
| 2020-Q2 | 242,766 | 22,028 | 264,794 | 61.64% | 89,502 | 20.83% | 66,592 | 15.50% | 8,689 | 2.02% | 429,577 |
| 2020-Q3 | 318,934 | 28,896 | 347,830 | 65.75% | 98,814 | 18.68% | 72,348 | 13.68% | 10,029 | 1.90% | 529,021 |
| 2020-Q4 | 295,195 | 27,664 | 322,859 | 66.95% | 86,874 | 18.01% | 65,073 | 13.49% | 7,445 | 1.54% | 482,251 |
| 2020 Total | 1,066,525 | 99,742 | 1,166,267 | 64.71% | 346,254 | 19.21% | 256,808 | 14.25% | 33,068 | 1.83% | 1,802,397 |
| 2021-Q1 | 251,564 | 21,633 | 273,197 | 67.40% | 70,441 | 17.38% | 54,648 | 13.48% | 7,022 | 1.73% | 405,308 |
| 2021-Q2 | 344,000 | 39,208 | 383,208 | 69.76% | 88,744 | 16.16% | 70,292 | 12.80% | 7,078 | 1.29% | 549,322 |
| 2021-Q3 | 340,179 | 38,378 | 378,557 | 68.44% | 93,915 | 16.98% | 74,599 | 13.49% | 6,091 | 1.10% | 553,162 |
| 2021-Q4 | 291,593 | 38,879 | 330,472 | 67.34% | 84,447 | 17.21% | 70,685 | 14.40% | 5,154 | 1.05% | 490,758 |
| 2021 Total | 1,227,336 | 138,098 | 1,365,434 | 68.32% | 337,547 | 16.89% | 270,224 | 13.52% | 25,345 | 1.27% | 1,998,550 |
| 2022-Q1 | 255,999 | 22,188 | 278,187 | 67.53% | 66,350 | 16.11% | 63,475 | 15.41% | 3,944 | 0.96% | 411,956 |
| 2022-Q2 | 322,575 | 33,061 | 355,636 | 69.08% | 79,180 | 15.38% | 76,524 | 14.86% | 3,511 | 0.68% | 514,851 |
| 2022-Q3 | 301,323 | 23,637 | 324,960 | 66.60% | 84,167 | 17.25% | 75,006 | 15.37% | 3,812 | 0.78% | 487,945 |
| 2022-Q4 | 218,158 | 18,288 | 236,446 | 64.23% | 70,724 | 19.21% | 58,273 | 15.83% | 2,670 | 0.73% | 368,113 |
| 2022 Total | 1,098,055 | 97,174 | 1,195,229 | 67.04% | 300,421 | 16.85% | 273,278 | 15.33% | 13,937 | 0.78% | 1,782,865 |
| 2023-Q1 | 202,274 | 10,032 | 212,306 | 62.93% | 66,757 | 19.79% | 55,572 | 16.47% | 2,713 | 0.80% | 337,348 |
| 2023-Q2 | 263,914 | 16,057 | 279,971 | 63.77% | 88,286 | 20.11% | 67,883 | 15.46% | 2,914 | 0.66% | 439,054 |
| 2023-Q3 | 257,608 | 13,991 | 271,599 | 63.49% | 89,016 | 20.81% | 64,581 | 15.10% | 2,554 | 0.60% | 427,750 |
| 2023-Q4 | 206,455 | 11,624 | 218,079 | 62.20% | 79,548 | 22.69% | 50,985 | 14.54% | 2,014 | 0.57% | 350,626 |
| 2023 Total | 930,251 | 51,704 | 981,955 | 63.16% | 323,607 | 20.81% | 239,021 | 15.37% | 10,195 | 0.66% | 1,554,778 |
| 2024-Q1 | 191,146 | 13,781 | 204,927 | 61.17% | 75,033 | 22.40% | 52,762 | 15.75% | 2,288 | 0.68% | 335,010 |
The next table is similar to the above, but includes both refinance first liens and purchase first liens. Notice how the share of conventional loans overall is higher than in the above table, because most mortgage refinances are into conventional loans.
| Year | Conventional | Conventional % | FHA | FHA % | VA | VA % | FSA/RHS | Rural / Farm % | Total |
|---|---|---|---|---|---|---|---|---|---|
| 2018 | 4,972,421 | 75.26% | 973,571 | 14.37% | 557,309 | 8.43% | 103,909 | 1.57% | 6,607,210 |
| 2019 | 6,150,850 | 74.46% | 1,175,133 | 14.23% | 833,049 | 10.08% | 101,499 | 1.23% | 8,260,531 |
| 2020 | 10,859,412 | 78.85% | 1,372,649 | 9.97% | 1,403,700 | 10.19% | 136,447 | 0.99% | 13,772,208 |
| 2021 | 11,388,263 | 80.63% | 1,383,052 | 9.79% | 1,236,719 | 8.76% | 116,321 | 0.82% | 14,124,355 |
| 2022 | 5,476,970 | 78.78% | 860,860 | 12.38% | 558,718 | 8.04% | 55,533 | 0.80% | 6,952,081 |
The following table is only for refinance loans. It contains incomplete data for the FSA/RHS program, but it shows how much more popular conventional loans are for refinancing compared to the other loan programs, and how the other programs gained in popularity as rates rose making there little value in refinancing into a conventional loan.
| Year Quarter | Conventional Conforming | Conventional Non-Conforming | Total Conventional | Conventional % | FHA | FHA % | VA | VA % | RHS/FSA | Rural / Farm % | Total |
|---|---|---|---|---|---|---|---|---|---|---|---|
| 2018-Q1 | 233,263 | 12,187 | 245,450 | 74.46% | 45,736 | 13.87% | 38,038 | 11.54% | 421 | 0.13% | 329,645 |
| 2018-Q2 | 199,918 | 10,349 | 210,267 | 74.19% | 41,072 | 14.49% | 32,096 | 11.32% | 283,435 | ||
| 2018-Q3 | 190,558 | 9,809 | 200,367 | 72.06% | 43,742 | 15.73% | 33,938 | 12.21% | 278,047 | ||
| 2018-Q4 | 173,906 | 10,326 | 184,232 | 70.29% | 42,760 | 16.31% | 35,123 | 13.40% | 262,115 | ||
| 2018 Total | 797,645 | 42,671 | 840,316 | 72.89% | 173,310 | 15.03% | 139,195 | 12.07% | 1,152,821 | ||
| 2019-Q1 | 198,899 | 15,663 | 214,562 | 72.44% | 43,476 | 14.68% | 38,137 | 12.88% | 296,175 | ||
| 2019-Q2 | 277,612 | 25,967 | 303,579 | 74.22% | 55,410 | 13.55% | 50,020 | 12.23% | 409,009 | ||
| 2019-Q3 | 405,265 | 32,838 | 438,103 | 74.96% | 67,896 | 11.62% | 78,246 | 13.39% | 212 | 0.04% | 584,457 |
| 2019-Q4 | 491,952 | 36,631 | 528,583 | 74.08% | 78,613 | 11.02% | 105,878 | 14.84% | 493 | 0.07% | 713,567 |
| 2019 Total | 1,373,728 | 111,099 | 1,484,827 | 74.15% | 245,395 | 12.25% | 272,281 | 13.60% | 2,002,503 | ||
| 2020-Q1 | 591,775 | 35,853 | 627,628 | 77.47% | 73,132 | 9.03% | 108,799 | 13.43% | 596 | 0.07% | 810,155 |
| 2020-Q2 | 903,642 | 42,114 | 945,756 | 85.05% | 55,571 | 5.00% | 109,924 | 9.88% | 790 | 0.07% | 1,112,041 |
| 2020-Q3 | 1,039,050 | 31,481 | 1,070,531 | 86.64% | 47,842 | 3.87% | 116,465 | 9.43% | 828 | 0.07% | 1,235,666 |
| 2020-Q4 | 1,201,437 | 36,397 | 1,237,834 | 85.31% | 65,401 | 4.51% | 146,724 | 10.11% | 968 | 0.07% | 1,450,927 |
| 2020 Total | 3,735,904 | 145,845 | 3,881,749 | 84.22% | 241,946 | 5.25% | 481,912 | 10.46% | 3,182 | 0.07% | 4,608,789 |
| 2021-Q1 | 1,268,725 | 39,634 | 1,308,359 | 83.48% | 96,800 | 6.18% | 161,051 | 10.28% | 1,067 | 0.07% | 1,567,277 |
| 2021-Q2 | 999,280 | 36,789 | 1,036,069 | 83.76% | 84,540 | 6.83% | 115,683 | 9.35% | 720 | 0.06% | 1,237,012 |
| 2021-Q3 | 950,834 | 41,509 | 992,343 | 83.54% | 82,078 | 6.91% | 112,338 | 9.46% | 1,174 | 0.10% | 1,187,933 |
| 2021-Q4 | 847,598 | 44,423 | 892,021 | 82.77% | 77,880 | 7.23% | 106,675 | 9.90% | 1,188 | 0.11% | 1,077,764 |
| 2021 Total | 4,066,437 | 162,355 | 4,228,792 | 83.41% | 341,298 | 6.73% | 495,747 | 9.78% | 4,149 | 0.08% | 5,069,986 |
| 2022-Q1 | 619,393 | 18,007 | 637,400 | 80.76% | 68,885 | 8.73% | 82,269 | 10.42% | 664 | 0.08% | 789,218 |
| 2022-Q2 | 295,027 | 7,588 | 302,615 | 73.65% | 62,063 | 15.10% | 46,101 | 11.22% | 124 | 0.03% | 410,903 |
| 2022-Q3 | 157,379 | 3,310 | 160,689 | 63.02% | 59,200 | 23.22% | 35,076 | 13.76% | 254,965 | ||
| 2022-Q4 | 91,100 | 2,279 | 93,379 | 56.64% | 46,656 | 28.30% | 24,837 | 15.06% | 164,872 | ||
| 2022 Total | 1,162,899 | 31,184 | 1,194,083 | 73.75% | 236,804 | 14.63% | 188,283 | 11.63% | 1,619,170 | ||
| 2023-Q1 | 86,231 | 1,361 | 87,592 | 55.07% | 47,955 | 30.15% | 23,495 | 14.77% | 159,042 | ||
| 2023-Q2 | 82,864 | 1,287 | 84,151 | 52.22% | 52,272 | 32.44% | 24,734 | 15.35% | 161,157 | ||
| 2023-Q3 | 75,137 | 1,310 | 76,447 | 49.08% | 56,193 | 36.08% | 23,112 | 14.84% | 155,752 | ||
| 2023-Q4 | 65,167 | 1,579 | 66,746 | 49.99% | 46,403 | 34.76% | 20,360 | 15.25% | 133,509 | ||
| 2023 Total | 309,399 | 5,537 | 314,936 | 51.67% | 202,823 | 33.28% | 91,701 | 15.05% | 609,460 | ||
| 2024-Q1 | 73,224 | 2,439 | 75,663 | 47.20% | 52,242 | 32.59% | 32,383 | 20.20% | 160,288 |
The popularity of various loan options changes over time depending on broader credit conditions & the fees associated with various programs. The following 2 tables show the breakdown of nonconventional share based upon ethnicity & neighborhood information. The first table is for home purchases & the second table is for refinancing.
Home Purchases
| 2004 | 2005 | 2006 | 2007 | 2008 | 2009 | 2010 | 2011 | 2012 | 2013 | 2014 | 2015 | 2016 | 2017 | |
|---|---|---|---|---|---|---|---|---|---|---|---|---|---|---|
| Asian | 2.9% | 1.8% | 2.1% | 2.6% | 13.4% | 26.1% | 26.6% | 25.8% | 21.9% | 16.1% | 14.7% | 16.6% | 15.6% | 13.4% |
| African American | 21.7% | 14.3% | 13.6% | 21.7% | 64.1% | 82.0% | 82.9% | 80.3% | 77.2% | 70.8% | 68.0% | 70.2% | 68.5% | 64.9% |
| Hispanic white | 13.7% | 7.5% | 7.0% | 12.4% | 51.4% | 75.4% | 77.0% | 74.1% | 70.7% | 63.1% | 59.6% | 62.7% | 59.8% | 55.5% |
| Non-Hispanic white | 11.1% | 8.9% | 9.5% | 11.5% | 35.4% | 52.0% | 50.3% | 47.4% | 42.2% | 35.5% | 33.4% | 36.0% | 35.2% | 33.1% |
| Other minority | 14.0% | 9.3% | 9.4% | 14.8% | 48.4% | 67.6% | 68.8% | 65.9% | 62.2% | 55.5% | 54.0% | 55.3% | 54.2% | 52.1% |
| Joint | 16.9% | 12.8% | 14.4% | 17.2% | 46.4% | 59.4% | 56.3% | 53.6% | 48.9% | 42.1% | 41.3% | 43.8% | 43.1% | 40.8% |
| Missing race | 11.3% | 5.1% | 5.7% | 8.8% | 32.7% | 50.6% | 49.4% | 45.9% | 39.4% | 31.9% | 32.2% | 34.9% | 34.7% | 31.9% |
| Low or moderate income | 20.3% | 15.2% | 14.9% | 16.0% | 46.1% | 65.3% | 66.6% | 64.5% | 59.7% | 52.5% | 50.3% | 53.4% | 51.7% | 47.4% |
| Middle income | 14.3% | 11.0% | 12.6% | 16.7% | 46.1% | 60.4% | 59.3% | 57.0% | 51.5% | 45.6% | 44.8% | 47.7% | 47.6% | 45.0% |
| High income | 5.3% | 3.9% | 4.9% | 7.5% | 26.7% | 38.5% | 37.2% | 34.4% | 29.5% | 25.1% | 24.2% | 26.3% | 26.7% | 25.2% |
| Low or moderate income neighborhood | 15.8% | 9.7% | 9.6% | 13.8% | 45.4% | 64.3% | 65.0% | 61.2% | 57.9% | 49.9% | 48.1% | 50.4% | 48.8% | 46.2% |
| Middle income neighborhood | 14.1% | 10.2% | 10.8% | 14.2% | 42.7% | 59.8% | 59.4% | 56.9% | 52.1% | 44.7% | 43.1% | 45.6% | 44.6% | 41.7% |
| High income neighborhood | 7.1% | 5.4% | 6.1% | 7.6% | 27.4% | 43.4% | 42.0% | 39.5% | 34.6% | 28.2% | 26.1% | 29.0% | 28.4% | 26.2% |
| All borrowers | 11.9% | 8.5% | 9.0% | 11.8% | 37.6% | 54.4% | 53.4% | 50.5% | 45.2% | 38.2% | 36.6% | 39.4% | 38.7% | 36.3% |
Refinancing
| 2004 | 2005 | 2006 | 2007 | 2008 | 2009 | 2010 | 2011 | 2012 | 2013 | 2014 | 2015 | 2016 | 2017 | |
|---|---|---|---|---|---|---|---|---|---|---|---|---|---|---|
| Asian | 1.2% | 0.7% | 0.6% | 1.0% | 4.6% | 5.7% | 4.7% | 4.3% | 5.9% | 6.7% | 6.8% | 9.8% | 8.3% | 10.3% |
| African American | 11.1% | 5.8% | 4.4% | 10.2% | 39.2% | 53.8% | 42.0% | 37.8% | 38.6% | 37.1% | 39.1% | 49.4% | 53.0% | 47.4% |
| Hispanic white | 5.6% | 2.6% | 1.9% | 3.9% | 20.5% | 36.2% | 28.2% | 22.9% | 26.9% | 25.8% | 21.2% | 32.1% | 30.5% | 26.4% |
| Non-Hispanic white | 4.0% | 2.4% | 2.6% | 4.9% | 15.9% | 16.8% | 13.6% | 12.2% | 14.2% | 14.8% | 16.3% | 21.0% | 21.7% | 22.4% |
| Other minority | 5.5% | 3.4% | 2.4% | 4.9% | 20.0% | 28.3% | 23.3% | 21.9% | 25.5% | 24.9% | 25.0% | 32.6% | 36.7% | 34.0% |
| Joint | 7.5% | 3.7% | 3.4% | 6.2% | 19.5% | 21.1% | 16.6% | 16.3% | 20.1% | 20.5% | 25.5% | 28.0% | 29.3% | 29.5% |
| Missing race | 4.2% | 1.9% | 1.7% | 4.1% | 18.7% | 19.0% | 12.5% | 13.6% | 16.5% | 16.7% | 21.5% | 25.5% | 27.7% | 27.7% |
| Low or moderate income | 2.3% | 1.6% | 2.9% | 5.7% | 18.3% | 16.6% | 14.1% | 11.5% | 9.3% | 9.3% | 13.0% | 16.5% | 18.4% | 23.5% |
| Middle income | 1.7% | 1.3% | 2.7% | 6.2% | 19.6% | 13.2% | 12.3% | 10.9% | 8.9% | 9.5% | 13.2% | 14.8% | 15.3% | 21.3% |
| High income | 0.8% | 0.6% | 1.1% | 2.7% | 10.6% | 7.2% | 6.8% | 6.3% | 5.5% | 6.1% | 8.8% | 9.2% | 9.2% | 14.2% |
| Low or moderate income neighborhood | 5.9% | 3.2% | 2.9% | 6.3% | 24.6% | 31.2% | 23.1% | 19.7% | 22.2% | 22.1% | 22.4% | 29.5% | 30.4% | 30.4% |
| Middle income neighborhood | 5.2% | 3.0% | 2.9% | 5.8% | 20.2% | 22.3% | 17.5% | 16.1% | 18.4% | 19.0% | 20.9% | 26.8% | 28.2% | 27.8% |
| High income neighborhood | 2.9% | 1.7% | 1.6% | 3.0% | 11.3% | 12.1% | 10.0% | 9.3% | 11.7% | 12.4% | 14.5% | 18.5% | 19.0% | 19.4% |
| All borrowers | 4.6% | 2.6% | 2.5% | 5.0% | 17.6% | 18.7% | 14.4% | 13.3% | 15.6% | 16.4% | 18.4% | 23.5% | 24.3% | 24.9% |
The next table shows what percent of dollar value of the nonconventional market various government-backed loan programs have represented since 2004.
| Loan Type | FHA Purchase | VA Purchase | FSA/RHS Purchase | FHA Refi | VA Refi | FSA/RHS Refi |
|---|---|---|---|---|---|---|
| Jan 2004 | 74.4% | 23.0% | 2.5% | 69.5% | 30.2% | 0.2% |
| Feb 2004 | 73.9% | 23.6% | 2.5% | 64.1% | 35.7% | 0.2% |
| Mar 2004 | 74.3% | 23.2% | 2.5% | 65.6% | 34.2% | 0.2% |
| Apr 2004 | 73.8% | 23.2% | 2.9% | 62.2% | 37.5% | 0.3% |
| May 2004 | 72.6% | 24.5% | 2.9% | 63.0% | 36.8% | 0.2% |
| June 2004 | 71.8% | 25.3% | 2.9% | 65.5% | 34.1% | 0.4% |
| July 2004 | 70.9% | 26.2% | 2.9% | 68.6% | 31.0% | 0.4% |
| Aug 2004 | 71.0% | 26.0% | 3.1% | 74.4% | 25.3% | 0.4% |
| Sept 2004 | 71.0% | 26.0% | 3.0% | 76.6% | 23.1% | 0.3% |
| Oct 2004 | 70.7% | 26.5% | 2.9% | 76.8% | 22.8% | 0.4% |
| Nov 2004 | 70.7% | 26.5% | 2.8% | 73.4% | 26.4% | 0.2% |
| Dec 2004 | 69.1% | 27.8% | 3.1% | 73.5% | 26.2% | 0.3% |
| Jan 2005 | 67.6% | 29.1% | 3.3% | 71.7% | 28.0% | 0.3% |
| Feb 2005 | 66.7% | 30.3% | 3.0% | 75.3% | 24.4% | 0.3% |
| Mar 2005 | 66.4% | 30.3% | 3.3% | 72.4% | 27.3% | 0.3% |
| Apr 2005 | 65.5% | 30.9% | 3.6% | 76.7% | 23.0% | 0.3% |
| May 2005 | 64.6% | 31.9% | 3.5% | 80.3% | 19.5% | 0.2% |
| June 2005 | 63.2% | 33.1% | 3.7% | 78.0% | 21.7% | 0.3% |
| July 2005 | 62.5% | 34.0% | 3.5% | 73.7% | 25.9% | 0.4% |
| Aug 2005 | 62.0% | 34.5% | 3.5% | 72.8% | 26.8% | 0.4% |
| Sept 2005 | 61.5% | 34.6% | 3.9% | 74.0% | 25.5% | 0.4% |
| Oct 2005 | 62.0% | 34.7% | 3.4% | 75.7% | 23.8% | 0.5% |
| Nov 2005 | 61.2% | 34.9% | 3.9% | 76.8% | 22.6% | 0.6% |
| Dec 2005 | 61.0% | 35.5% | 3.5% | 79.4% | 20.2% | 0.3% |
| Jan 2006 | 60.9% | 35.5% | 3.6% | 84.9% | 14.9% | 0.3% |
| Feb 2006 | 62.4% | 34.5% | 3.1% | 84.9% | 14.7% | 0.5% |
| Mar 2006 | 62.6% | 34.2% | 3.2% | 85.9% | 13.6% | 0.4% |
| Apr 2006 | 62.1% | 34.6% | 3.3% | 86.8% | 13.0% | 0.2% |
| May 2006 | 61.5% | 35.0% | 3.5% | 88.5% | 11.1% | 0.4% |
| June 2006 | 59.3% | 37.3% | 3.4% | 90.2% | 9.7% | 0.2% |
| July 2006 | 59.0% | 37.6% | 3.4% | 90.7% | 9.1% | 0.2% |
| Aug 2006 | 59.3% | 37.1% | 3.6% | 90.4% | 9.2% | 0.4% |
| Sept 2006 | 58.7% | 37.6% | 3.7% | 88.7% | 11.1% | 0.2% |
| Oct 2006 | 58.2% | 37.9% | 3.9% | 87.3% | 12.5% | 0.2% |
| Nov 2006 | 58.3% | 38.1% | 3.6% | 84.4% | 15.3% | 0.3% |
| Dec 2006 | 56.6% | 39.7% | 3.7% | 84.4% | 15.1% | 0.5% |
| Jan 2007 | 55.2% | 40.1% | 4.6% | 83.4% | 16.1% | 0.4% |
| Feb 2007 | 56.8% | 38.7% | 4.5% | 85.1% | 14.3% | 0.5% |
| Mar 2007 | 58.3% | 36.9% | 4.8% | 86.3% | 13.1% | 0.5% |
| Apr 2007 | 58.4% | 36.3% | 5.3% | 86.4% | 13.3% | 0.3% |
| May 2007 | 58.7% | 36.1% | 5.1% | 88.7% | 11.1% | 0.2% |
| June 2007 | 58.4% | 36.6% | 5.0% | 90.5% | 9.3% | 0.3% |
| July 2007 | 59.7% | 35.0% | 5.2% | 93.5% | 6.4% | 0.1% |
| Aug 2007 | 61.0% | 34.0% | 5.0% | 93.8% | 6.0% | 0.2% |
| Sept 2007 | 63.4% | 31.5% | 5.0% | 93.7% | 6.3% | 0.1% |
| Oct 2007 | 64.7% | 30.0% | 5.3% | 92.9% | 6.9% | 0.1% |
| Nov 2007 | 64.8% | 30.3% | 4.9% | 91.7% | 8.2% | 0.1% |
| Dec 2007 | 65.4% | 30.0% | 4.5% | 90.2% | 9.7% | 0.1% |
| Jan 2008 | 66.9% | 28.3% | 4.8% | 88.9% | 11.0% | 0.1% |
| Feb 2008 | 69.9% | 25.6% | 4.6% | 84.8% | 15.0% | 0.2% |
| Mar 2008 | 72.8% | 23.1% | 4.1% | 87.2% | 12.5% | 0.3% |
| Apr 2008 | 76.6% | 19.6% | 3.9% | 89.7% | 10.1% | 0.2% |
| May 2008 | 78.2% | 18.2% | 3.6% | 91.7% | 8.2% | 0.1% |
| June 2008 | 78.2% | 18.2% | 3.5% | 93.4% | 6.5% | 0.1% |
| July 2008 | 78.9% | 17.6% | 3.5% | 94.5% | 5.4% | 0.1% |
| Aug 2008 | 80.0% | 16.4% | 3.6% | 95.4% | 4.6% | 0.1% |
| Sept 2008 | 83.2% | 13.7% | 3.2% | 95.1% | 4.8% | 0.1% |
| Oct 2008 | 78.9% | 16.8% | 4.3% | 93.2% | 6.7% | 0.1% |
| Nov 2008 | 78.2% | 17.2% | 4.6% | 94.0% | 5.9% | 0.1% |
| Dec 2008 | 78.3% | 17.3% | 4.4% | 89.9% | 9.9% | 0.2% |
| Jan 2009 | 76.7% | 18.4% | 4.8% | 82.0% | 17.7% | 0.3% |
| Feb 2009 | 75.7% | 19.4% | 4.9% | 80.1% | 19.5% | 0.4% |
| Mar 2009 | 76.9% | 18.3% | 4.8% | 81.7% | 18.0% | 0.3% |
| Apr 2009 | 77.0% | 17.6% | 5.5% | 81.9% | 17.8% | 0.3% |
| May 2009 | 76.3% | 17.8% | 5.9% | 80.2% | 19.5% | 0.3% |
| June 2009 | 76.2% | 17.8% | 6.0% | 77.8% | 21.8% | 0.4% |
| July 2009 | 76.4% | 17.1% | 6.5% | 82.5% | 17.3% | 0.3% |
| Aug 2009 | 76.7% | 16.5% | 6.8% | 84.7% | 15.1% | 0.2% |
| Sept 2009 | 76.9% | 15.9% | 7.3% | 86.5% | 13.3% | 0.2% |
| Oct 2009 | 77.8% | 15.0% | 7.2% | 87.1% | 12.6% | 0.2% |
| Nov 2009 | 77.4% | 15.1% | 7.5% | 85.7% | 14.1% | 0.2% |
| Dec 2009 | 75.8% | 16.0% | 8.1% | 84.6% | 15.2% | 0.2% |
| Jan 2010 | 75.6% | 16.4% | 8.0% | 81.2% | 18.4% | 0.5% |
| Feb 2010 | 76.3% | 16.4% | 7.3% | 81.6% | 18.0% | 0.4% |
| Mar 2010 | 76.8% | 15.7% | 7.5% | 80.9% | 18.7% | 0.4% |
| Apr 2010 | 76.5% | 15.5% | 8.1% | 81.2% | 18.4% | 0.4% |
| May 2010 | 79.0% | 16.5% | 4.5% | 80.5% | 19.2% | 0.4% |
| June 2010 | 79.5% | 17.7% | 2.8% | 78.9% | 20.8% | 0.3% |
| July 2010 | 75.8% | 21.2% | 3.0% | 77.9% | 21.9% | 0.2% |
| Aug 2010 | 75.9% | 20.8% | 3.3% | 78.8% | 21.0% | 0.3% |
| Sept 2010 | 76.1% | 20.0% | 3.9% | 79.0% | 20.7% | 0.2% |
| Oct 2010 | 75.1% | 20.0% | 4.9% | 78.3% | 21.5% | 0.2% |
| Nov 2010 | 73.6% | 20.5% | 5.8% | 75.9% | 23.6% | 0.5% |
| Dec 2010 | 72.5% | 21.3% | 6.2% | 70.9% | 28.5% | 0.6% |
| Jan 2011 | 71.7% | 20.9% | 7.3% | 69.4% | 30.1% | 0.5% |
| Feb 2011 | 72.2% | 20.9% | 6.8% | 72.0% | 27.4% | 0.5% |
| Mar 2011 | 72.3% | 20.4% | 7.3% | 74.9% | 24.6% | 0.4% |
| Apr 2011 | 72.0% | 20.4% | 7.6% | 75.0% | 24.6% | 0.4% |
| May 2011 | 70.9% | 21.8% | 7.3% | 70.6% | 28.9% | 0.5% |
| June 2011 | 68.6% | 23.5% | 7.9% | 63.2% | 36.2% | 0.6% |
| July 2011 | 67.6% | 23.9% | 8.6% | 57.2% | 42.1% | 0.7% |
| Aug 2011 | 67.1% | 23.8% | 9.1% | 57.3% | 42.0% | 0.7% |
| Sept 2011 | 66.8% | 22.8% | 10.4% | 51.3% | 47.1% | 1.6% |
| Oct 2011 | 67.7% | 24.0% | 8.3% | 50.1% | 48.7% | 1.2% |
| Nov 2011 | 67.7% | 24.1% | 8.3% | 49.8% | 49.6% | 0.6% |
| Dec 2011 | 67.0% | 24.9% | 8.1% | 51.0% | 48.5% | 0.6% |
| Jan 2012 | 68.3% | 23.0% | 8.7% | 53.6% | 46.0% | 0.5% |
| Feb 2012 | 68.1% | 23.5% | 8.4% | 56.4% | 43.1% | 0.5% |
| Mar 2012 | 68.9% | 22.8% | 8.2% | 58.6% | 40.8% | 0.6% |
| Apr 2012 | 68.7% | 23.0% | 8.4% | 59.3% | 40.0% | 0.6% |
| May 2012 | 66.9% | 24.4% | 8.7% | 53.3% | 45.8% | 0.9% |
| June 2012 | 64.9% | 26.3% | 8.8% | 55.0% | 44.1% | 0.9% |
| July 2012 | 64.2% | 26.8% | 9.0% | 60.4% | 38.8% | 0.8% |
| Aug 2012 | 64.1% | 26.3% | 9.6% | 58.6% | 40.5% | 0.9% |
| Sept 2012 | 63.5% | 26.0% | 10.5% | 57.9% | 41.8% | 0.2% |
| Oct 2012 | 64.8% | 26.2% | 9.0% | 59.7% | 39.8% | 0.6% |
| Nov 2012 | 64.5% | 26.6% | 8.9% | 57.6% | 41.5% | 1.0% |
| Dec 2012 | 64.0% | 26.8% | 9.2% | 57.5% | 41.5% | 1.1% |
| Jan 2013 | 63.5% | 25.8% | 10.7% | 58.0% | 41.0% | 1.0% |
| Feb 2013 | 63.2% | 26.9% | 9.9% | 57.9% | 41.1% | 1.0% |
| Mar 2013 | 63.1% | 27.1% | 9.8% | 57.8% | 41.2% | 1.0% |
| Apr 2013 | 63.2% | 27.2% | 9.6% | 60.6% | 38.4% | 1.0% |
| May 2013 | 61.4% | 29.5% | 9.1% | 54.2% | 44.7% | 1.1% |
| June 2013 | 59.5% | 31.6% | 8.9% | 49.8% | 49.1% | 1.1% |
| July 2013 | 58.1% | 32.2% | 9.7% | 50.2% | 48.9% | 1.0% |
| Aug 2013 | 56.9% | 32.7% | 10.4% | 54.8% | 44.3% | 0.9% |
| Sept 2013 | 57.1% | 32.0% | 11.0% | 58.7% | 40.6% | 0.7% |
| Oct 2013 | 60.9% | 33.6% | 5.6% | 55.8% | 43.8% | 0.4% |
| Nov 2013 | 57.3% | 32.0% | 10.7% | 51.1% | 48.1% | 0.7% |
| Dec 2013 | 56.9% | 33.0% | 10.2% | 49.3% | 49.9% | 0.8% |
| Jan 2014 | 56.2% | 32.1% | 11.7% | 51.1% | 48.3% | 0.6% |
| Feb 2014 | 56.1% | 34.3% | 9.7% | 49.0% | 50.3% | 0.6% |
| Mar 2014 | 56.0% | 34.3% | 9.8% | 46.2% | 53.2% | 0.6% |
| Apr 2014 | 56.7% | 33.6% | 9.7% | 47.7% | 51.7% | 0.6% |
| May 2014 | 55.6% | 35.0% | 9.3% | 45.6% | 54.1% | 0.3% |
| June 2014 | 54.4% | 36.7% | 8.9% | 40.1% | 59.5% | 0.4% |
| July 2014 | 54.5% | 36.5% | 9.0% | 39.0% | 60.6% | 0.4% |
| Aug 2014 | 53.9% | 36.6% | 9.5% | 38.0% | 61.7% | 0.3% |
| Sept 2014 | 53.6% | 36.2% | 10.2% | 37.2% | 62.4% | 0.4% |
| Oct 2014 | 54.3% | 35.8% | 9.9% | 35.3% | 64.3% | 0.4% |
| Nov 2014 | 53.5% | 35.6% | 10.9% | 28.2% | 71.5% | 0.3% |
| Dec 2014 | 54.1% | 37.8% | 8.1% | 29.4% | 70.3% | 0.3% |
| Jan 2015 | 52.3% | 37.6% | 10.1% | 24.1% | 75.6% | 0.3% |
| Feb 2015 | 57.6% | 34.4% | 8.0% | 53.8% | 46.0% | 0.2% |
| Mar 2015 | 60.7% | 32.4% | 6.9% | 62.3% | 37.5% | 0.2% |
| Apr 2015 | 62.6% | 31.0% | 6.3% | 61.1% | 38.6% | 0.3% |
| May 2015 | 62.2% | 31.8% | 6.0% | 57.7% | 42.1% | 0.2% |
| June 2015 | 61.9% | 32.1% | 6.1% | 58.8% | 41.0% | 0.2% |
| July 2015 | 62.1% | 32.0% | 5.9% | 57.5% | 42.3% | 0.2% |
| Aug 2015 | 62.2% | 31.3% | 6.5% | 57.5% | 42.3% | 0.2% |
| Sept 2015 | 62.4% | 30.8% | 6.8% | 55.4% | 44.4% | 0.2% |
| Oct 2015 | 62.2% | 31.6% | 6.1% | 52.3% | 47.5% | 0.2% |
| Nov 2015 | 61.9% | 31.7% | 6.4% | 50.7% | 49.1% | 0.2% |
| Dec 2015 | 61.7% | 32.5% | 5.8% | 49.8% | 50.0% | 0.2% |
| Jan 2016 | 62.0% | 31.8% | 6.2% | 49.9% | 49.9% | 0.1% |
| Feb 2016 | 62.3% | 32.1% | 5.5% | 47.5% | 52.3% | 0.2% |
| Mar 2016 | 62.5% | 32.2% | 5.3% | 42.0% | 57.8% | 0.2% |
| Apr 2016 | 62.8% | 31.6% | 5.6% | 42.3% | 57.5% | 0.2% |
| May 2016 | 61.3% | 33.1% | 5.6% | 43.4% | 56.4% | 0.2% |
| June 2016 | 60.9% | 33.7% | 5.5% | 44.8% | 55.1% | 0.2% |
| July 2016 | 60.9% | 33.5% | 5.6% | 42.6% | 57.3% | 0.2% |
| Aug 2016 | 60.8% | 33.5% | 5.7% | 40.9% | 59.0% | 0.1% |
| Sept 2016 | 61.1% | 33.3% | 5.6% | 40.4% | 59.5% | 0.1% |
| Oct 2016 | 61.0% | 32.7% | 6.3% | 41.3% | 58.3% | 0.3% |
| Nov 2016 | 60.3% | 33.4% | 6.3% | 41.8% | 57.6% | 0.6% |
| Dec 2016 | 60.5% | 33.1% | 6.4% | 43.7% | 55.5% | 0.8% |
| Jan 2017 | 59.8% | 33.4% | 6.8% | 48.7% | 50.5% | 0.8% |
| Feb 2017 | 60.0% | 34.2% | 5.8% | 54.8% | 44.5% | 0.7% |
| Mar 2017 | 61.2% | 33.0% | 5.8% | 52.9% | 46.4% | 0.7% |
| Apr 2017 | 61.0% | 33.2% | 5.8% | 50.1% | 49.2% | 0.7% |
| May 2017 | 59.4% | 34.9% | 5.8% | 48.2% | 51.3% | 0.5% |
| June 2017 | 58.3% | 36.0% | 5.7% | 47.1% | 52.4% | 0.5% |
| July 2017 | 58.2% | 35.8% | 6.0% | 44.3% | 55.2% | 0.5% |
| Aug 2017 | 58.4% | 35.3% | 6.3% | 45.2% | 54.2% | 0.6% |
| Sept 2017 | 57.7% | 35.9% | 6.4% | 44.1% | 55.3% | 0.5% |
| Oct 2017 | 57.8% | 36.0% | 6.2% | 43.9% | 55.6% | 0.5% |
| Nov 2017 | 57.2% | 36.4% | 6.3% | 44.1% | 55.4% | 0.5% |
| Dec 2017 | 57.1% | 36.8% | 6.1% | 44.0% | 55.6% | 0.4% |
When interest rates are low, falling, or low & falling homeowners have a significant incentive to refinance their home loans to both lower their monthly payments & lower the rate of interest charged on their loans.
| Year | Purchase | Buy % | Refinance | Refi % | Home Improvement | H I % | Total |
|---|---|---|---|---|---|---|---|
| 2015 | 3,199,645 | 51.41% | 2,841,018 | 45.65% | 183,124 | 2.94% | 6,223,787 |
| 2016 | 3,544,594 | 49.54% | 3,370,884 | 47.11% | 239,511 | 3.35% | 7,154,989 |
| 2017 | 3,686,516 | 60.29% | 2,200,838 | 35.99% | 227,067 | 3.71% | 6,114,421 |
| 2018 | 4,351,463 | 72.25% | 1,102,940 | 18.31% | 568,778 | 9.44% | 6,023,181 |
| 2019 | 4,522,861 | 61.59% | 2,281,284 | 31.06% | 539,496 | 7.35% | 7,343,641 |
| 2020 | 4,922,692 | 40.84% | 6,677,584 | 55.41% | 451,893 | 3.75% | 12,052,169 |
| 2021 | 5,396,998 | 46.39% | 5,689,711 | 48.90% | 547,732 | 4.71% | 11,634,441 |
| 2022 | 4,366,283 | 70.07% | 1,082,136 | 17.37% | 782,649 | 12.56% | 6,231,068 |
When interest rates rise much of the demand to refinance dissipates, as homeowners prefer to maintain their existing loans with lower rates. In 2017 there were over a million fewer refinances than during 2016 as interest rates rose. In 2018 there was once again fewer refinancing loans as interest rates continued rising. As the Federal Reserve engaged in QE and ZIRP there was a large boom in refinancing activity in 2020 and 2021. As rates began to normalize again in 2022 and 2023 refinancing volume fell off a cliff.
Home equity loans & home equity lines of credit allow homeowners to borrow against a portion of their home equity while maintaining their first mortgage at its existing low rate. TransUnion published a study in 2017 which suggested there will be an average of 2 million HELOCs per year between 2018 and 2022. Much like with refinance volume shifts, actual home equity loan demand was impossible to predict given the impacts of the COVID-19 lockdowns & offsetting central bank intervensions on the global economy.
Here is a breakdown of refinancing activity by ethnicity & income.
| Borrower | 2004 | 2005 | 2006 | 2007 | 2008 | 2009 | 2010 | 2011 | 2012 | 2013 | 2014 | 2015 | 2016 | 2017 |
|---|---|---|---|---|---|---|---|---|---|---|---|---|---|---|
| Asian | 3.5% | 2.9% | 3.0% | 3.1% | 3.1% | 4.1% | 5.2% | 5.4% | 5.5% | 4.7% | 4.3% | 5.0% | 5.5% | 4.0% |
| African American | 7.4% | 8.3% | 9.6% | 8.4% | 6.0% | 3.5% | 2.9% | 3.1% | 3.3% | 4.4% | 5.4% | 5.0% | 5.0% | 6.0% |
| Hispanic white | 6.2% | 8.6% | 10.1% | 8.7% | 5.3% | 3.2% | 3.0% | 3.3% | 3.9% | 5.0% | 6.2% | 6.3% | 6.2% | 6.8% |
| Non-Hispanic white | 57.2% | 60.9% | 59.6% | 62.7% | 70.7% | 74.6% | 74.3% | 73.5% | 72.5% | 70.5% | 67.8% | 67.2% | 65.2% | 63.3% |
| Other minority | 1.4% | 1.4% | 1.3% | 1.1% | 0.8% | 0.6% | 0.5% | 0.6% | 0.6% | 0.7% | 0.9% | 0.8% | 0.9% | 1.0% |
| Joint | 2.1% | 2.1% | 1.9% | 2.0% | 2.2% | 2.6% | 2.7% | 2.8% | 3.1% | 3.1% | 3.2% | 3.3% | 3.4% | 3.3% |
| Missing race | 22.1% | 15.7% | 14.6% | 14.1% | 11.9% | 11.4% | 11.4% | 11.3% | 11.1% | 11.6% | 12.2% | 12.4% | 13.8% | 15.7% |
| Low or moderate income | 26.2% | 25.5% | 24.7% | 23.3% | 23.4% | 19.6% | 18.9% | 19.2% | 19.6% | 21.1% | 22.1% | 19.0% | 16.9% | 22.9% |
| Middle income | 26.3% | 26.8% | 26.1% | 25.5% | 25.4% | 22.4% | 22.5% | 21.3% | 21.8% | 21.7% | 21.9% | 21.0% | 20.3% | 23.3% |
| High income | 38.8% | 40.8% | 43.7% | 46.0% | 44.6% | 45.6% | 49.5% | 48.1% | 47.6% | 46.3% | 44.9% | 45.2% | 47.5% | 44.0% |
| Income not used or N/A | 8.7% | 6.9% | 5.5% | 5.2% | 6.6% | 12.4% | 9.1% | 11.4% | 10.9% | 11.0% | 11.1% | 14.8% | 15.3% | 9.7% |
| Low or moderate income neighborhood | 15.3% | 16.5% | 17.9% | 16.1% | 11.9% | 7.8% | 7.2% | 7.4% | 10.1% | 12.1% | 13.3% | 12.3% | 12.0% | 15.5% |
| Middle income neighborhood | 50.0% | 51.3% | 52.0% | 52.2% | 51.9% | 47.5% | 46.1% | 46.1% | 41.9% | 43.7% | 45.3% | 43.8% | 43.4% | 44.6% |
| High income neighborhood | 33.9% | 31.6% | 29.4% | 31.0% | 35.2% | 43.5% | 46.0% | 46.0% | 47.6% | 43.9% | 41.3% | 43.7% | 44.4% | 39.7% |
| Refinance loans (thousands) | 3,588 | 2,869 | 5,243 | 4,483 | 3,823 | 5,888 | 4,349 | 1,971 | 2,816 | 3,341 | 2,170 |
Foreclosure is quite uncommon. In the wake of the 2008-2009 global recession which was driven in large part by a housing crash much of the damage was concentrated on the states of Arizona, California, Florida & Nevada.
According to ATTOM Data lenders repossessed 11,020 properties through foreclosures in Q3 2023 & started the foreclosure process on 68,961 homes in the quarter. From 2006 to 2015 foreclosure starts remained elevated, though settled down around 100,000 per month before the pandemic. Not all foreclosure starts wind up in forclosure. Roughly 40% of foreclosure starts wind up in foreclosure.
The following table shows how common foreclosure filings are across the United States on a state by state basis, as of the end of Q3 2023.
| Rate Rank | State Name | Properties with Filings | 1/every X HU (Foreclosure Rate) | %∆ Q2 2023 | %∆ Q3 2022 |
|---|---|---|---|---|---|
| U.S. | 124,539 | 1,121 | 27.59 | 34.44 | |
| 24 | Alabama | 1,556 | 1,464 | 20.34 | 22.42 |
| 22 | Alaska | 224 | 1,410 | 31.76 | 35.76 |
| 26 | Arizona | 2,007 | 1,523 | 41.24 | 56.67 |
| 31 | Arkansas | 694 | 1,962 | -0.14 | 50.54 |
| 13 | California | 14,230 | 1,007 | 44.92 | 31.15 |
| 34 | Colorado | 1,192 | 2,059 | 12.67 | 1.71 |
| 9 | Connecticut | 1,826 | 836 | 32.32 | 51.54 |
| 3 | Delaware | 602 | 739 | 24.12 | 10.66 |
| District of Columbia | 332 | 1,037 | 3.43 | 472.41 | |
| 8 | Florida | 11,810 | 827 | 9.39 | 27.21 |
| 14 | Georgia | 4,014 | 1,090 | 22.34 | 32.87 |
| 21 | Hawaii | 401 | 1,389 | 47.43 | 67.78 |
| 37 | Idaho | 332 | 2,235 | 24.34 | 84.44 |
| 6 | Illinois | 6,763 | 800 | -3.55 | -13.53 |
| 12 | Indiana | 2,904 | 1,003 | 14.33 | 14.65 |
| 20 | Iowa | 1,022 | 1,377 | 1.49 | 8.49 |
| 46 | Kansas | 356 | 3,574 | 17.88 | -12.10 |
| 41 | Kentucky | 801 | 2,482 | 54.34 | 79.19 |
| 19 | Louisiana | 1,580 | 1,308 | 28.25 | 45.62 |
| 32 | Maine | 374 | 1,973 | 1.36 | -3.61 |
| 5 | Maryland | 3,226 | 780 | -7.56 | 53.40 |
| 27 | Massachusetts | 1,875 | 1,589 | 58.50 | 40.24 |
| 23 | Michigan | 3,210 | 1,423 | 7.29 | -9.50 |
| 30 | Minnesota | 1,302 | 1,897 | 4.66 | 16.56 |
| 40 | Mississippi | 554 | 2,378 | 11.69 | 9.27 |
| 33 | Missouri | 1,395 | 1,994 | 21.94 | 23.23 |
| 48 | Montana | 131 | 3,913 | 20.18 | 27.18 |
| 42 | Nebraska | 334 | 2,517 | -5.38 | 17.19 |
| 4 | Nevada | 1,665 | 763 | 42.92 | 34.17 |
| 36 | New Hampshire | 285 | 2,233 | 36.36 | 26.11 |
| 1 | New Jersey | 6,279 | 595 | 30.38 | 42.67 |
| 25 | New Mexico | 618 | 1,517 | 10.75 | 52.97 |
| 11 | New York | 9,036 | 935 | 50.47 | 52.48 |
| 17 | North Carolina | 3,773 | 1,239 | 24.36 | 42.59 |
| 47 | North Dakota | 103 | 3,593 | 77.59 | 128.89 |
| 7 | Ohio | 6,518 | 803 | 17.82 | 27.65 |
| 18 | Oklahoma | 1,351 | 1,289 | 19.14 | 54.05 |
| 43 | Oregon | 659 | 2,730 | -0.75 | 15.01 |
| 15 | Pennsylvania | 4,706 | 1,217 | 18.72 | 61.66 |
| 35 | Rhode Island | 219 | 2,197 | 14.06 | 19.02 |
| 2 | South Carolina | 3,184 | 730 | 28.39 | 31.84 |
| 49 | South Dakota | 63 | 6,165 | 186.36 | 173.91 |
| 39 | Tennessee | 1,301 | 2,314 | 13.43 | 4.92 |
| 10 | Texas | 13,647 | 838 | 95.35 | 106.99 |
| 16 | Utah | 929 | 1,220 | 67.99 | 65.30 |
| 50 | Vermont | 19 | 17,554 | -36.67 | 26.67 |
| 28 | Virginia | 2,114 | 1,701 | 18.70 | 24.28 |
| 45 | Washington | 1,092 | 2,904 | 31.88 | 27.42 |
| 44 | West Virginia | 309 | 2,781 | 38.57 | 85.03 |
| 29 | Wisconsin | 1,504 | 1,807 | 73.07 | 66.19 |
| 38 | Wyoming | 118 | 2,304 | 9.26 | -11.28 |
The following graphs show how prevelant foreclosures were in the United States & key sunbelt states during the Great Recession until the recent past, along with demographic breakdowns by age.
Most mortgages which are not current end up getting back to current rather than ending up in foreclosure.
The above spike in delinquencies was driven by the combination of a housing price crash, a global recession, and many consumers levering up by refinancing during the housing boom.
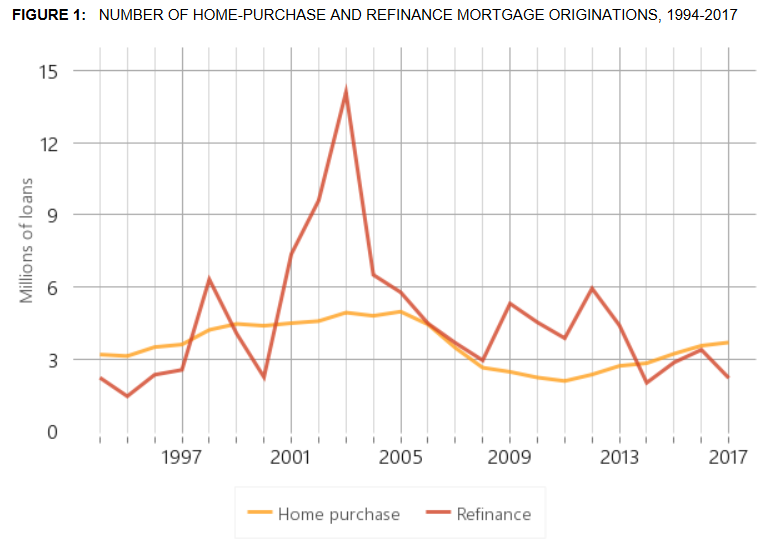
In states like California with high real estate prices homeowners carry a higher debt load against their homes.
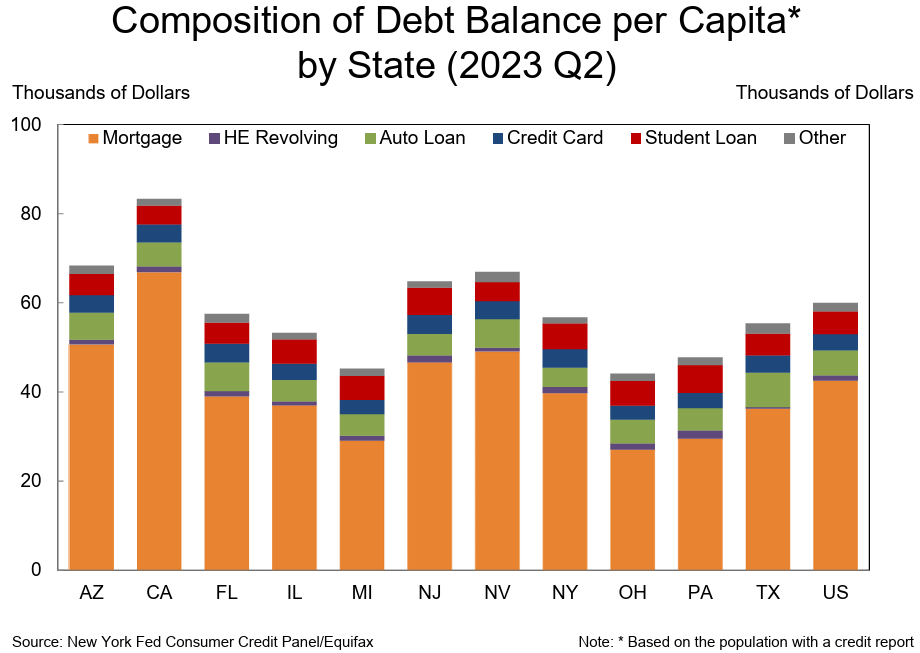
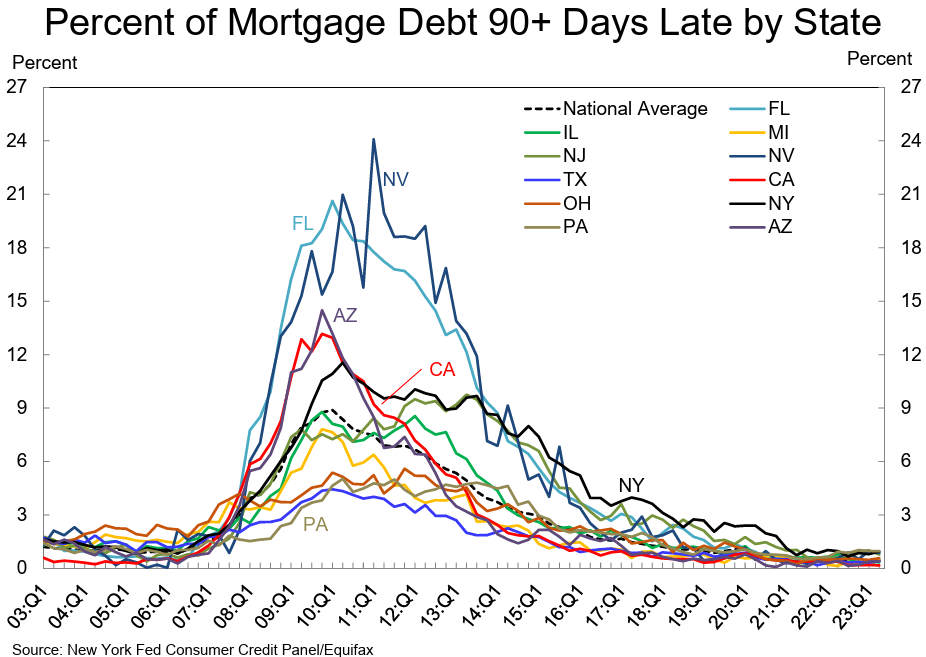
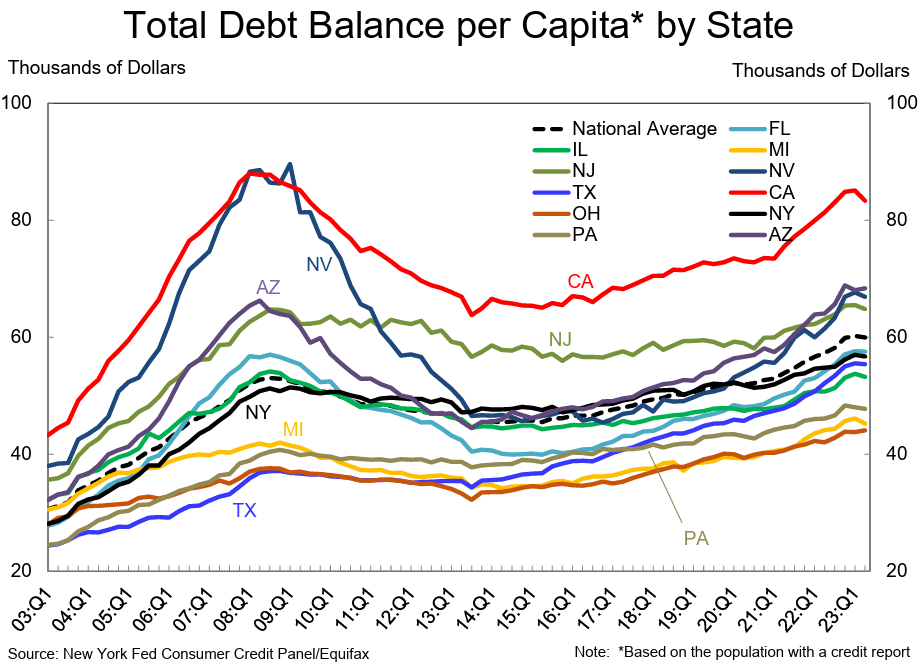
The number of bankruptcy filings vastly exceeds the number of foreclosures.
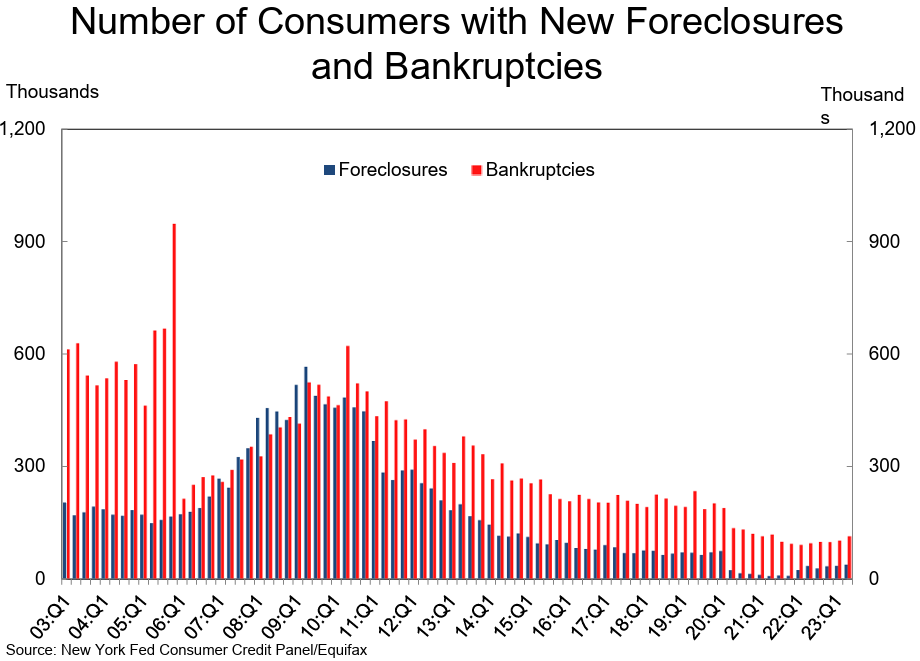
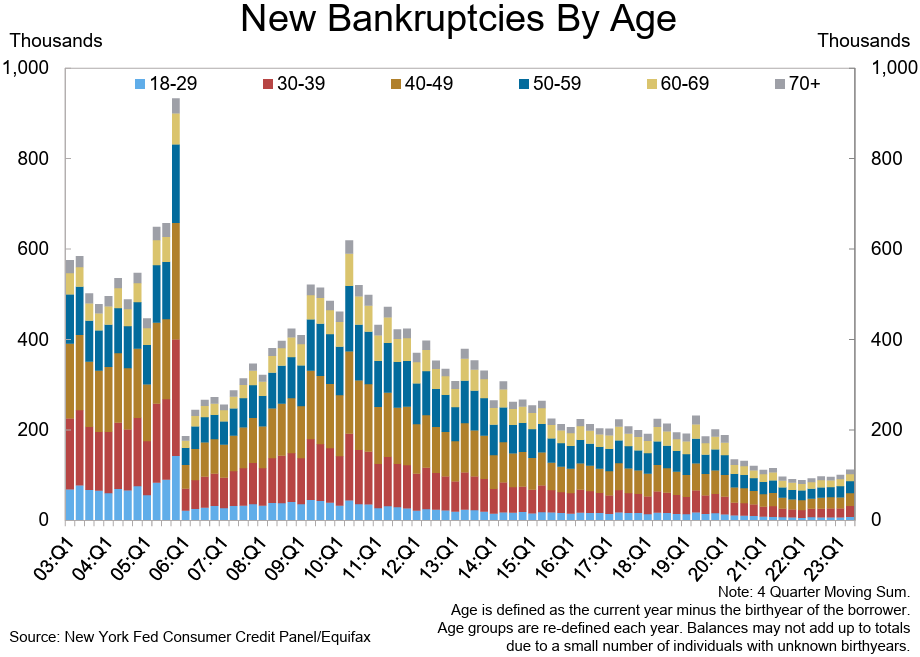
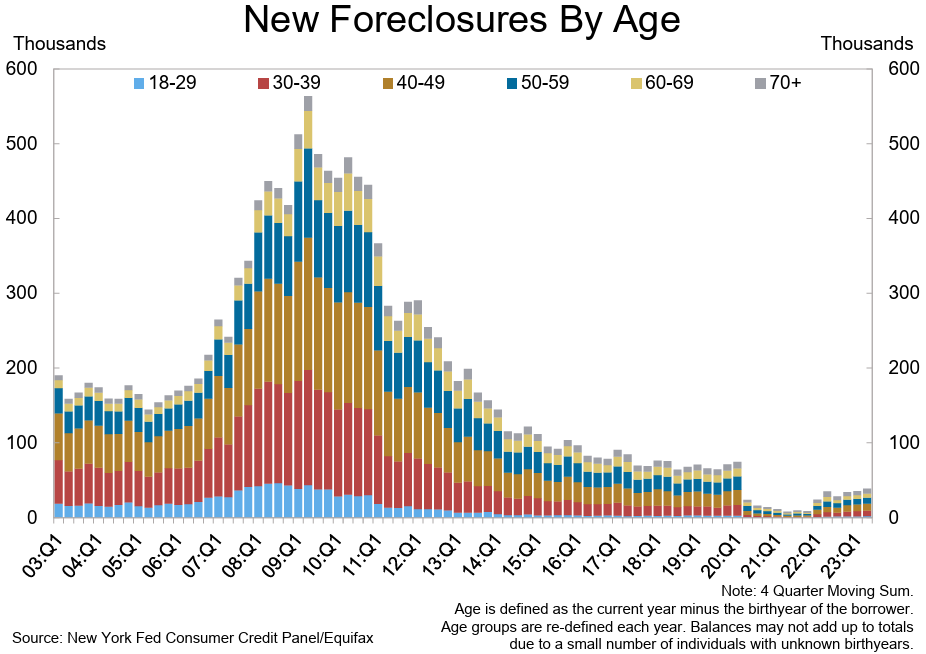
Homeowners are far more likely to fall behind on credit card or student loan payments than they are to fall behind on car or home loans.
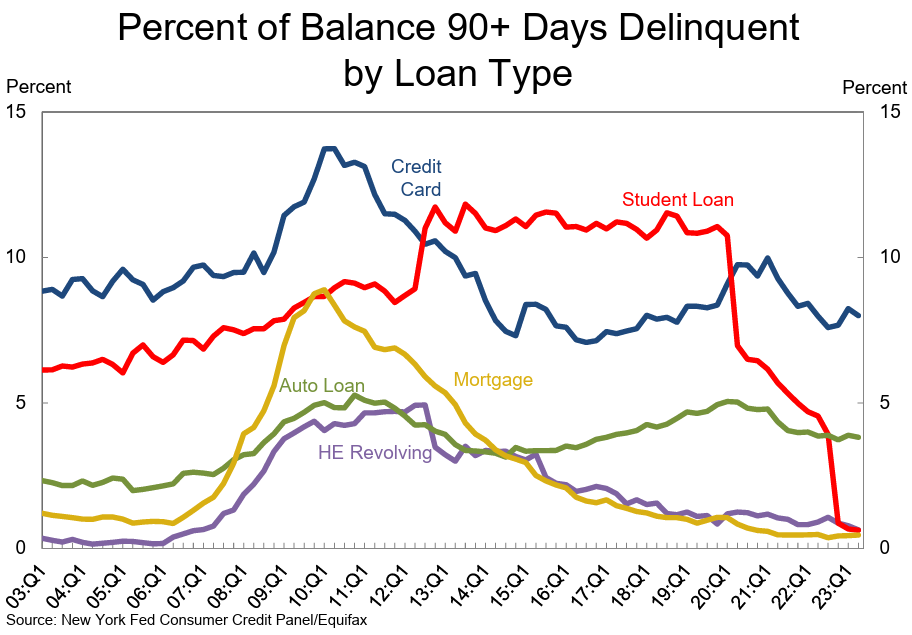
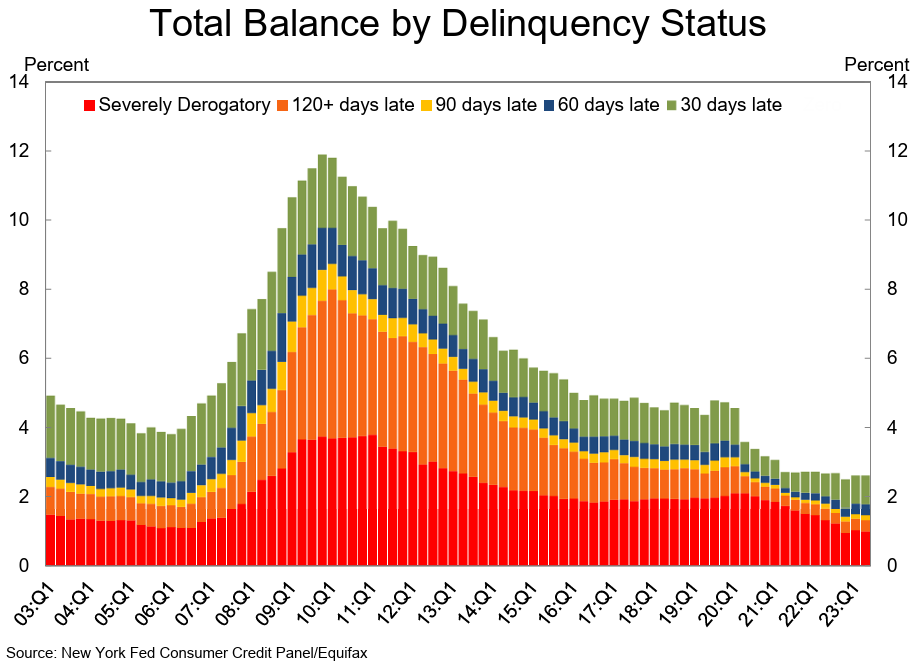
From 1931 to 1935 in the Great Depression the foreclosure rate exceeded 1%. Between 2007 & 2016 over 7.7 million homes were foreclosed upon. Over 1.1 million foreclosures occured across California, while Florida had 960,000 foreclosures. Foreclosures were more prevanent in housing boom cities like Miami & Las Vegas.
Over 3.4 million homeowners lowered foreclosure risk by modifying their loans under the HARP program.
There are over 134 million housing units across the United States. In the decade following the Great Recession about 5.8% of homes were foreclosed upon.
Prior to the crisis period about 1,000,000 homes were foreclosed upon each year according to the Mortgage Bankers Association.
The Urban Institute's Laurie Goodman & Jun Zhu published a research resport on default and loss experience in May of 2016 leveraging Fannie Mae and Freddie Mac single-family loan performance data. The following data is from table 2 in the report.
| Property Type | 1 Unit Owner Occupied | 1 Unit Investment | Duplex Owner Occupied | Duplex Investment | 3-4 Unit Owner Occupied | 3-4 Unit Investment | Total |
|---|---|---|---|---|---|---|---|
| Loan Characteristics | |||||||
| FICO | 738.34 | 752.75 | 731.19 | 747.33 | 736.19 | 752.53 | 739.37 |
| DTI | 35.25 | 34.19 | 38.46 | 35.04 | 38.39 | 34.42 | 35.21 |
| Original Balance | 191,029 | 129,141 | 233,917 | 147,504 | 311,729 | 229,053 | 187,201 |
| LTV | 79.76 | 77.18 | 80.36 | 77.84 | 76.03 | 72.66 | 79.54 |
| % LTV > 80 | 35.2% | 17.4% | 34.6% | 22.5% | 9.7% | 0.6% | 33.7% |
| Default rate | 3.2% | 2.9% | 5.3% | 4.2% | 4.1% | 2.3% | 3.2% |
| Loan count | 13,299,542 | 987,415 | 132,012 | 118,305 | 21,394 | 54,826 | 14,613,494 |
| Termination Events (%) | |||||||
| Curent | 15.85 | 7.12 | 26.95 | 9.19 | 23.87 | 10.60 | 15.39 |
| Persistently delinquent | 10.27 | 6.82 | 9.95 | 6.64 | 12.81 | 7.25 | 10.03 |
| Prepayment | 14.40 | 10.14 | 22.63 | 14.41 | 24.45 | 18.97 | 14.24 |
| Liquidation | 59.48 | 75.92 | 40.47 | 69.77 | 38.86 | 63.18 | 60.34 |
| Loss Severity | 37.27 | 59.32 | 57.46 | 67.52 | 63.09 | 73.07 | 39.46 |
| 2014 Loan Characteristics | |||||||
| FICO | 752.20 | 767.36 | 752.28 | 764.30 | 752.61 | 764.65 | 753.45 |
| DTI | 34.25 | 33.87 | 38.04 | 34.29 | 38.54 | 33.81 | 34.24 |
| Original Balance | 231,249.51 | 161,708.49 | 330,294.27 | 236,244.81 | 419,957.02 | 328,127.98 | 226,964.62 |
| LTV | 83.14 | 74.96 | 75.39 | 71.70 | 72.88 | 71.27 | 82.38 |
From the above table you can see that owner-occupied homes tend to have a slightly higher default rate than investment properties, and investor-owned properties start off with a lower LTV that gives them a bigger cushion. In spite of both of those, the loss severity on investment properties is signficantly higher than those on owner-occupied homes. Conceptually this makes sense, as investors would be more likely to forego maintenance on underperforming properties before giving up on them, whereas an owner living in the home would likely want to keep things in good operating order for the sake of the quality of their own life.
The Federal Reserve Bank of Philadelphia put out a working paper on Owner-Occupancy Fraud and Mortgage Performance. Their research suggested the problem is broad-based, iwth 1/3 of all investment properties being misrepresented as owner occupied. They noted the fraudulent borrowers perform significantly worse than typical investors, defaulting at a 75% higher rate than the investors who correctly obtained an investment loan instead of claiming the property as their primary residence. These owners are more likely to do strategic defaults than other investors if and when housing prices decline. The data period their research covers includes first-lien purchase mortgages for single-family units between January 2005 and December 2017. They found fraudulent investors accounted for over 11% of the dollar volume of defaults in spite of only making up under 4% of loan originations.
The following charts show the occupancy fraud rate by year and its geographic concentration during and after the housing bubble that lead to the great recession.
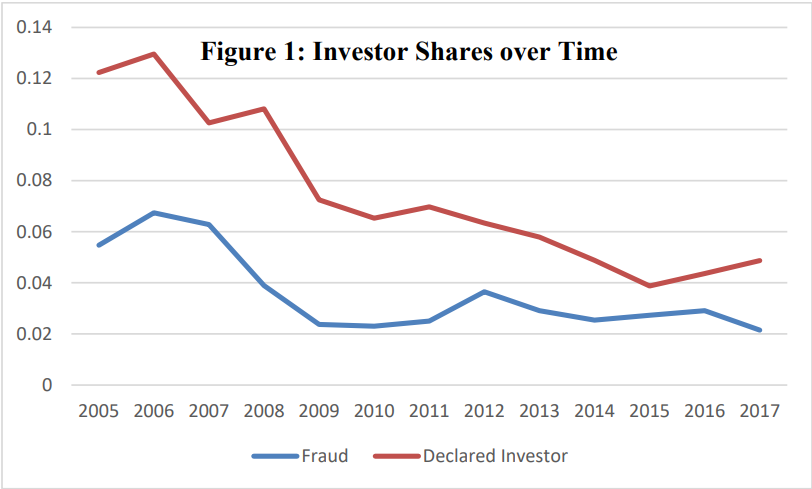
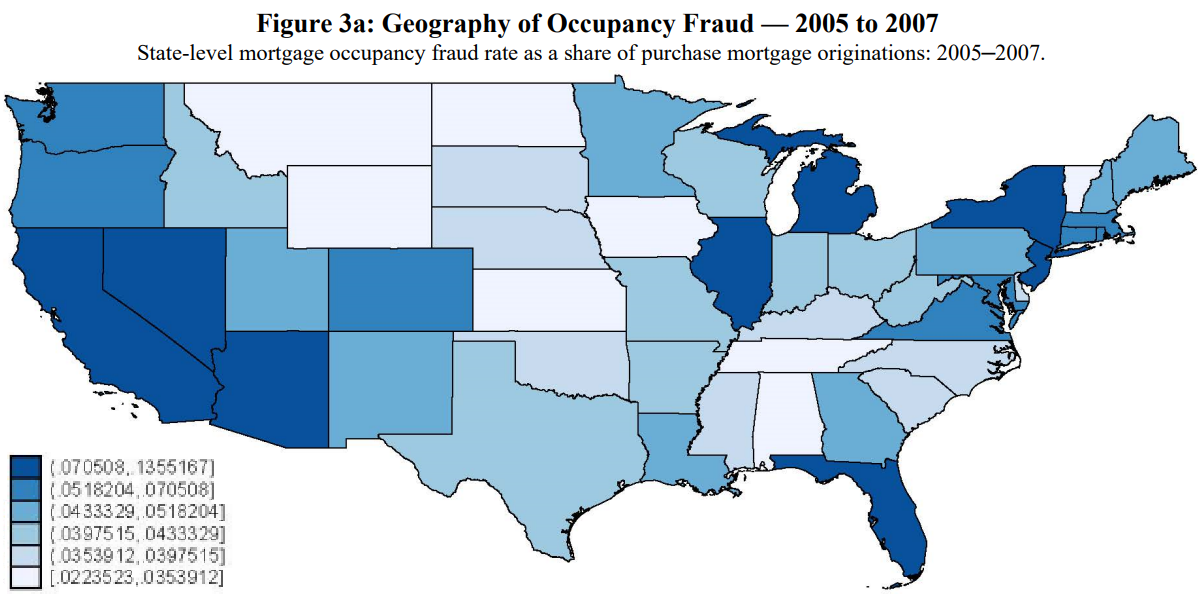
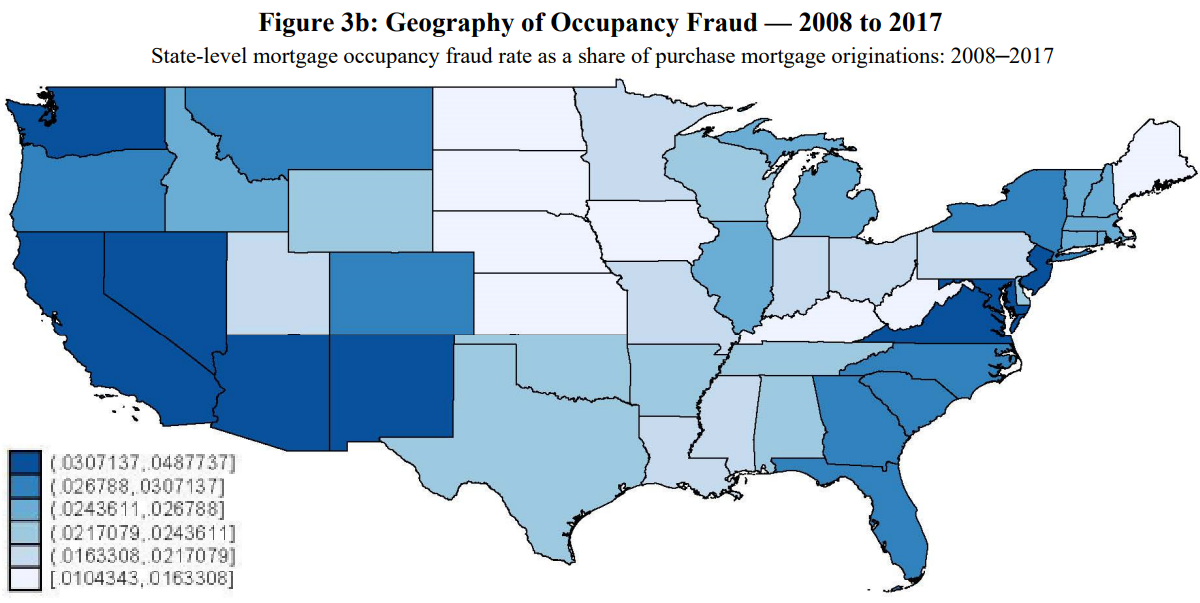
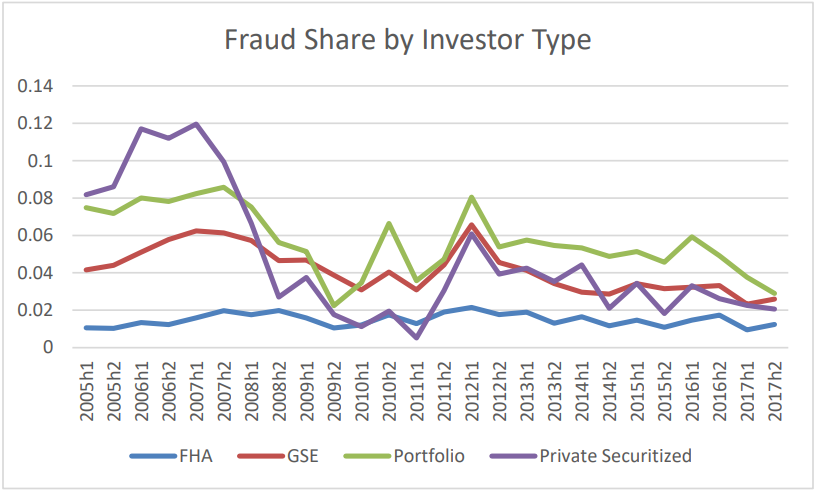
The 2020 to 2025 time period is going to make for a rather unique data set, given:
From the beginning of 2005 through the first half of 2018 there was an average of 777,530 mortgage loans per month, with an average monthly loan value of $169,381,611,572. This meant the average loan amount was $217,845.76. A table of month by month data is included below.
| Month | Adjusted Volume | Unadjusted Volume | YoY △ Volume | % △ | Adjusted Value | Unadjusted Value | YoY △ Value | % △ |
|---|---|---|---|---|---|---|---|---|
| 2005-01 | 1,281,158 | 1,017,936 | $238,627,044,783 | $196,761,502,824 | ||||
| 2005-02 | 1,280,894 | 1,095,816 | $248,193,268,178 | $215,667,486,132 | ||||
| 2005-03 | 1,282,214 | 1,416,168 | $253,514,350,079 | $280,554,378,192 | ||||
| 2005-04 | 1,223,548 | 1,263,120 | $243,277,319,357 | $245,770,203,528 | ||||
| 2005-05 | 1,235,724 | 1,348,308 | $252,902,818,745 | $269,408,141,208 | ||||
| 2005-06 | 1,318,309 | 1,496,796 | $271,526,023,215 | $305,152,263,588 | ||||
| 2005-07 | 1,471,048 | 1,470,672 | $318,457,231,361 | $305,682,507,036 | ||||
| 2005-08 | 1,488,667 | 1,623,636 | $310,072,601,516 | $331,522,211,520 | ||||
| 2005-09 | 1,468,924 | 1,432,776 | $301,349,593,479 | $294,623,540,424 | ||||
| 2005-10 | 1,378,905 | 1,332,420 | $284,143,914,105 | $275,135,069,556 | ||||
| 2005-11 | 1,289,618 | 1,224,900 | $264,414,682,054 | $254,750,693,304 | ||||
| 2005-12 | 1,195,979 | 1,175,568 | $234,058,926,420 | $242,707,629,624 | ||||
| 2006-01 | 1,149,123 | 946,500 | -71,436 | -7.02% | $226,194,698,126 | $194,641,074,240 | -$2,120,428,584 | -1.08% |
| 2006-02 | 1,131,723 | 969,804 | -126,012 | -11.50% | $228,057,706,016 | $198,581,615,196 | -$17,085,870,936 | -7.92% |
| 2006-03 | 1,130,727 | 1,248,036 | -168,132 | -11.87% | $236,420,426,412 | $260,847,131,280 | -$19,707,246,912 | -7.02% |
| 2006-04 | 1,112,533 | 1,112,772 | -150,348 | -11.90% | $239,652,474,939 | $233,698,999,776 | -$12,071,203,752 | -4.91% |
| 2006-05 | 1,120,747 | 1,265,868 | -82,440 | -6.11% | $236,097,578,760 | $261,847,965,612 | -$7,560,175,596 | -2.81% |
| 2006-06 | 1,133,188 | 1,285,860 | -210,936 | -14.09% | $241,004,603,476 | $269,956,255,404 | -$35,196,008,184 | -11.53% |
| 2006-07 | 1,121,287 | 1,115,424 | -355,248 | -24.16% | $244,873,782,074 | $233,856,736,896 | -$71,825,770,140 | -23.50% |
| 2006-08 | 1,167,737 | 1,262,040 | -361,596 | -22.27% | $249,403,761,099 | $264,680,261,976 | -$66,841,949,544 | -20.16% |
| 2006-09 | 1,196,228 | 1,123,452 | -309,324 | -21.59% | $253,447,936,423 | $237,322,395,876 | -$57,301,144,548 | -19.45% |
| 2006-10 | 1,173,376 | 1,178,988 | -153,432 | -11.52% | $250,978,098,097 | $253,335,626,448 | -$21,799,443,108 | -7.92% |
| 2006-11 | 1,150,339 | 1,104,180 | -120,720 | -9.86% | $246,063,445,215 | $240,218,610,612 | -$14,532,082,692 | -5.70% |
| 2006-12 | 1,167,208 | 1,118,628 | -56,940 | -4.84% | $253,815,607,747 | $255,472,276,512 | $12,764,646,888 | 5.26% |
| 2007-01 | 1,151,864 | 990,204 | 43,704 | 4.62% | $247,207,733,578 | $223,663,325,064 | $29,022,250,824 | 14.91% |
| 2007-02 | 1,069,877 | 914,340 | -55,464 | -5.72% | $233,585,228,234 | $202,854,502,092 | $4,272,886,896 | 2.15% |
| 2007-03 | 1,007,876 | 1,069,860 | -178,176 | -14.28% | $226,095,606,503 | $238,424,124,480 | -$22,423,006,800 | -8.60% |
| 2007-04 | 982,239 | 1,016,976 | -95,796 | -8.61% | $219,863,613,290 | $221,947,664,688 | -$11,751,335,088 | -5.03% |
| 2007-05 | 953,998 | 1,071,204 | -194,664 | -15.38% | $210,870,937,269 | $233,401,148,556 | -$28,446,817,056 | -10.86% |
| 2007-06 | 914,054 | 997,428 | -288,432 | -22.43% | $202,282,623,094 | $216,599,853,816 | -$53,356,401,588 | -19.76% |
| 2007-07 | 876,504 | 892,824 | -222,600 | -19.96% | $192,897,623,632 | $188,966,780,352 | -$44,889,956,544 | -19.20% |
| 2007-08 | 814,031 | 867,396 | -394,644 | -31.27% | $170,104,756,400 | $178,678,906,536 | -$86,001,355,440 | -32.49% |
| 2007-09 | 726,672 | 659,340 | -464,112 | -41.31% | $146,383,755,698 | $131,805,627,720 | -$105,516,768,156 | -44.46% |
| 2007-10 | 702,970 | 740,052 | -438,936 | -37.23% | $141,939,609,119 | $150,490,790,568 | -$102,844,835,880 | -40.60% |
| 2007-11 | 686,147 | 673,116 | -431,064 | -39.04% | $135,377,477,442 | $135,351,087,648 | -$104,867,522,964 | -43.66% |
| 2007-12 | 691,727 | 675,672 | -442,956 | -39.60% | $138,122,515,776 | $141,374,326,152 | -$114,097,950,360 | -44.66% |
| 2008-01 | 703,383 | 615,900 | -374,304 | -37.80% | $136,330,834,018 | $125,872,307,232 | -$97,791,017,832 | -43.72% |
| 2008-02 | 959,197 | 849,888 | -64,452 | -7.05% | $202,424,793,296 | $182,121,415,548 | -$20,733,086,544 | -10.22% |
| 2008-03 | 812,620 | 821,808 | -248,052 | -23.19% | $174,136,895,035 | $173,797,579,692 | -$64,626,544,788 | -27.11% |
| 2008-04 | 767,458 | 814,644 | -202,332 | -19.90% | $158,985,704,448 | $164,421,177,024 | -$57,526,487,664 | -25.92% |
| 2008-05 | 678,065 | 723,720 | -347,484 | -32.44% | $143,194,849,471 | $151,034,550,888 | -$82,366,597,668 | -35.29% |
| 2008-06 | 612,395 | 661,356 | -336,072 | -33.69% | $126,538,285,966 | $133,753,698,312 | -$82,846,155,504 | -38.25% |
| 2008-07 | 570,163 | 596,604 | -296,220 | -33.18% | $114,263,986,334 | $115,382,960,928 | -$73,583,819,424 | -38.94% |
| 2008-08 | 553,502 | 544,344 | -323,052 | -37.24% | $108,917,140,147 | $105,507,200,352 | -$73,171,706,184 | -40.95% |
| 2008-09 | 536,953 | 525,600 | -133,740 | -20.28% | $102,283,066,217 | $99,700,520,268 | -$32,105,107,452 | -24.36% |
| 2008-10 | 517,251 | 555,072 | -184,980 | -25.00% | $100,894,684,707 | $109,182,348,600 | -$41,308,441,968 | -27.45% |
| 2008-11 | 403,956 | 381,816 | -291,300 | -43.28% | $75,952,602,620 | $73,032,127,152 | -$62,318,960,496 | -46.04% |
| 2008-12 | 495,941 | 528,696 | -146,976 | -21.75% | $95,925,261,855 | $107,144,108,592 | -$34,230,217,560 | -24.21% |
| 2009-01 | 837,702 | 721,584 | 105,684 | 17.16% | $167,416,797,870 | $151,442,723,712 | $25,570,416,480 | 20.31% |
| 2009-02 | 1,006,731 | 846,840 | -3,048 | -0.36% | $205,435,983,323 | $175,057,337,508 | -$7,064,078,040 | -3.88% |
| 2009-03 | 898,112 | 922,416 | 100,608 | 12.24% | $188,470,902,234 | $190,436,034,432 | $16,638,454,740 | 9.57% |
| 2009-04 | 924,986 | 964,728 | 150,084 | 18.42% | $197,771,791,171 | $200,421,645,312 | $36,000,468,288 | 21.90% |
| 2009-05 | 1,014,247 | 1,019,328 | 295,608 | 40.85% | $212,957,073,589 | $211,443,199,320 | $60,408,648,432 | 40.00% |
| 2009-06 | 916,083 | 1,006,416 | 345,060 | 52.17% | $190,821,406,247 | $205,886,014,608 | $72,132,316,296 | 53.93% |
| 2009-07 | 816,031 | 849,312 | 252,708 | 42.36% | $171,755,252,456 | $173,197,364,496 | $57,814,403,568 | 50.11% |
| 2009-08 | 672,001 | 659,640 | 115,296 | 21.18% | $134,646,325,842 | $131,018,547,552 | $25,511,347,200 | 24.18% |
| 2009-09 | 626,554 | 625,680 | 100,080 | 19.04% | $123,749,004,802 | $122,899,601,232 | $23,199,080,964 | 23.27% |
| 2009-10 | 659,895 | 698,796 | 143,724 | 25.89% | $132,042,594,161 | $140,983,667,160 | $31,801,318,560 | 29.13% |
| 2009-11 | 689,684 | 692,208 | 310,392 | 81.29% | $135,599,218,224 | $138,924,686,808 | $65,892,559,656 | 90.22% |
| 2009-12 | 623,956 | 675,792 | 147,096 | 27.82% | $125,580,507,572 | $141,593,282,664 | $34,449,174,072 | 32.15% |
| 2010-01 | 595,589 | 502,968 | -218,616 | -30.30% | $120,362,541,655 | $105,595,703,112 | -$45,847,020,600 | -30.27% |
| 2010-02 | 546,302 | 455,952 | -390,888 | -46.16% | $111,245,276,236 | $93,707,604,528 | -$81,349,732,980 | -46.47% |
| 2010-03 | 576,425 | 598,776 | -323,640 | -35.09% | $117,833,680,238 | $120,317,644,584 | -$70,118,389,848 | -36.82% |
| 2010-04 | 594,800 | 604,848 | -359,880 | -37.30% | $120,385,907,564 | $118,831,146,552 | -$81,590,498,760 | -40.71% |
| 2010-05 | 571,906 | 560,304 | -459,024 | -45.03% | $113,357,060,189 | $110,129,775,816 | -$101,313,423,504 | -47.92% |
| 2010-06 | 632,251 | 687,552 | -318,864 | -31.68% | $131,707,762,064 | $141,246,213,816 | -$64,639,800,792 | -31.40% |
| 2010-07 | 609,578 | 617,520 | -231,792 | -27.29% | $133,758,736,406 | $131,988,908,160 | -$41,208,456,336 | -23.79% |
| 2010-08 | 758,400 | 778,272 | 118,632 | 17.98% | $163,217,817,404 | $167,331,849,768 | $36,313,302,216 | 27.72% |
| 2010-09 | 826,625 | 841,272 | 215,592 | 34.46% | $178,213,376,713 | $180,158,508,024 | $57,258,906,792 | 46.59% |
| 2010-10 | 835,664 | 867,288 | 168,492 | 24.11% | $177,245,843,175 | $184,751,695,536 | $43,768,028,376 | 31.04% |
| 2010-11 | 819,732 | 862,728 | 170,520 | 24.63% | $171,111,507,349 | $184,415,282,664 | $45,490,595,856 | 32.74% |
| 2010-12 | 778,057 | 846,600 | 170,808 | 25.28% | $162,033,064,987 | $182,395,042,464 | $40,801,759,800 | 28.82% |
| 2011-01 | 718,068 | 606,672 | 103,704 | 20.62% | $148,770,287,615 | $128,983,106,640 | $23,387,403,528 | 22.15% |
| 2011-02 | 586,970 | 485,712 | 29,760 | 6.53% | $119,478,968,596 | $99,311,868,984 | $5,604,264,456 | 5.98% |
| 2011-03 | 511,314 | 523,392 | -75,384 | -12.59% | $104,277,514,690 | $104,959,566,024 | -$15,358,078,560 | -12.76% |
| 2011-04 | 491,004 | 473,472 | -131,376 | -21.72% | $99,020,303,826 | $92,701,833,384 | -$26,129,313,168 | -21.99% |
| 2011-05 | 483,158 | 481,680 | -78,624 | -14.03% | $96,655,768,380 | $95,824,542,288 | -$14,305,233,528 | -12.99% |
| 2011-06 | 505,096 | 548,088 | -139,464 | -20.28% | $102,570,766,397 | $110,727,858,936 | -$30,518,354,880 | -21.61% |
| 2011-07 | 541,642 | 537,384 | -80,136 | -12.98% | $113,242,085,319 | $110,225,459,520 | -$21,763,448,640 | -16.49% |
| 2011-08 | 564,733 | 612,624 | -165,648 | -21.28% | $114,911,515,406 | $125,317,722,192 | -$42,014,127,576 | -25.11% |
| 2011-09 | 666,145 | 689,280 | -151,992 | -18.07% | $146,576,795,284 | $150,486,135,432 | -$29,672,372,592 | -16.47% |
| 2011-10 | 726,581 | 755,592 | -111,696 | -12.88% | $153,907,406,097 | $159,973,263,840 | -$24,778,431,696 | -13.41% |
| 2011-11 | 702,730 | 735,504 | -127,224 | -14.75% | $149,536,144,883 | $159,659,811,240 | -$24,755,471,424 | -13.42% |
| 2011-12 | 698,915 | 729,624 | -116,976 | -13.82% | $144,252,598,036 | $155,033,682,360 | -$27,361,360,104 | -15.00% |
| 2012-01 | 736,741 | 638,304 | 31,632 | 5.21% | $153,376,345,095 | $134,968,725,240 | $5,985,618,600 | 4.64% |
| 2012-02 | 832,969 | 713,520 | 227,808 | 46.90% | $179,161,641,983 | $153,355,736,352 | $54,043,867,368 | 54.42% |
| 2012-03 | 827,858 | 811,152 | 287,760 | 54.98% | $176,172,108,828 | $169,990,398,192 | $65,030,832,168 | 61.96% |
| 2012-04 | 792,206 | 758,184 | 284,712 | 60.13% | $169,989,131,177 | $158,675,647,704 | $65,973,814,320 | 71.17% |
| 2012-05 | 779,656 | 807,384 | 325,704 | 67.62% | $162,968,079,514 | $168,526,233,648 | $72,701,691,360 | 75.87% |
| 2012-06 | 779,764 | 827,688 | 279,600 | 51.01% | $165,563,335,084 | $175,922,272,296 | $65,194,413,360 | 58.88% |
| 2012-07 | 820,543 | 857,856 | 320,472 | 59.64% | $178,031,259,106 | $185,149,702,368 | $74,924,242,848 | 67.97% |
| 2012-08 | 896,158 | 992,808 | 380,184 | 62.06% | $192,253,446,237 | $213,807,067,056 | $88,489,344,864 | 70.61% |
| 2012-09 | 889,955 | 867,792 | 178,512 | 25.90% | $191,474,069,039 | $184,110,814,032 | $33,624,678,600 | 22.34% |
| 2012-10 | 918,389 | 1,010,976 | 255,384 | 33.80% | $195,217,377,094 | $214,346,229,024 | $54,372,965,184 | 33.99% |
| 2012-11 | 926,657 | 952,056 | 216,552 | 29.44% | $196,471,772,962 | $204,762,065,328 | $45,102,254,088 | 28.25% |
| 2012-12 | 971,148 | 961,464 | 231,840 | 31.78% | $207,834,468,782 | $211,299,499,776 | $56,265,817,416 | 36.29% |
| 2013-01 | 1,043,673 | 913,008 | 274,704 | 43.04% | $222,991,955,446 | $196,722,199,848 | $61,753,474,608 | 45.75% |
| 2013-02 | 1,031,121 | 836,832 | 123,312 | 17.28% | $220,563,470,462 | $178,005,071,400 | $24,649,335,048 | 16.07% |
| 2013-03 | 951,052 | 903,648 | 92,496 | 11.40% | $202,937,271,913 | $190,516,848,528 | $20,526,450,336 | 12.08% |
| 2013-04 | 919,983 | 918,144 | 159,960 | 21.10% | $196,183,534,899 | $192,283,552,584 | $33,607,904,880 | 21.18% |
| 2013-05 | 903,755 | 953,928 | 146,544 | 18.15% | $195,277,402,041 | $205,868,324,688 | $37,342,091,040 | 22.16% |
| 2013-06 | 852,285 | 888,432 | 60,744 | 7.34% | $183,322,004,079 | $192,212,349,216 | $16,290,076,920 | 9.26% |
| 2013-07 | 779,709 | 854,280 | -3,576 | -0.42% | $166,187,376,667 | $183,055,858,080 | -$2,093,844,288 | -1.13% |
| 2013-08 | 687,785 | 751,464 | -241,344 | -24.31% | $145,154,515,292 | $158,538,169,128 | -$55,268,897,928 | -25.85% |
| 2013-09 | 577,329 | 583,716 | -284,076 | -32.74% | $119,345,731,286 | $119,230,469,112 | -$64,880,344,920 | -35.24% |
| 2013-10 | 511,377 | 555,504 | -455,472 | -45.05% | $106,934,062,595 | $115,210,446,408 | -$99,135,782,616 | -46.25% |
| 2013-11 | 503,615 | 488,376 | -463,680 | -48.70% | $103,282,524,115 | $100,663,997,856 | -$104,098,067,472 | -50.84% |
| 2013-12 | 490,321 | 492,408 | -469,056 | -48.79% | $102,528,401,500 | $106,046,900,952 | -$105,252,598,824 | -49.81% |
| 2014-01 | 452,960 | 384,576 | -528,432 | -57.88% | $94,142,743,663 | $80,103,742,536 | -$116,618,457,312 | -59.28% |
| 2014-02 | 449,218 | 359,208 | -477,624 | -57.08% | $93,330,400,771 | $73,926,369,840 | -$104,078,701,560 | -58.47% |
| 2014-03 | 471,401 | 448,584 | -455,064 | -50.36% | $100,130,709,009 | $94,593,960,936 | -$95,922,887,592 | -50.35% |
| 2014-04 | 479,193 | 484,632 | -433,512 | -47.22% | $103,275,116,188 | $102,858,765,312 | -$89,424,787,272 | -46.51% |
| 2014-05 | 494,612 | 518,712 | -435,216 | -45.62% | $106,066,907,912 | $111,187,869,456 | -$94,680,455,232 | -45.99% |
| 2014-06 | 512,660 | 564,240 | -324,192 | -36.49% | $113,628,106,430 | $126,466,164,576 | -$65,746,184,640 | -34.20% |
| 2014-07 | 523,509 | 579,552 | -274,728 | -32.16% | $116,469,827,545 | $130,204,831,632 | -$52,851,026,448 | -28.87% |
| 2014-08 | 521,497 | 556,632 | -194,832 | -25.93% | $115,540,304,014 | $122,876,383,968 | -$35,661,785,160 | -22.49% |
| 2014-09 | 518,611 | 541,536 | -42,180 | -7.23% | $115,377,738,473 | $119,292,723,456 | $62,254,344 | 0.05% |
| 2014-10 | 523,060 | 563,256 | 7,752 | 1.40% | $118,788,454,873 | $126,475,939,320 | $11,265,492,912 | 9.78% |
| 2014-11 | 542,221 | 499,944 | 11,568 | 2.37% | $126,571,413,874 | $116,569,418,904 | $15,905,421,048 | 15.80% |
| 2014-12 | 560,795 | 576,288 | 83,880 | 17.03% | $127,759,880,122 | $135,507,485,880 | $29,460,584,928 | 27.78% |
| 2015-01 | 573,712 | 455,304 | 70,728 | 18.39% | $135,443,234,308 | $106,997,148,648 | $26,893,406,112 | 33.57% |
| 2015-02 | 723,502 | 564,984 | 205,776 | 57.29% | $180,306,289,623 | $139,061,791,848 | $65,135,422,008 | 88.11% |
| 2015-03 | 761,873 | 750,504 | 301,920 | 67.31% | $186,738,785,713 | $183,732,125,904 | $89,138,164,968 | 94.23% |
| 2015-04 | 701,777 | 715,896 | 231,264 | 47.72% | $169,471,294,211 | $170,275,881,756 | $67,417,116,444 | 65.54% |
| 2015-05 | 685,557 | 710,760 | 192,048 | 37.02% | $168,573,248,072 | $174,354,364,896 | $63,166,495,440 | 56.81% |
| 2015-06 | 665,206 | 769,848 | 205,608 | 36.44% | $158,148,791,521 | $185,726,552,952 | $59,260,388,376 | 46.86% |
| 2015-07 | 642,337 | 714,072 | 134,520 | 23.21% | $150,839,105,550 | $169,472,824,008 | $39,267,992,376 | 30.16% |
| 2015-08 | 615,099 | 660,264 | 103,632 | 18.62% | $143,652,817,028 | $153,842,342,736 | $30,965,958,768 | 25.20% |
| 2015-09 | 615,390 | 645,384 | 103,848 | 19.18% | $144,315,290,755 | $150,107,587,200 | $30,814,863,744 | 25.83% |
| 2015-10 | 594,250 | 619,728 | 56,472 | 10.03% | $138,826,931,932 | $143,054,735,016 | $16,578,795,696 | 13.11% |
| 2015-11 | 535,713 | 507,504 | 7,560 | 1.51% | $128,191,780,935 | $121,394,348,664 | $4,824,929,760 | 4.14% |
| 2015-12 | 588,391 | 603,936 | 27,648 | 4.80% | $137,706,589,495 | $145,568,986,416 | $10,061,500,536 | 7.43% |
| 2016-01 | 615,194 | 460,104 | 4,800 | 1.05% | $146,186,355,585 | $108,442,782,768 | $1,445,634,120 | 1.35% |
| 2016-02 | 632,417 | 503,736 | -61,248 | -10.84% | $152,737,723,265 | $120,028,548,840 | -$19,033,243,008 | -13.69% |
| 2016-03 | 681,647 | 687,576 | -62,928 | -8.38% | $170,640,001,297 | $172,214,838,288 | -$11,517,287,616 | -6.27% |
| 2016-04 | 708,096 | 696,888 | -19,008 | -2.66% | $178,538,706,468 | $172,312,415,880 | $2,036,534,124 | 1.20% |
| 2016-05 | 694,673 | 755,304 | 44,544 | 6.27% | $172,509,009,739 | $187,384,193,880 | $13,029,828,984 | 7.47% |
| 2016-06 | 693,987 | 812,928 | 43,080 | 5.60% | $173,039,990,841 | $205,450,309,608 | $19,723,756,656 | 10.62% |
| 2016-07 | 710,630 | 740,700 | 26,628 | 3.73% | $178,200,764,981 | $187,110,659,424 | $17,637,835,416 | 10.41% |
| 2016-08 | 769,709 | 884,004 | 223,740 | 33.89% | $194,882,390,293 | $224,755,928,904 | $70,913,586,168 | 46.09% |
| 2016-09 | 786,192 | 833,304 | 187,920 | 29.12% | $202,289,895,752 | $213,039,629,928 | $62,932,042,728 | 41.92% |
| 2016-10 | 792,565 | 805,440 | 185,712 | 29.97% | $202,126,386,292 | $203,698,159,440 | $60,643,424,424 | 42.39% |
| 2016-11 | 772,530 | 759,720 | 252,216 | 49.70% | $194,987,082,562 | $192,297,516,048 | $70,903,167,384 | 58.41% |
| 2016-12 | 757,038 | 753,444 | 149,508 | 24.76% | $186,725,525,500 | $190,091,980,080 | $44,522,993,664 | 30.59% |
| 2017-01 | 673,062 | 510,204 | 50,100 | 10.89% | $165,022,039,798 | $124,282,806,120 | $15,840,023,352 | 14.61% |
| 2017-02 | 639,262 | 477,492 | -26,244 | -5.21% | $155,703,590,850 | $114,622,176,480 | -$5,406,372,360 | -4.50% |
| 2017-03 | 605,456 | 604,176 | -83,400 | -12.13% | $146,371,105,419 | $145,863,368,136 | -$26,351,470,152 | -15.30% |
| 2017-04 | 603,542 | 568,836 | -128,052 | -18.37% | $149,295,357,133 | $137,318,424,648 | -$34,993,991,232 | -20.31% |
| 2017-05 | 602,100 | 681,312 | -73,992 | -9.80% | $149,756,530,754 | $169,074,340,320 | -$18,309,853,560 | -9.77% |
| 2017-06 | 611,852 | 720,840 | -92,088 | -11.33% | $154,551,698,685 | $184,180,649,616 | -$21,269,659,992 | -10.35% |
| 2017-07 | 620,493 | 646,440 | -94,260 | -12.73% | $155,569,901,432 | $163,721,542,632 | -$23,389,116,792 | -12.50% |
| 2017-08 | 612,229 | 704,616 | -179,388 | -20.29% | $155,389,378,831 | $179,928,710,148 | -$44,827,218,756 | -19.94% |
| 2017-09 | 618,809 | 640,531 | -192,773 | -23.13% | $156,136,210,852 | $160,563,357,249 | -$52,476,272,679 | -24.63% |
| 2017-10 | 621,369 | 659,708 | -145,732 | -18.09% | $158,810,487,990 | $168,574,243,717 | -$35,123,915,723 | -17.24% |
| 2017-11 | 623,644 | 616,647 | -143,073 | -18.83% | $157,633,782,207 | $156,600,194,316 | -$35,697,321,732 | -18.56% |
| 2017-12 | 635,625 | 614,859 | -138,585 | -18.39% | $163,015,398,556 | $160,193,242,401 | -$29,898,737,679 | -15.73% |
| 2018-01 | 630,595 | 489,369 | -20,835 | -4.08% | $161,077,467,787 | $124,552,365,911 | $269,559,791 | 0.22% |
| 2018-02 | 639,531 | 472,343 | -5,149 | -1.08% | $165,163,255,394 | $120,288,148,981 | $5,665,972,501 | 4.94% |
| 2018-03 | 610,927 | 581,801 | -22,375 | -3.70% | $156,915,635,090 | $148,308,232,337 | $2,444,864,201 | 1.68% |
| 2018-04 | 642,278 | 619,139 | 50,303 | 8.84% | $168,319,181,738 | $158,372,174,782 | $21,053,750,134 | 15.33% |
| 2018-05 | 712,381 | 807,738 | 126,426 | 18.56% | $186,815,740,628 | $210,701,416,450 | $41,627,076,130 | 24.62% |
| 2018-06 | 710,801 | 813,034 | 92,194 | 12.79% | $186,331,437,741 | $214,846,752,979 | $30,666,103,363 | 16.65% |
| 2018-07 | 683,864 | 738,388 | 91,948 | 14.22% | $183,155,138,468 | $200,728,523,741 | $37,006,981,109 | 22.60% |
The following tables show the average loan value by ethnicity for home purchases and refinances. All figures are in thousands of nominal dollars unless otherwise stated.
Home Purchase
| Borrower | 2004 | 2005 | 2006 | 2007 | 2008 | 2009 | 2010 | 2011 | 2012 | 2013 | 2014 | 2015 | 2016 | 2017 |
|---|---|---|---|---|---|---|---|---|---|---|---|---|---|---|
| Asian | $280 | $316 | $326 | $334 | $299 | $276 | $293 | $291 | $304 | $328 | $344 | $360 | $373 | $390 |
| African American | $166 | $183 | $197 | $197 | $184 | $172 | $174 | $174 | $179 | $193 | $199 | $209 | $217 | $224 |
| Hispanic white | $189 | $224 | $238 | $220 | $186 | $168 | $168 | $168 | $176 | $190 | $198 | $209 | $220 | $230 |
| Non-Hispanic white | $193 | $211 | $216 | $222 | $209 | $195 | $204 | $204 | $213 | $226 | $231 | $239 | $246 | $254 |
| Other minority | $206 | $240 | $257 | $245 | $216 | $196 | $201 | $198 | $206 | $219 | $229 | $241 | $249 | $257 |
| Joint | $233 | $255 | $261 | $269 | $255 | $248 | $263 | $261 | $274 | $289 | $293 | $302 | $311 | $322 |
| Missing race | $216 | $248 | $261 | $280 | $265 | $242 | $256 | $262 | $279 | $298 | $293 | $303 | $308 | $317 |
| Low or moderate income | $114 | $116 | $117 | $124 | $128 | $129 | $128 | $125 | $131 | $132 | $132 | $141 | $146 | $152 |
| Middle income | $165 | $170 | $170 | $176 | $182 | $187 | $189 | $184 | $192 | $194 | $193 | $204 | $209 | $217 |
| High income | $281 | $306 | $313 | $317 | $298 | $291 | $303 | $302 | $313 | $323 | $328 | $341 | $345 | $359 |
| Income not used or N/A | $208 | $235 | $254 | $257 | $211 | $189 | $204 | $221 | $231 | $258 | $275 | $292 | $312 | $332 |
| Low or moderate income neighborhood | $159 | $180 | $189 | $188 | $175 | $160 | $164 | $163 | $158 | $171 | $178 | $188 | $199 | $204 |
| Middle income neighborhood | $172 | $190 | $197 | $196 | $186 | $174 | $177 | $173 | $178 | $191 | $196 | $206 | $216 | $224 |
| High income neighborhood | $258 | $284 | $294 | $301 | $277 | $257 | $270 | $271 | $282 | $300 | $306 | $316 | $324 | $340 |
| All loans | $201 | $221 | $228 | $232 | $217 | $202 | $210 | $210 | $221 | $235 | $240 | $249 | $257 | $267 |
| Conventional jumbo loans (% of originations) | 11.2% | 12.7% | 9.4% | 6.8% | 2.3% | 1.3% | 1.7% | 2.2% | 3.0% | 4.0% | 4.8% | 5.3% | 5.2% | 5.5% |
| Conventional jumbo loans (% of loaned dollars) | 29.4% | 32.5% | 26.8% | 21.8% | 10.1% | 6.2% | 7.5% | 9.5% | 12.0% | 14.6% | 16.5% | 17.3% | 16.9% | 17.6% |
Refinance
| Borrower | 2004 | 2005 | 2006 | 2007 | 2008 | 2009 | 2010 | 2011 | 2012 | 2013 | 2014 | 2015 | 2016 | 2017 |
|---|---|---|---|---|---|---|---|---|---|---|---|---|---|---|
| Asian | $274 | $325 | $370 | $368 | $321 | $298 | $313 | $309 | $308 | $304 | $341 | $363 | $368 | $368 |
| African American | $151 | $180 | $199 | $192 | $173 | $184 | $180 | $174 | $181 | $171 | $174 | $199 | $212 | $213 |
| Hispanic white | $178 | $219 | $252 | $244 | $193 | $190 | $191 | $183 | $190 | $180 | $190 | $214 | $228 | $223 |
| Non-Hispanic white | $180 | $205 | $221 | $222 | $205 | $209 | $210 | $208 | $212 | $206 | $216 | $239 | $251 | $238 |
| Other minority | $190 | $229 | $269 | $258 | $211 | $217 | $218 | $207 | $213 | $201 | $213 | $240 | $252 | $245 |
| Joint | $210 | $246 | $265 | $262 | $243 | $247 | $254 | $249 | $254 | $249 | $266 | $292 | $304 | $290 |
| Missing race | $194 | $226 | $246 | $250 | $242 | $243 | $248 | $253 | $253 | $244 | $245 | $268 | $277 | $259 |
| Low or moderate income | $114 | $124 | $124 | $126 | $129 | $138 | $133 | $128 | $135 | $128 | $123 | $136 | $143 | $143 |
| Middle income | $162 | $181 | $183 | $181 | $180 | $185 | $180 | $174 | $182 | $171 | $174 | $193 | $202 | $200 |
| High income | $256 | $294 | $320 | $312 | $276 | $268 | $274 | $281 | $277 | $276 | $301 | $324 | $330 | $329 |
| Income not used or N/A | $150 | $178 | $240 | $236 | $192 | $203 | $202 | $185 | $211 | $193 | $198 | $229 | $243 | $225 |
| Low or moderate income neighborhood | $142 | $169 | $188 | $185 | $164 | $173 | $173 | $167 | $163 | $153 | $157 | $182 | $196 | $185 |
| Middle income neighborhood | $158 | $184 | $201 | $198 | $182 | $184 | $182 | $175 | $181 | $173 | $180 | $201 | $214 | $204 |
| High income neighborhood | $245 | $282 | $313 | $311 | $272 | $259 | $265 | $269 | $269 | $270 | $290 | $311 | $321 | $316 |
| All loans | $185 | $212 | $232 | $231 | $212 | $216 | $220 | $218 | $221 | $213 | $222 | $247 | $259 | $246 |
| Conventional jumbo loans (% of originations) | 9.2% | 11.4% | 10.2% | 7.5% | 2.0% | 0.9% | 1.6% | 2.4% | 2.2% | 3.0% | 4.2% | 4.9% | 4.6% | 4.3% |
| Conventional jumbo loans (% of loaned dollars) | 25.8% | 29.6% | 28.3% | 23.0% | 9.0% | 4.1% | 6.9% | 10.7% | 9.2% | 12.7% | 16.5% | 16.8% | 15.7% | 16.4% |
The following table lists monthly application and loan origination volume data dating back to 2004, with all figures in millions of dollars.
| Characteristic of loan and property (1-4 units, with the exception of multi-family) | Purchase: Applications | Purchase: Originations | Purchase: First lien, owner occupied originations | Purchase: First lien, owner occupied, site-built, conventional originations | Purchase: First lien, owner occupied, site-built, nonconventional originations | Purchase: First lien, owner occupied, manufactured, conventional originations | Refinance: applications | Refinance: originations | Refinance: First lien, owner occupied originations | Refinance: First lien, owner occupied, site-built, conventional originations | Refinance: First lien, owner occupied, site-built, nonconventional originations | Refinance: First lien, owner occupied, manufactured, conventional originations | Refinance: First lien, owner occupied, manufactured, nonconventional originations | Refinance: First lien, non-owner occupied originations | Refinance: Junior lien, owner occupied originations | Refinance: Junior lien, non-owner occupied originations | Home improvement: Applications | Home improvement: Originations | Multifamily: Applications | Multifamily: Originations | Total: Applications | Total: Originations |
|---|---|---|---|---|---|---|---|---|---|---|---|---|---|---|---|---|---|---|---|---|---|---|
| Jan 2004 | $91 | $57 | $48 | $43 | $5 | $0 | $175 | $79 | $71 | $67 | $3 | $0 | $0 | $7 | $1 | $0 | $8 | $4 | $4 | $3 | $278 | $143 |
| Feb 2004 | $94 | $62 | $52 | $46 | $5 | $0 | $202 | $107 | $98 | $93 | $4 | $0 | $0 | $8 | $2 | $0 | $10 | $5 | $4 | $4 | $311 | $177 |
| Mar 2004 | $129 | $87 | $74 | $66 | $7 | $1 | $268 | $151 | $138 | $132 | $6 | $1 | $0 | $10 | $2 | $0 | $13 | $6 | $6 | $5 | $416 | $248 |
| Apr 2004 | $138 | $97 | $81 | $73 | $7 | $1 | $290 | $178 | $164 | $158 | $6 | $1 | $0 | $11 | $2 | $0 | $13 | $7 | $6 | $5 | $446 | $286 |
| May 2004 | $145 | $101 | $85 | $77 | $7 | $1 | $234 | $129 | $117 | $113 | $3 | $0 | $0 | $9 | $2 | $0 | $13 | $7 | $6 | $5 | $398 | $242 |
| June 2004 | $174 | $121 | $103 | $95 | $7 | $1 | $210 | $102 | $92 | $89 | $2 | $0 | $0 | $8 | $2 | $0 | $13 | $7 | $7 | $6 | $405 | $236 |
| July 2004 | $164 | $110 | $93 | $86 | $7 | $1 | $185 | $78 | $69 | $67 | $1 | $0 | $0 | $7 | $2 | $0 | $12 | $6 | $6 | $5 | $368 | $199 |
| Aug 2004 | $164 | $108 | $91 | $84 | $6 | $1 | $195 | $86 | $77 | $75 | $2 | $0 | $0 | $7 | $2 | $0 | $13 | $6 | $6 | $5 | $378 | $205 |
| Sept 2004 | $149 | $98 | $82 | $75 | $5 | $1 | $193 | $88 | $79 | $77 | $2 | $0 | $0 | $7 | $2 | $0 | $12 | $6 | $6 | $5 | $360 | $196 |
| Oct 2004 | $146 | $95 | $79 | $73 | $5 | $1 | $209 | $99 | $89 | $87 | $2 | $0 | $0 | $7 | $2 | $0 | $13 | $7 | $6 | $5 | $374 | $205 |
| Nov 2004 | $140 | $92 | $76 | $71 | $5 | $0 | $219 | $109 | $99 | $96 | $2 | $0 | $0 | $8 | $2 | $0 | $13 | $7 | $6 | $5 | $378 | $213 |
| Dec 2004 | $149 | $98 | $80 | $75 | $5 | $0 | $225 | $108 | $97 | $95 | $2 | $0 | $0 | $9 | $2 | $0 | $13 | $7 | $8 | $7 | $395 | $220 |
| Jan 2005 | $116 | $71 | $57 | $53 | $3 | $0 | $196 | $88 | $79 | $76 | $2 | $0 | $0 | $7 | $2 | $0 | $15 | $6 | $5 | $4 | $332 | $169 |
| Feb 2005 | $118 | $75 | $61 | $56 | $4 | $0 | $201 | $94 | $85 | $82 | $2 | $0 | $0 | $7 | $2 | $0 | $16 | $6 | $5 | $5 | $339 | $180 |
| Mar 2005 | $162 | $108 | $87 | $81 | $5 | $1 | $250 | $124 | $111 | $108 | $2 | $1 | $0 | $10 | $3 | $0 | $20 | $8 | $7 | $6 | $439 | $246 |
| Apr 2005 | $172 | $111 | $89 | $83 | $5 | $1 | $226 | $102 | $91 | $88 | $1 | $0 | $0 | $8 | $3 | $0 | $19 | $8 | $7 | $6 | $424 | $227 |
| May 2005 | $186 | $122 | $98 | $92 | $5 | $1 | $224 | $104 | $93 | $91 | $1 | $0 | $0 | $8 | $3 | $0 | $20 | $9 | $6 | $5 | $436 | $240 |
| June 2005 | $214 | $143 | $115 | $109 | $6 | $1 | $251 | $120 | $107 | $105 | $2 | $1 | $0 | $9 | $3 | $0 | $21 | $9 | $8 | $7 | $494 | $279 |
| July 2005 | $194 | $128 | $103 | $97 | $5 | $1 | $252 | $127 | $114 | $112 | $2 | $0 | $0 | $10 | $3 | $0 | $20 | $9 | $7 | $6 | $473 | $271 |
| Aug 2005 | $215 | $141 | $113 | $106 | $5 | $1 | $286 | $144 | $129 | $127 | $2 | $1 | $0 | $11 | $4 | $0 | $23 | $11 | $8 | $7 | $532 | $303 |
| Sept 2005 | $196 | $126 | $99 | $94 | $5 | $1 | $257 | $122 | $108 | $106 | $1 | $0 | $0 | $10 | $4 | $0 | $22 | $10 | $9 | $7 | $482 | $265 |
| Oct 2005 | $179 | $111 | $87 | $83 | $4 | $1 | $260 | $126 | $111 | $110 | $1 | $0 | $0 | $10 | $4 | $0 | $20 | $10 | $7 | $6 | $465 | $252 |
| Nov 2005 | $174 | $107 | $85 | $80 | $4 | $0 | $245 | $113 | $98 | $97 | $1 | $0 | $0 | $10 | $5 | $0 | $18 | $9 | $7 | $6 | $444 | $235 |
| Dec 2005 | $173 | $107 | $85 | $80 | $4 | $0 | $236 | $103 | $89 | $88 | $1 | $0 | $0 | $9 | $5 | $0 | $16 | $8 | $8 | $7 | $433 | $226 |
| Jan 2006 | $137 | $78 | $60 | $56 | $3 | $0 | $213 | $86 | $74 | $73 | $1 | $0 | $0 | $8 | $4 | $0 | $15 | $7 | $6 | $5 | $372 | $176 |
| Feb 2006 | $133 | $82 | $64 | $60 | $4 | $1 | $204 | $90 | $78 | $76 | $1 | $0 | $0 | $8 | $4 | $0 | $15 | $7 | $5 | $4 | $358 | $184 |
| Mar 2006 | $182 | $115 | $91 | $84 | $5 | $1 | $247 | $108 | $92 | $90 | $2 | $0 | $0 | $10 | $6 | $0 | $20 | $9 | $8 | $7 | $456 | $239 |
| Apr 2006 | $162 | $102 | $82 | $76 | $5 | $1 | $214 | $94 | $80 | $78 | $1 | $0 | $0 | $9 | $5 | $0 | $18 | $8 | $5 | $4 | $400 | $209 |
| May 2006 | $191 | $122 | $98 | $91 | $6 | $1 | $230 | $103 | $87 | $85 | $2 | $0 | $0 | $10 | $6 | $0 | $20 | $9 | $7 | $6 | $447 | $241 |
| June 2006 | $203 | $134 | $108 | $101 | $6 | $1 | $221 | $99 | $83 | $81 | $1 | $0 | $0 | $10 | $6 | $0 | $20 | $9 | $8 | $6 | $452 | $248 |
| July 2006 | $174 | $109 | $88 | $83 | $5 | $1 | $207 | $90 | $76 | $74 | $1 | $0 | $0 | $8 | $6 | $0 | $18 | $9 | $6 | $5 | $405 | $212 |
| Aug 2006 | $193 | $119 | $96 | $90 | $5 | $1 | $230 | $103 | $86 | $84 | $1 | $0 | $0 | $10 | $7 | $0 | $20 | $9 | $6 | $6 | $450 | $237 |
| Sept 2006 | $165 | $101 | $81 | $75 | $5 | $1 | $218 | $97 | $82 | $80 | $1 | $0 | $0 | $10 | $6 | $0 | $17 | $8 | $7 | $6 | $407 | $212 |
| Oct 2006 | $165 | $97 | $77 | $72 | $4 | $1 | $254 | $115 | $98 | $96 | $2 | $0 | $0 | $11 | $6 | $0 | $19 | $9 | $6 | $5 | $444 | $226 |
| Nov 2006 | $151 | $91 | $73 | $68 | $4 | $0 | $235 | $105 | $89 | $87 | $1 | $0 | $0 | $11 | $5 | $0 | $17 | $8 | $7 | $6 | $410 | $210 |
| Dec 2006 | $152 | $92 | $73 | $69 | $4 | $0 | $243 | $117 | $100 | $98 | $2 | $0 | $0 | $12 | $5 | $0 | $15 | $8 | $10 | $9 | $420 | $226 |
| Jan 2007 | $121 | $67 | $53 | $50 | $3 | $0 | $226 | $101 | $86 | $84 | $1 | $0 | $0 | $10 | $4 | $0 | $16 | $7 | $7 | $6 | $370 | $181 |
| Feb 2007 | $116 | $69 | $55 | $51 | $3 | $0 | $202 | $89 | $76 | $74 | $1 | $0 | $0 | $9 | $4 | $0 | $15 | $7 | $6 | $5 | $340 | $170 |
| Mar 2007 | $149 | $89 | $72 | $67 | $4 | $1 | $236 | $101 | $86 | $84 | $2 | $0 | $0 | $10 | $5 | $0 | $18 | $8 | $7 | $6 | $410 | $204 |
| Apr 2007 | $135 | $84 | $69 | $64 | $4 | $1 | $224 | $100 | $86 | $84 | $2 | $0 | $0 | $10 | $4 | $0 | $18 | $8 | $8 | $7 | $385 | $200 |
| May 2007 | $147 | $95 | $79 | $73 | $5 | $1 | $228 | $100 | $85 | $82 | $2 | $0 | $0 | $11 | $4 | $0 | $19 | $8 | $8 | $6 | $401 | $210 |
| June 2007 | $154 | $101 | $85 | $78 | $6 | $1 | $207 | $85 | $72 | $69 | $2 | $0 | $0 | $9 | $4 | $0 | $18 | $8 | $9 | $8 | $388 | $202 |
| July 2007 | $145 | $91 | $77 | $70 | $6 | $1 | $197 | $77 | $65 | $62 | $2 | $0 | $0 | $8 | $4 | $0 | $17 | $7 | $8 | $7 | $367 | $182 |
| Aug 2007 | $161 | $94 | $79 | $72 | $6 | $1 | $220 | $72 | $60 | $57 | $2 | $0 | $0 | $8 | $4 | $0 | $18 | $7 | $8 | $7 | $407 | $179 |
| Sept 2007 | $114 | $67 | $56 | $50 | $5 | $1 | $155 | $55 | $47 | $44 | $2 | $0 | $0 | $6 | $3 | $0 | $13 | $5 | $6 | $5 | $288 | $132 |
| Oct 2007 | $114 | $67 | $56 | $50 | $6 | $1 | $171 | $68 | $58 | $54 | $4 | $0 | $0 | $7 | $3 | $0 | $14 | $6 | $7 | $6 | $306 | $146 |
| Nov 2007 | $100 | $62 | $52 | $46 | $6 | $0 | $153 | $62 | $53 | $49 | $4 | $0 | $0 | $7 | $2 | $0 | $12 | $5 | $6 | $5 | $271 | $133 |
| Dec 2007 | $94 | $58 | $49 | $42 | $6 | $0 | $155 | $72 | $63 | $58 | $5 | $0 | $0 | $7 | $2 | $0 | $10 | $4 | $8 | $7 | $267 | $141 |
| Jan 2008 | $78 | $43 | $36 | $31 | $5 | $0 | $159 | $65 | $57 | $52 | $5 | $0 | $0 | $6 | $1 | $0 | $10 | $3 | $5 | $4 | $251 | $116 |
| Feb 2008 | $78 | $47 | $40 | $32 | $7 | $0 | $201 | $104 | $93 | $86 | $7 | $0 | $0 | $9 | $2 | $0 | $10 | $4 | $6 | $5 | $296 | $160 |
| Mar 2008 | $89 | $55 | $47 | $36 | $9 | $0 | $193 | $97 | $86 | $78 | $8 | $0 | $0 | $9 | $2 | $0 | $11 | $5 | $7 | $5 | $300 | $162 |
| Apr 2008 | $95 | $58 | $49 | $36 | $12 | $0 | $184 | $86 | $76 | $67 | $9 | $0 | $0 | $8 | $2 | $0 | $12 | $5 | $6 | $5 | $297 | $154 |
| May 2008 | $99 | $64 | $55 | $39 | $16 | $0 | $144 | $63 | $55 | $46 | $8 | $0 | $0 | $7 | $1 | $0 | $10 | $4 | $6 | $5 | $260 | $136 |
| June 2008 | $103 | $68 | $59 | $42 | $17 | $0 | $123 | $53 | $46 | $38 | $7 | $0 | $0 | $5 | $1 | $0 | $9 | $4 | $7 | $6 | $242 | $130 |
| July 2008 | $102 | $65 | $57 | $39 | $18 | $0 | $107 | $40 | $35 | $27 | $7 | $0 | $0 | $4 | $1 | $0 | $9 | $3 | $6 | $5 | $225 | $114 |
| Aug 2008 | $94 | $61 | $53 | $35 | $18 | $0 | $88 | $33 | $28 | $21 | $7 | $0 | $0 | $4 | $1 | $0 | $7 | $3 | $5 | $4 | $195 | $101 |
| Sept 2008 | $87 | $54 | $48 | $28 | $19 | $0 | $85 | $32 | $28 | $20 | $7 | $0 | $0 | $3 | $1 | $0 | $7 | $3 | $5 | $4 | $184 | $93 |
| Oct 2008 | $84 | $50 | $44 | $27 | $16 | $0 | $102 | $43 | $39 | $29 | $9 | $0 | $0 | $4 | $1 | $0 | $7 | $3 | $5 | $4 | $197 | $100 |
| Nov 2008 | $60 | $36 | $32 | $19 | $12 | $0 | $72 | $27 | $24 | $17 | $7 | $0 | $0 | $2 | $1 | $0 | $5 | $2 | $5 | $3 | $142 | $68 |
| Dec 2008 | $65 | $41 | $36 | $21 | $15 | $0 | $110 | $49 | $45 | $34 | $11 | $0 | $0 | $3 | $1 | $0 | $5 | $2 | $6 | $5 | $185 | $96 |
| Jan 2009 | $46 | $27 | $24 | $13 | $10 | $0 | $180 | $99 | $93 | $77 | $16 | $0 | $0 | $5 | $1 | $0 | $5 | $2 | $3 | $2 | $234 | $130 |
| Feb 2009 | $48 | $30 | $26 | $15 | $11 | $0 | $204 | $126 | $119 | $102 | $16 | $0 | $0 | $6 | $1 | $0 | $5 | $3 | $4 | $2 | $261 | $160 |
| Mar 2009 | $59 | $38 | $34 | $18 | $16 | $0 | $214 | $131 | $123 | $104 | $19 | $0 | $0 | $7 | $1 | $0 | $6 | $3 | $4 | $3 | $283 | $175 |
| Apr 2009 | $60 | $40 | $36 | $19 | $17 | $0 | $222 | $131 | $123 | $102 | $21 | $0 | $0 | $7 | $1 | $0 | $6 | $3 | $5 | $4 | $293 | $179 |
| May 2009 | $65 | $45 | $40 | $21 | $19 | $0 | $223 | $138 | $129 | $108 | $21 | $0 | $0 | $8 | $1 | $0 | $6 | $3 | $3 | $2 | $297 | $188 |
| June 2009 | $80 | $56 | $51 | $27 | $23 | $0 | $221 | $133 | $124 | $105 | $18 | $0 | $0 | $8 | $1 | $0 | $6 | $4 | $5 | $4 | $313 | $196 |
| July 2009 | $83 | $58 | $53 | $28 | $24 | $0 | $176 | $98 | $91 | $75 | $15 | $0 | $0 | $7 | $1 | $0 | $6 | $3 | $4 | $2 | $268 | $162 |
| Aug 2009 | $75 | $52 | $47 | $25 | $22 | $0 | $134 | $70 | $64 | $52 | $12 | $0 | $0 | $5 | $1 | $0 | $5 | $3 | $4 | $2 | $217 | $126 |
| Sept 2009 | $73 | $50 | $45 | $23 | $22 | $0 | $125 | $62 | $57 | $44 | $13 | $0 | $0 | $5 | $0 | $0 | $5 | $2 | $4 | $3 | $207 | $117 |
| Oct 2009 | $75 | $52 | $47 | $23 | $24 | $0 | $134 | $71 | $65 | $51 | $14 | $0 | $0 | $5 | $0 | $0 | $4 | $2 | $3 | $2 | $216 | $127 |
| Nov 2009 | $70 | $49 | $45 | $22 | $23 | $0 | $135 | $77 | $72 | $57 | $14 | $0 | $0 | $5 | $0 | $0 | $4 | $2 | $3 | $2 | $211 | $130 |
| Dec 2009 | $65 | $44 | $39 | $21 | $18 | $0 | $150 | $85 | $78 | $64 | $13 | $0 | $0 | $6 | $0 | $0 | $4 | $2 | $6 | $5 | $224 | $135 |
| Jan 2010 | $46 | $28 | $25 | $14 | $11 | $0 | $123 | $68 | $62 | $54 | $8 | $0 | $0 | $5 | $0 | $0 | $3 | $2 | $3 | $2 | $175 | $100 |
| Feb 2010 | $47 | $30 | $27 | $14 | $13 | $0 | $105 | $55 | $50 | $43 | $7 | $0 | $0 | $5 | $0 | $0 | $3 | $2 | $2 | $2 | $157 | $88 |
| Mar 2010 | $67 | $45 | $41 | $21 | $19 | $0 | $122 | $67 | $61 | $51 | $9 | $0 | $0 | $5 | $0 | $0 | $4 | $2 | $4 | $3 | $197 | $116 |
| Apr 2010 | $73 | $50 | $46 | $23 | $22 | $0 | $109 | $60 | $54 | $46 | $8 | $0 | $0 | $5 | $0 | $0 | $4 | $2 | $3 | $2 | $189 | $114 |
| May 2010 | $77 | $54 | $50 | $26 | $23 | $0 | $97 | $49 | $44 | $38 | $7 | $0 | $0 | $4 | $0 | $0 | $3 | $2 | $3 | $2 | $180 | $107 |
| June 2010 | $90 | $66 | $61 | $33 | $27 | $0 | $120 | $63 | $58 | $49 | $8 | $0 | $0 | $5 | $0 | $0 | $4 | $2 | $5 | $3 | $219 | $134 |
| July 2010 | $62 | $42 | $37 | $22 | $15 | $0 | $141 | $79 | $73 | $63 | $10 | $0 | $0 | $5 | $0 | $0 | $4 | $2 | $5 | $3 | $211 | $126 |
| Aug 2010 | $61 | $42 | $38 | $22 | $16 | $0 | $181 | $110 | $103 | $89 | $14 | $0 | $0 | $7 | $0 | $0 | $4 | $2 | $5 | $3 | $252 | $158 |
| Sept 2010 | $58 | $40 | $36 | $20 | $16 | $0 | $195 | $122 | $114 | $99 | $15 | $0 | $0 | $8 | $1 | $0 | $4 | $2 | $6 | $4 | $263 | $169 |
| Oct 2010 | $54 | $37 | $32 | $18 | $14 | $0 | $207 | $132 | $123 | $107 | $16 | $0 | $0 | $8 | $1 | $0 | $4 | $3 | $5 | $4 | $269 | $175 |
| Nov 2010 | $52 | $35 | $31 | $18 | $14 | $0 | $214 | $138 | $129 | $113 | $15 | $0 | $0 | $9 | $1 | $0 | $4 | $3 | $5 | $4 | $275 | $180 |
| Dec 2010 | $58 | $40 | $35 | $20 | $15 | $0 | $203 | $128 | $118 | $105 | $13 | $0 | $0 | $10 | $1 | $0 | $4 | $2 | $9 | $8 | $274 | $179 |
| Jan 2011 | $43 | $28 | $24 | $14 | $10 | $0 | $155 | $93 | $85 | $75 | $9 | $0 | $0 | $8 | $0 | $0 | $3 | $2 | $4 | $3 | $207 | $126 |
| Feb 2011 | $43 | $28 | $24 | $13 | $11 | $0 | $121 | $67 | $60 | $52 | $7 | $0 | $0 | $7 | $0 | $0 | $3 | $2 | $5 | $3 | $171 | $100 |
| Mar 2011 | $59 | $39 | $34 | $19 | $15 | $0 | $116 | $61 | $54 | $46 | $8 | $0 | $0 | $7 | $0 | $0 | $3 | $2 | $7 | $6 | $186 | $108 |
| Apr 2011 | $58 | $40 | $35 | $19 | $15 | $0 | $94 | $50 | $44 | $38 | $6 | $0 | $0 | $5 | $0 | $0 | $3 | $2 | $6 | $4 | $161 | $96 |
| May 2011 | $65 | $44 | $39 | $22 | $17 | $0 | $89 | $45 | $40 | $34 | $6 | $0 | $0 | $5 | $0 | $0 | $3 | $2 | $7 | $5 | $163 | $97 |
| June 2011 | $73 | $53 | $47 | $28 | $18 | $0 | $100 | $53 | $47 | $41 | $6 | $0 | $0 | $6 | $0 | $0 | $3 | $2 | $8 | $6 | $184 | $114 |
| July 2011 | $64 | $46 | $41 | $25 | $16 | $0 | $99 | $56 | $50 | $44 | $6 | $0 | $0 | $6 | $0 | $0 | $3 | $2 | $6 | $4 | $172 | $109 |
| Aug 2011 | $70 | $49 | $44 | $26 | $17 | $0 | $128 | $69 | $63 | $55 | $7 | $0 | $0 | $6 | $0 | $0 | $4 | $2 | $7 | $6 | $209 | $126 |
| Sept 2011 | $60 | $43 | $38 | $22 | $16 | $0 | $160 | $97 | $90 | $80 | $9 | $0 | $0 | $7 | $0 | $0 | $4 | $2 | $8 | $6 | $231 | $148 |
| Oct 2011 | $55 | $38 | $33 | $19 | $14 | $0 | $176 | $112 | $104 | $92 | $11 | $0 | $0 | $8 | $0 | $0 | $4 | $2 | $7 | $6 | $242 | $158 |
| Nov 2011 | $53 | $37 | $32 | $19 | $13 | $0 | $173 | $111 | $102 | $90 | $12 | $0 | $0 | $9 | $0 | $0 | $4 | $2 | $7 | $6 | $237 | $156 |
| Dec 2011 | $56 | $40 | $35 | $20 | $15 | $0 | $168 | $106 | $97 | $84 | $13 | $0 | $0 | $9 | $0 | $0 | $4 | $2 | $12 | $11 | $239 | $160 |
| Jan 2012 | $43 | $28 | $25 | $14 | $10 | $0 | $160 | $97 | $89 | $76 | $12 | $0 | $0 | $8 | $0 | $0 | $3 | $2 | $7 | $5 | $214 | $133 |
| Feb 2012 | $47 | $32 | $28 | $16 | $12 | $0 | $178 | $113 | $102 | $88 | $14 | $0 | $0 | $10 | $0 | $0 | $4 | $2 | $8 | $6 | $237 | $152 |
| Mar 2012 | $61 | $43 | $38 | $22 | $15 | $0 | $186 | $119 | $108 | $91 | $16 | $0 | $0 | $10 | $0 | $0 | $4 | $3 | $9 | $7 | $261 | $171 |
| Apr 2012 | $65 | $46 | $40 | $24 | $16 | $0 | $170 | $106 | $96 | $81 | $15 | $0 | $0 | $10 | $0 | $0 | $4 | $2 | $9 | $6 | $248 | $161 |
| May 2012 | $77 | $55 | $49 | $30 | $18 | $0 | $171 | $104 | $94 | $81 | $12 | $0 | $0 | $10 | $1 | $0 | $4 | $3 | $10 | $7 | $263 | $170 |
| June 2012 | $82 | $60 | $54 | $35 | $18 | $0 | $174 | $106 | $95 | $82 | $13 | $0 | $0 | $11 | $0 | $0 | $4 | $3 | $10 | $8 | $270 | $177 |
| July 2012 | $78 | $56 | $50 | $33 | $17 | $0 | $189 | $118 | $106 | $91 | $15 | $0 | $0 | $11 | $0 | $0 | $4 | $3 | $9 | $7 | $280 | $183 |
| Aug 2012 | $82 | $60 | $53 | $34 | $18 | $0 | $211 | $138 | $125 | $107 | $18 | $0 | $0 | $13 | $0 | $0 | $5 | $3 | $11 | $8 | $309 | $209 |
| Sept 2012 | $67 | $48 | $42 | $27 | $15 | $0 | $188 | $124 | $112 | $96 | $16 | $0 | $0 | $11 | $0 | $0 | $4 | $3 | $11 | $8 | $270 | $183 |
| Oct 2012 | $72 | $50 | $44 | $28 | $16 | $0 | $225 | $147 | $133 | $113 | $20 | $0 | $0 | $14 | $0 | $0 | $5 | $3 | $12 | $9 | $313 | $210 |
| Nov 2012 | $67 | $49 | $42 | $27 | $15 | $0 | $201 | $133 | $120 | $101 | $18 | $0 | $0 | $13 | $0 | $0 | $5 | $3 | $12 | $9 | $285 | $194 |
| Dec 2012 | $67 | $49 | $43 | $28 | $15 | $0 | $209 | $140 | $126 | $106 | $19 | $0 | $0 | $14 | $0 | $0 | $5 | $3 | $15 | $13 | $296 | $205 |
| Jan 2013 | $55 | $36 | $32 | $20 | $12 | $0 | $211 | $138 | $123 | $104 | $19 | $0 | $0 | $14 | $0 | $0 | $4 | $3 | $9 | $6 | $279 | $183 |
| Feb 2013 | $55 | $37 | $33 | $21 | $12 | $0 | $188 | $124 | $110 | $92 | $17 | $0 | $0 | $14 | $0 | $0 | $4 | $3 | $10 | $7 | $257 | $171 |
| Mar 2013 | $72 | $51 | $45 | $29 | $15 | $0 | $191 | $123 | $108 | $91 | $17 | $0 | $0 | $14 | $0 | $0 | $5 | $3 | $11 | $8 | $279 | $184 |
| Apr 2013 | $84 | $59 | $52 | $35 | $17 | $0 | $189 | $118 | $104 | $87 | $17 | $0 | $0 | $13 | $0 | $0 | $5 | $3 | $11 | $8 | $290 | $189 |
| May 2013 | $97 | $70 | $62 | $43 | $19 | $0 | $188 | $117 | $103 | $87 | $15 | $0 | $0 | $14 | $0 | $0 | $6 | $4 | $13 | $10 | $304 | $200 |
| June 2013 | $100 | $73 | $66 | $46 | $19 | $0 | $165 | $103 | $90 | $77 | $12 | $0 | $0 | $12 | $0 | $0 | $6 | $4 | $13 | $10 | $284 | $190 |
| July 2013 | $107 | $77 | $69 | $49 | $19 | $0 | $153 | $92 | $80 | $70 | $10 | $0 | $0 | $12 | $0 | $0 | $6 | $4 | $13 | $9 | $279 | $182 |
| Aug 2013 | $103 | $74 | $66 | $47 | $19 | $0 | $122 | $69 | $59 | $52 | $7 | $0 | $0 | $9 | $0 | $0 | $5 | $3 | $14 | $10 | $244 | $156 |
| Sept 2013 | $86 | $61 | $54 | $38 | $16 | $0 | $94 | $50 | $42 | $37 | $5 | $0 | $0 | $7 | $0 | $0 | $5 | $3 | $13 | $9 | $198 | $123 |
| Oct 2013 | $85 | $59 | $52 | $37 | $15 | $0 | $90 | $45 | $38 | $33 | $5 | $0 | $0 | $7 | $0 | $0 | $4 | $3 | $14 | $10 | $194 | $117 |
| Nov 2013 | $72 | $52 | $46 | $32 | $14 | $0 | $79 | $42 | $36 | $31 | $5 | $0 | $0 | $6 | $0 | $0 | $4 | $2 | $13 | $9 | $168 | $104 |
| Dec 2013 | $76 | $55 | $49 | $34 | $14 | $0 | $80 | $44 | $37 | $32 | $5 | $0 | $0 | $6 | $0 | $0 | $4 | $2 | $15 | $12 | $174 | $113 |
| Jan 2014 | $60 | $40 | $35 | $24 | $11 | $0 | $72 | $35 | $30 | $26 | $4 | $0 | $0 | $5 | $0 | $0 | $4 | $2 | $10 | $6 | $146 | $84 |
| Feb 2014 | $59 | $40 | $35 | $24 | $11 | $0 | $63 | $31 | $26 | $22 | $4 | $0 | $0 | $5 | $0 | $0 | $4 | $2 | $10 | $7 | $135 | $79 |
| Mar 2014 | $75 | $52 | $46 | $32 | $14 | $0 | $71 | $37 | $31 | $26 | $5 | $0 | $0 | $5 | $0 | $0 | $5 | $2 | $11 | $7 | $162 | $98 |
| Apr 2014 | $86 | $60 | $53 | $37 | $16 | $0 | $73 | $37 | $31 | $26 | $5 | $0 | $0 | $5 | $0 | $0 | $5 | $3 | $11 | $8 | $175 | $107 |
| May 2014 | $98 | $71 | $63 | $45 | $18 | $0 | $70 | $36 | $31 | $25 | $5 | $0 | $0 | $5 | $0 | $0 | $5 | $3 | $13 | $9 | $186 | $118 |
| June 2014 | $107 | $79 | $71 | $51 | $19 | $0 | $78 | $42 | $34 | $29 | $6 | $0 | $0 | $8 | $0 | $0 | $5 | $3 | $13 | $10 | $204 | $134 |
| July 2014 | $108 | $79 | $71 | $51 | $20 | $0 | $81 | $43 | $37 | $31 | $6 | $0 | $0 | $5 | $0 | $0 | $5 | $3 | $13 | $10 | $207 | $135 |
| Aug 2014 | $100 | $74 | $66 | $47 | $18 | $0 | $80 | $44 | $37 | $31 | $6 | $0 | $0 | $6 | $0 | $0 | $5 | $3 | $11 | $9 | $196 | $130 |
| Sept 2014 | $93 | $67 | $59 | $41 | $17 | $0 | $82 | $46 | $40 | $33 | $6 | $0 | $0 | $5 | $0 | $0 | $5 | $3 | $14 | $11 | $196 | $127 |
| Oct 2014 | $95 | $68 | $60 | $42 | $18 | $0 | $90 | $48 | $42 | $34 | $7 | $0 | $0 | $6 | $0 | $0 | $6 | $3 | $14 | $11 | $205 | $130 |
| Nov 2014 | $75 | $55 | $48 | $33 | $14 | $0 | $86 | $51 | $45 | $37 | $8 | $0 | $0 | $5 | $0 | $0 | $5 | $3 | $12 | $9 | $178 | $118 |
| Dec 2014 | $86 | $64 | $57 | $39 | $17 | $0 | $123 | $83 | $55 | $46 | $9 | $0 | $0 | $28 | $0 | $0 | $5 | $3 | $19 | $16 | $234 | $167 |
| Jan 2015 | $63 | $43 | $37 | $26 | $11 | $0 | $98 | $53 | $47 | $39 | $8 | $0 | $0 | $5 | $0 | $0 | $5 | $3 | $13 | $10 | $178 | $108 |
| Feb 2015 | $66 | $46 | $40 | $27 | $13 | $0 | $125 | $77 | $71 | $55 | $16 | $0 | $0 | $6 | $0 | $0 | $5 | $3 | $11 | $9 | $207 | $135 |
| Mar 2015 | $92 | $66 | $58 | $39 | $19 | $0 | $148 | $96 | $87 | $69 | $18 | $0 | $0 | $8 | $0 | $0 | $7 | $5 | $16 | $13 | $263 | $179 |
| Apr 2015 | $101 | $73 | $65 | $43 | $21 | $0 | $130 | $79 | $71 | $55 | $16 | $0 | $0 | $7 | $0 | $0 | $7 | $4 | $17 | $13 | $256 | $169 |
| May 2015 | $111 | $82 | $73 | $50 | $23 | $0 | $117 | $71 | $64 | $50 | $14 | $0 | $0 | $6 | $0 | $0 | $7 | $4 | $17 | $12 | $252 | $169 |
| June 2015 | $132 | $99 | $89 | $61 | $27 | $0 | $117 | $69 | $62 | $48 | $13 | $0 | $0 | $7 | $0 | $0 | $8 | $5 | $18 | $13 | $276 | $186 |
| July 2015 | $130 | $97 | $87 | $60 | $27 | $0 | $105 | $57 | $51 | $40 | $11 | $0 | $0 | $6 | $0 | $0 | $8 | $5 | $15 | $11 | $258 | $170 |
| Aug 2015 | $117 | $86 | $78 | $53 | $24 | $0 | $101 | $52 | $47 | $36 | $10 | $0 | $0 | $5 | $0 | $0 | $7 | $4 | $16 | $13 | $241 | $156 |
| Sept 2015 | $111 | $81 | $72 | $48 | $23 | $0 | $106 | $55 | $49 | $39 | $10 | $0 | $0 | $5 | $0 | $0 | $7 | $4 | $16 | $11 | $239 | $152 |
| Oct 2015 | $105 | $75 | $67 | $44 | $22 | $0 | $112 | $57 | $52 | $41 | $10 | $0 | $0 | $5 | $0 | $0 | $7 | $4 | $17 | $13 | $242 | $150 |
| Nov 2015 | $84 | $60 | $53 | $35 | $17 | $0 | $101 | $52 | $47 | $37 | $9 | $0 | $0 | $5 | $0 | $0 | $6 | $4 | $14 | $10 | $206 | $126 |
| Dec 2015 | $101 | $74 | $66 | $44 | $21 | $0 | $109 | $56 | $50 | $40 | $10 | $0 | $0 | $6 | $0 | $0 | $7 | $4 | $22 | $19 | $239 | $154 |
| Jan 2016 | $76 | $52 | $46 | $31 | $15 | $0 | $97 | $48 | $43 | $33 | $9 | $0 | $0 | $5 | $0 | $0 | $6 | $3 | $17 | $13 | $196 | $116 |
| Feb 2016 | $82 | $55 | $49 | $32 | $16 | $0 | $114 | $55 | $49 | $38 | $11 | $0 | $0 | $5 | $0 | $0 | $6 | $4 | $14 | $9 | $216 | $123 |
| Mar 2016 | $107 | $76 | $67 | $44 | $22 | $0 | $152 | $79 | $72 | $56 | $16 | $0 | $0 | $6 | $0 | $0 | $8 | $5 | $14 | $10 | $281 | $170 |
| Apr 2016 | $114 | $82 | $74 | $49 | $24 | $0 | $136 | $73 | $66 | $52 | $14 | $0 | $0 | $6 | $0 | $0 | $8 | $5 | $14 | $11 | $273 | $171 |
| May 2016 | $130 | $95 | $86 | $58 | $27 | $0 | $134 | $72 | $66 | $51 | $15 | $0 | $0 | $6 | $0 | $0 | $9 | $5 | $15 | $12 | $288 | $184 |
| June 2016 | $149 | $110 | $100 | $69 | $30 | $0 | $141 | $73 | $66 | $51 | $15 | $0 | $0 | $7 | $0 | $0 | $9 | $6 | $19 | $16 | $319 | $205 |
| July 2016 | $130 | $96 | $87 | $60 | $26 | $0 | $137 | $70 | $64 | $49 | $15 | $0 | $0 | $6 | $0 | $0 | $9 | $5 | $15 | $12 | $290 | $183 |
| Aug 2016 | $139 | $101 | $91 | $63 | $28 | $0 | $184 | $104 | $96 | $76 | $20 | $0 | $0 | $8 | $0 | $0 | $11 | $7 | $19 | $15 | $353 | $228 |
| Sept 2016 | $122 | $90 | $80 | $54 | $25 | $0 | $168 | $100 | $92 | $73 | $19 | $0 | $0 | $8 | $0 | $0 | $11 | $7 | $18 | $15 | $319 | $212 |
| Oct 2016 | $113 | $82 | $73 | $50 | $23 | $0 | $170 | $100 | $92 | $73 | $19 | $0 | $0 | $8 | $0 | $0 | $11 | $7 | $16 | $13 | $310 | $203 |
| Nov 2016 | $107 | $79 | $70 | $48 | $22 | $0 | $162 | $95 | $86 | $68 | $18 | $0 | $0 | $8 | $0 | $0 | $10 | $7 | $17 | $15 | $297 | $195 |
| Dec 2016 | $112 | $84 | $74 | $50 | $23 | $0 | $154 | $85 | $77 | $61 | $15 | $0 | $0 | $8 | $0 | $0 | $11 | $7 | $20 | $17 | $296 | $192 |
| Jan 2017 | $89 | $61 | $53 | $36 | $17 | $0 | $111 | $60 | $53 | $43 | $10 | $0 | $0 | $6 | $0 | $0 | $9 | $5 | $16 | $11 | $225 | $137 |
| Feb 2017 | $87 | $59 | $52 | $34 | $17 | $0 | $89 | $46 | $41 | $31 | $9 | $0 | $0 | $5 | $0 | $0 | $8 | $4 | $14 | $10 | $198 | $119 |
| Mar 2017 | $124 | $87 | $77 | $52 | $24 | $0 | $97 | $48 | $42 | $32 | $10 | $0 | $0 | $6 | $0 | $0 | $9 | $5 | $20 | $14 | $250 | $154 |
| Apr 2017 | $120 | $86 | $77 | $53 | $23 | $0 | $83 | $41 | $36 | $28 | $8 | $0 | $0 | $5 | $0 | $0 | $8 | $4 | $15 | $11 | $226 | $142 |
| May 2017 | $147 | $107 | $96 | $67 | $28 | $0 | $94 | $46 | $41 | $31 | $9 | $0 | $0 | $5 | $0 | $0 | $10 | $5 | $19 | $12 | $269 | $170 |
| June 2017 | $163 | $121 | $109 | $77 | $30 | $0 | $93 | $46 | $41 | $31 | $10 | $0 | $0 | $5 | $0 | $0 | $10 | $5 | $25 | $18 | $291 | $191 |
| July 2017 | $138 | $102 | $92 | $65 | $26 | $0 | $89 | $46 | $41 | $31 | $9 | $0 | $0 | $5 | $0 | $0 | $10 | $5 | $17 | $11 | $253 | $165 |
| Aug 2017 | $148 | $108 | $97 | $68 | $27 | $1 | $102 | $53 | $47 | $36 | $10 | $0 | $0 | $5 | $0 | $0 | $11 | $6 | $23 | $16 | $284 | $183 |
| Sept 2017 | $124 | $92 | $81 | $57 | $23 | $0 | $97 | $52 | $46 | $36 | $10 | $0 | $0 | $5 | $0 | $0 | $10 | $6 | $19 | $15 | $250 | $164 |
| Oct 2017 | $126 | $91 | $80 | $57 | $23 | $0 | $108 | $60 | $54 | $43 | $11 | $0 | $0 | $5 | $0 | $0 | $11 | $6 | $20 | $15 | $265 | $172 |
| Nov 2017 | $117 | $85 | $75 | $53 | $21 | $0 | $100 | $53 | $48 | $37 | $10 | $0 | $0 | $5 | $0 | $0 | $10 | $6 | $25 | $18 | $251 | $162 |
| Dec 2017 | $118 | $88 | $78 | $55 | $22 | $0 | $94 | $53 | $47 | $36 | $11 | $0 | $0 | $5 | $0 | $0 | $9 | $6 | $26 | $20 | $247 | $166 |
Loan production expenses have increased significantly due to tigher regulation after the 2008-2009 financial crisis. The MBA stated loan production expenses rose to $8,278 in 2018 from $8,028 in 2017. Lenders have averaged around $1000 of profit per loan over the past decade, with tighter margins recently as net income fell from 31 basis points in 2017 to 14 basis points in 2018.
“Since the inception of the Annual Performance Report in 2008, net production income by year has averaged 49 bps ($1,020 per loan).” … “In basis points, the average production profit (net production income) was 14 basis points in 2018, compared to 31 basis points in 2017. In the first half of 2018, net production income averaged 18 basis points, then dropped to 9 basis points in the second half of 2018,” reports Marina Walsh of the MBA.
The IMF estimated the GDP of the world at $86.927 trillion in 2018, or $134.981 trillion on a purchasing power parity basis.
The global real estate market accounts for about 60% of all mainstream assets & was worth $280.6 trillion at the end of 2017. Residential property represents $220.6 trillion of that market according to a study done by Savills World Research. At the end of 2016 the median global home value was $82,000 across the 2.05 billion households in the world.
In the first half of 2023 $10 trillion in debt was added to the global economy, with $100 trillion being added over the past decade. Global debt hit $307 trillion at the end of the second quarter, according to the Institute of International Finance (IIF). They pegged global debt to GDP at 336%, meaning they saw global GDP at $91.37 trillion. In 2023 on a PPP basis the IMF estimated emerging economies representing 58.85% of GDP while developed economies represented 41.15%.
After the Great Recession many United States homeowners were in negative equity, with 26% of mortgaged properties having negative equity in the third quarter of 2009. As of the end of the second quarter of 2018 only 2.2 million homes, or 4.3% of mortgaged properties remained in negative equity. CoreLogic estimated that in the second quarter of 2018 U.S. homeowners saw an average increase of equity of $16,200 for in the year leading up to the middle of 2018, while key states like California increased by as much as $48,000.
In the middle of 2018 over the past year homeowners saw an average equity increase of 12.3%, for a total increase of $980.9 billion. Key metro areas appreciated faster than the broader market, leaving nearly half of the nation's largest 50 markets overvalued. The 63% of homes across the United States with active mortgages then had around $8.956 trillion in equity. The other 37% of homes were owned outright. The US residential real estate market was valued at $31.8 trillion at the end of 2017.
Redfin estimated the US residential real estate market was valued at $47 trillion at the end of Q2 in 2023. Statistia estimated that residential real estate inside the US was worth 78.28% of the domestic real estate market value, while commercial real estate was valued at 21.72% of the total market value in 2023.
Credit card holders typically carry a relatively small balance relative to their spending limit. In recent years HELOC borrowers tended to use about half their loan limit on average.
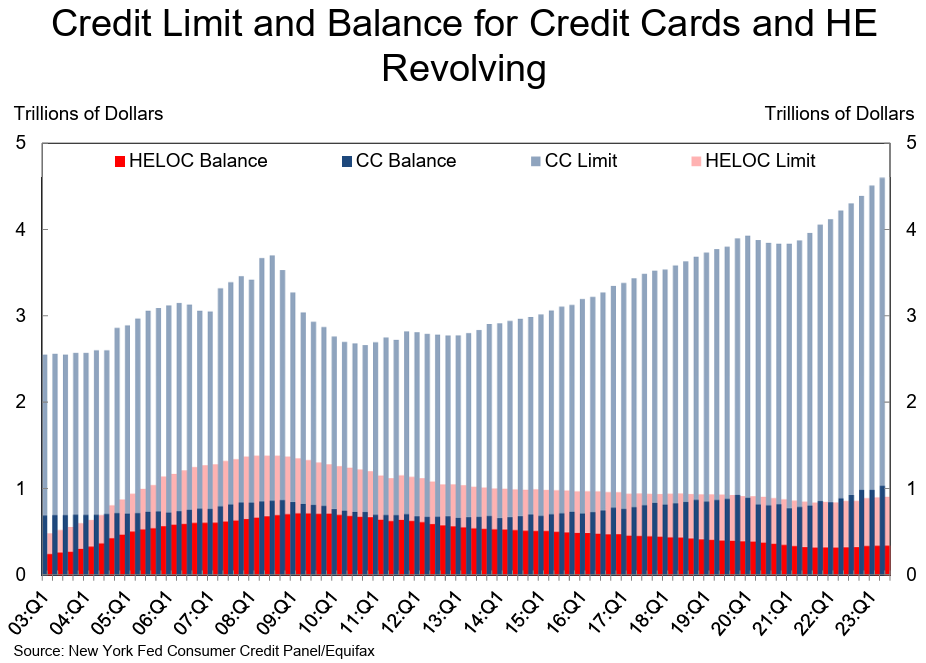
Despite the decline in the American housing market after the 2008 - 2009 recession, home secured debt still makes up more than 2/3 of all consumer debt in the United States. That includes new and existing mortgages, as well as second mortgages. As of 2013, and the latest US census, mortgage and home secured debt stood at just over 8.5 trillion dollars; a 12% drop from peak levels recorded in the last quarter of 2008.
Households were spending 13.22% of personal disposable income on debt service payments in Q4 of 2007. This has fallen to 9.84% at the end of Q2 2018 aided in part by lower interest rates in response to the 2008-2009 crisis and debt levels which fell relative to GDP. In early 2008 household debt to GDP reached 99.19% & had fallen to 80.1% by the end of 2016.
In recent years consumers have opened millions of new credit card accounts & took on millions of new auto loans, but the number of mortgages & home equity lines have declined slightly.
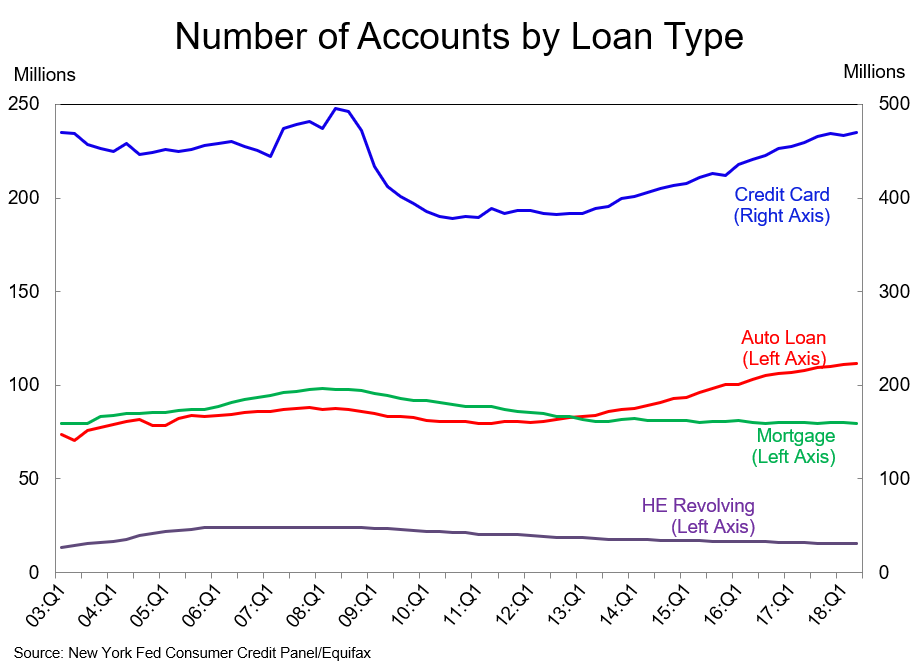
Looking specifically at mortgage debt, in Q4 of 2007 homeowners were paying 7.22% of personal disposable income on mortgage debt service payments. That number had fallen to 4.24% by the end of Q2 in 2018.
In Q4 of 2017 total mortgage debt outstanding exceeded the Q2 2008 peak, though in real terms the total is still significantly lower if adjusted for a decade of inflation.
As of the end of 2023 Q2 mortgage debt & home equity debt comprised 72.39% of total household debt.
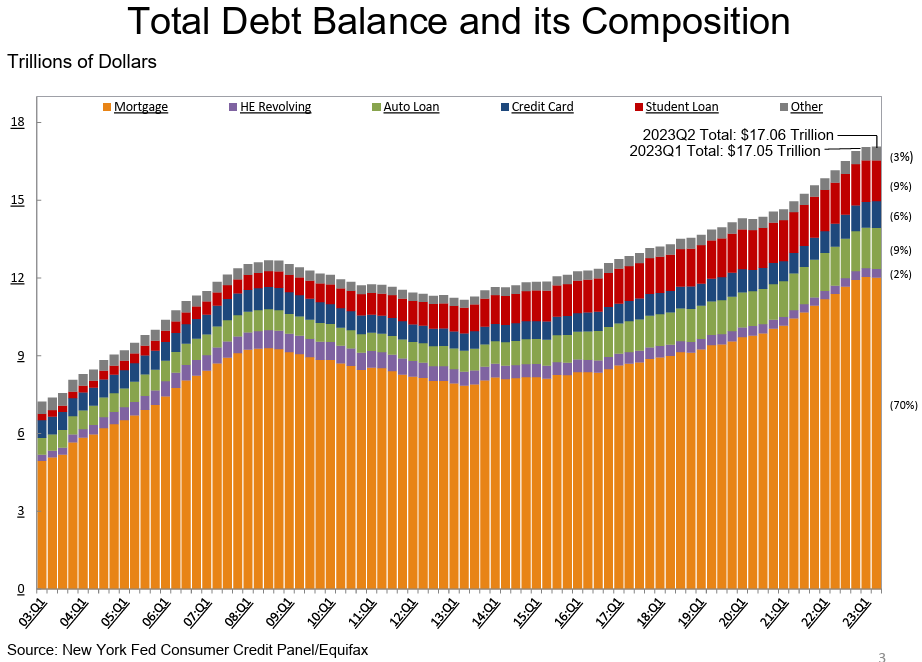
Here is an HTML table which contains the data in the above graph. Data shown in the below table is in trillions of United States Dollars at the end of each quarter.
| Quarter | Mortgage | Home Equity | Auto | Credit Card | Student Loan | Other | Total |
|---|---|---|---|---|---|---|---|
| 2003 Q1 | 4.94 | 0.24 | 0.64 | 0.69 | 0.24 | 0.48 | 7.23 |
| 2003 Q2 | 5.08 | 0.26 | 0.62 | 0.69 | 0.24 | 0.49 | 7.38 |
| 2003 Q3 | 5.18 | 0.27 | 0.68 | 0.69 | 0.25 | 0.48 | 7.56 |
| 2003 Q4 | 5.66 | 0.30 | 0.70 | 0.70 | 0.25 | 0.45 | 8.07 |
| 2004 Q1 | 5.84 | 0.33 | 0.72 | 0.70 | 0.26 | 0.45 | 8.29 |
| 2004 Q2 | 5.97 | 0.37 | 0.74 | 0.70 | 0.26 | 0.42 | 8.46 |
| 2004 Q3 | 6.21 | 0.43 | 0.75 | 0.71 | 0.33 | 0.41 | 8.83 |
| 2004 Q4 | 6.36 | 0.47 | 0.73 | 0.72 | 0.35 | 0.42 | 9.04 |
| 2005 Q1 | 6.51 | 0.50 | 0.73 | 0.71 | 0.36 | 0.39 | 9.21 |
| 2005 Q2 | 6.70 | 0.53 | 0.77 | 0.72 | 0.37 | 0.40 | 9.49 |
| 2005 Q3 | 6.91 | 0.54 | 0.83 | 0.73 | 0.38 | 0.41 | 9.79 |
| 2005 Q4 | 7.10 | 0.57 | 0.79 | 0.74 | 0.39 | 0.42 | 10.00 |
| 2006 Q1 | 7.44 | 0.58 | 0.79 | 0.72 | 0.43 | 0.42 | 10.38 |
| 2006 Q2 | 7.76 | 0.59 | 0.80 | 0.74 | 0.44 | 0.42 | 10.75 |
| 2006 Q3 | 8.05 | 0.60 | 0.82 | 0.75 | 0.45 | 0.44 | 11.11 |
| 2006 Q4 | 8.23 | 0.60 | 0.82 | 0.77 | 0.48 | 0.41 | 11.31 |
| 2007 Q1 | 8.42 | 0.61 | 0.79 | 0.76 | 0.51 | 0.40 | 11.50 |
| 2007 Q2 | 8.71 | 0.62 | 0.81 | 0.80 | 0.51 | 0.41 | 11.85 |
| 2007 Q3 | 8.93 | 0.63 | 0.82 | 0.82 | 0.53 | 0.41 | 12.13 |
| 2007 Q4 | 9.10 | 0.65 | 0.82 | 0.84 | 0.55 | 0.42 | 12.37 |
| 2008 Q1 | 9.23 | 0.66 | 0.81 | 0.84 | 0.58 | 0.42 | 12.54 |
| 2008 Q2 | 9.27 | 0.68 | 0.81 | 0.85 | 0.59 | 0.40 | 12.60 |
| 2008 Q3 | 9.29 | 0.69 | 0.81 | 0.86 | 0.61 | 0.41 | 12.68 |
| 2008 Q4 | 9.26 | 0.71 | 0.79 | 0.87 | 0.64 | 0.41 | 12.67 |
| 2009 Q1 | 9.14 | 0.71 | 0.77 | 0.84 | 0.66 | 0.41 | 12.53 |
| 2009 Q2 | 9.06 | 0.71 | 0.74 | 0.82 | 0.68 | 0.39 | 12.41 |
| 2009 Q3 | 8.94 | 0.71 | 0.74 | 0.81 | 0.69 | 0.38 | 12.28 |
| 2009 Q4 | 8.84 | 0.71 | 0.72 | 0.80 | 0.72 | 0.38 | 12.17 |
| 2010 Q1 | 8.83 | 0.70 | 0.70 | 0.76 | 0.76 | 0.36 | 12.12 |
| 2010 Q2 | 8.70 | 0.68 | 0.70 | 0.74 | 0.76 | 0.35 | 11.94 |
| 2010 Q3 | 8.61 | 0.67 | 0.71 | 0.73 | 0.78 | 0.34 | 11.84 |
| 2010 Q4 | 8.45 | 0.67 | 0.71 | 0.73 | 0.81 | 0.34 | 11.71 |
| 2011 Q1 | 8.54 | 0.64 | 0.71 | 0.70 | 0.84 | 0.33 | 11.75 |
| 2011 Q2 | 8.52 | 0.62 | 0.71 | 0.69 | 0.85 | 0.33 | 11.73 |
| 2011 Q3 | 8.40 | 0.64 | 0.73 | 0.69 | 0.87 | 0.33 | 11.66 |
| 2011 Q4 | 8.27 | 0.63 | 0.73 | 0.70 | 0.87 | 0.33 | 11.54 |
| 2012 Q1 | 8.19 | 0.61 | 0.74 | 0.68 | 0.90 | 0.32 | 11.44 |
| 2012 Q2 | 8.15 | 0.59 | 0.75 | 0.67 | 0.91 | 0.31 | 11.38 |
| 2012 Q3 | 8.03 | 0.57 | 0.77 | 0.67 | 0.96 | 0.31 | 11.31 |
| 2012 Q4 | 8.03 | 0.56 | 0.78 | 0.68 | 0.97 | 0.32 | 11.34 |
| 2013 Q1 | 7.93 | 0.55 | 0.79 | 0.66 | 0.99 | 0.31 | 11.23 |
| 2013 Q2 | 7.84 | 0.54 | 0.81 | 0.67 | 0.99 | 0.30 | 11.15 |
| 2013 Q3 | 7.90 | 0.54 | 0.85 | 0.67 | 1.03 | 0.30 | 11.28 |
| 2013 Q4 | 8.05 | 0.53 | 0.86 | 0.68 | 1.08 | 0.32 | 11.52 |
| 2014 Q1 | 8.17 | 0.53 | 0.88 | 0.66 | 1.11 | 0.31 | 11.65 |
| 2014 Q2 | 8.10 | 0.52 | 0.91 | 0.67 | 1.12 | 0.32 | 11.63 |
| 2014 Q3 | 8.13 | 0.51 | 0.93 | 0.68 | 1.13 | 0.33 | 11.71 |
| 2014 Q4 | 8.17 | 0.51 | 0.96 | 0.70 | 1.16 | 0.34 | 11.83 |
| 2015 Q1 | 8.17 | 0.51 | 0.97 | 0.68 | 1.19 | 0.33 | 11.85 |
| 2015 Q2 | 8.12 | 0.50 | 1.01 | 0.70 | 1.19 | 0.34 | 11.85 |
| 2015 Q3 | 8.26 | 0.49 | 1.05 | 0.71 | 1.20 | 0.35 | 12.07 |
| 2015 Q4 | 8.25 | 0.49 | 1.06 | 0.73 | 1.23 | 0.35 | 12.12 |
| 2016 Q1 | 8.37 | 0.49 | 1.07 | 0.71 | 1.26 | 0.35 | 12.25 |
| 2016 Q2 | 8.36 | 0.48 | 1.10 | 0.73 | 1.26 | 0.36 | 12.29 |
| 2016 Q3 | 8.35 | 0.47 | 1.14 | 0.75 | 1.28 | 0.37 | 12.35 |
| 2016 Q4 | 8.48 | 0.47 | 1.16 | 0.78 | 1.31 | 0.38 | 12.58 |
| 2017 Q1 | 8.63 | 0.46 | 1.17 | 0.76 | 1.34 | 0.37 | 12.73 |
| 2017 Q2 | 8.69 | 0.45 | 1.19 | 0.78 | 1.34 | 0.38 | 12.84 |
| 2017 Q3 | 8.74 | 0.45 | 1.21 | 0.81 | 1.36 | 0.39 | 12.96 |
| 2017 Q4 | 8.88 | 0.44 | 1.22 | 0.83 | 1.38 | 0.39 | 13.15 |
| 2018 Q1 | 8.94 | 0.44 | 1.23 | 0.82 | 1.41 | 0.39 | 13.21 |
| 2018 Q2 | 9.00 | 0.43 | 1.24 | 0.83 | 1.41 | 0.39 | 13.29 |
| 2018 Q3 | 9.14 | 0.42 | 1.27 | 0.84 | 1.44 | 0.40 | 13.51 |
| 2018 Q4 | 9.12 | 0.41 | 1.27 | 0.87 | 1.46 | 0.41 | 13.54 |
| 2019 Q1 | 9.24 | 0.41 | 1.28 | 0.85 | 1.49 | 0.40 | 13.67 |
| 2019 Q2 | 9.41 | 0.40 | 1.30 | 0.87 | 1.48 | 0.41 | 13.86 |
| 2019 Q3 | 9.44 | 0.40 | 1.32 | 0.88 | 1.50 | 0.43 | 13.95 |
| 2019 Q4 | 9.56 | 0.39 | 1.33 | 0.93 | 1.51 | 0.43 | 14.15 |
| 2020 Q1 | 9.71 | 0.39 | 1.35 | 0.89 | 1.54 | 0.43 | 14.30 |
| 2020 Q2 | 9.78 | 0.375 | 1.34 | 0.82 | 1.54 | 0.42 | 14.27 |
| 2020 Q3 | 9.86 | 0.362 | 1.36 | 0.81 | 1.55 | 0.42 | 14.35 |
| 2020 Q4 | 10.043 | 0.349 | 1.374 | 0.819 | 1.555 | 0.419 | 14.559 |
| 2021 Q1 | 10.160 | 0.335 | 1.382 | 0.770 | 1.584 | 0.413 | 14.644 |
| 2021 Q2 | 10.442 | 0.322 | 1.415 | 0.787 | 1.570 | 0.421 | 14.957 |
| 2021 Q3 | 10.672 | 0.317 | 1.443 | 0.804 | 1.584 | 0.423 | 15.243 |
| 2021 Q4 | 10.930 | 0.318 | 1.458 | 0.856 | 1.576 | 0.438 | 15.576 |
| 2022 Q1 | 11.180 | 0.317 | 1.469 | 0.841 | 1.590 | 0.445 | 15.842 |
| 2022 Q2 | 11.387 | 0.319 | 1.502 | 0.887 | 1.589 | 0.470 | 16.154 |
| 2022 Q3 | 11.669 | 0.322 | 1.524 | 0.925 | 1.574 | 0.491 | 16.505 |
| 2022 Q4 | 11.923 | 0.336 | 1.552 | 0.986 | 1.595 | 0.507 | 16.899 |
| 2023 Q1 | 12.044 | 0.339 | 1.562 | 0.986 | 1.604 | 0.512 | 17.047 |
| 2023 Q2 | 12.014 | 0.340 | 1.582 | 1.031 | 1.569 | 0.527 | 17.063 |
The approval rate for mortgages depends on many factors including the credit quality of the borrower, the loan to value (LTV) ratio, the strenght of the local market & broader industry trends.
| Year | Applications | Closed | % Approved | Rejections | % Rejected |
|---|---|---|---|---|---|
| 2007 | 26,605,695 | 10,441,545 | 39.25% | 16,164,150 | 60.75% |
| 2008 | 17,391,570 | 7,177,262 | 41.27% | 10,214,308 | 58.73% |
| 2009 | 19,493,491 | 8,950,936 | 45.92% | 10,542,555 | 54.08% |
| 2010 | 16,348,557 | 7,863,337 | 48.10% | 8,485,220 | 51.90% |
| 2011 | 14,873,415 | 7,095,262 | 47.70% | 7,778,153 | 52.30% |
| 2012 | 18,691,551 | 9,783,966 | 52.34% | 8,907,585 | 47.66% |
| 2013 | 17,016,159 | 8,706,657 | 51.17% | 8,309,502 | 48.83% |
| 2014 | 11,875,464 | 5,979,766 | 50.35% | 5,895,698 | 49.65% |
This data can be broken down by purchase, refinance, home improvement & multifamily.
| Year | Purchase Apps | Purch Loans | Refi Apps | Refi Loans | Home improvemen Apps | H I Loans | Multifamily Apps | Multifamily Loans | Total Apps | Total Loans |
|---|---|---|---|---|---|---|---|---|---|---|
| 2004 | 9,804 | 6,437 | 16,085 | 7,591 | 2,200 | 964 | 61 | 48 | 28,151 | 15,040 |
| 2005 | 11,685 | 7,391 | 15,907 | 7,107 | 2,544 | 1,096 | 58 | 45 | 30,193 | 15,638 |
| 2006 | 10,929 | 6,740 | 14,046 | 6,091 | 2,481 | 1,140 | 52 | 40 | 27,508 | 14,011 |
| 2007 | 7,609 | 4,663 | 11,566 | 4,818 | 2,218 | 958 | 54 | 41 | 21,448 | 10,480 |
| 2008 | 5,060 | 3,139 | 7,805 | 3,491 | 1,413 | 573 | 43 | 31 | 14,320 | 7,234 |
| 2009 | 4,217 | 2,793 | 9,983 | 5,772 | 832 | 390 | 26 | 19 | 15,057 | 8,974 |
| 2010 | 3,848 | 2,547 | 8,437 | 4,971 | 671 | 342 | 26 | 19 | 12,981 | 7,879 |
| 2011 | 3,650 | 2,430 | 7,422 | 4,330 | 675 | 335 | 35 | 27 | 11,782 | 7,122 |
| 2012 | 4,023 | 2,742 | 10,526 | 6,668 | 779 | 382 | 47 | 37 | 15,375 | 9,828 |
| 2013 | 4,586 | 3,139 | 8,564 | 5,141 | 833 | 425 | 51 | 40 | 14,034 | 8,744 |
| 2014 | 4,679 | 3,248 | 4,526 | 2,370 | 846 | 411 | 46 | 35 | 10,097 | 6,064 |
| 2015 | 5,196 | 3,676 | 5,957 | 3,234 | 926 | 477 | 52 | 41 | 12,132 | 7,428 |
| 2016 | 5,694 | 4,046 | 7,187 | 3,759 | 1,005 | 536 | 50 | 40 | 13,937 | 8,381 |
| 2017 | 6,018 | 4,237 | 4,938 | 2,516 | 1,052 | 548 | 48 | 38 | 12,056 | 7,339 |
The following tables list historical rejection data by year for purchase loans & refinance.
First lien purcahse rejection rate
| Loan & borrower | 2004 | 2005 | 2006 | 2007 | 2008 | 2009 | 2010 | 2011 | 2012 | 2013 | 2014 | 2015 | 2016 | 2017 |
|---|---|---|---|---|---|---|---|---|---|---|---|---|---|---|
| All applicants | 14.4% | 16.0% | 18.0% | 18.7% | 18.0% | 15.5% | 15.6% | 15.8% | 14.9% | 14.4% | 13.3% | 12.1% | 11.5% | 10.8% |
| Asian | 13.7% | 15.9% | 16.9% | 17.5% | 19.2% | 16.3% | 15.9% | 16.5% | 15.8% | 15.3% | 14.1% | 12.7% | 11.6% | 10.6% |
| African American | 23.6% | 26.5% | 30.3% | 33.5% | 30.6% | 25.5% | 24.9% | 26.0% | 26.0% | 25.5% | 23.0% | 20.8% | 19.8% | 18.4% |
| Hispanic white | 18.3% | 21.1% | 25.1% | 29.5% | 28.3% | 22.2% | 21.8% | 21.1% | 20.2% | 20.5% | 18.4% | 16.2% | 15.0% | 13.5% |
| Non-Hispanic white | 11.1% | 12.2% | 12.9% | 13.3% | 14.0% | 12.8% | 13.0% | 13.1% | 12.5% | 12.0% | 11.1% | 10.0% | 9.5% | 8.8% |
| Other minority | 19.4% | 20.8% | 24.0% | 26.7% | 25.5% | 21.2% | 22.0% | 20.9% | 20.8% | 21.2% | 19.0% | 17.2% | 16.6% | 14.8% |
| Conventional: All applicants | 14.6% | 16.3% | 18.5% | 19.0% | 18.3% | 15.8% | 15.2% | 15.1% | 13.6% | 12.9% | 11.9% | 10.8% | 10.2% | 9.6% |
| Conventional: Asian | 13.7% | 16.0% | 17.1% | 17.5% | 19.1% | 15.8% | 14.9% | 15.5% | 14.4% | 14.2% | 13.3% | 11.9% | 10.9% | 10.1% |
| Conventional: African American | 25.0% | 27.8% | 31.9% | 35.7% | 37.6% | 35.8% | 33.7% | 33.2% | 32.0% | 28.5% | 25.1% | 23.3% | 22.0% | 19.3% |
| Conventional: Hispanic white | 18.6% | 21.4% | 25.7% | 30.5% | 32.5% | 26.9% | 24.9% | 24.2% | 22.4% | 21.5% | 18.9% | 17.2% | 15.4% | 13.5% |
| Conventional: Non-Hispanic white | 11.2% | 12.3% | 13.2% | 13.3% | 14.1% | 13.3% | 12.9% | 12.7% | 11.6% | 10.8% | 9.9% | 9.1% | 8.5% | 7.9% |
| Conventional: Other minority | 19.7% | 21.2% | 24.8% | 27.8% | 29.0% | 25.9% | 28.1% | 24.6% | 23.6% | 22.5% | 20.2% | 18.2% | 16.8% | 14.9% |
| Nonconventional: All applicants | 13.3% | 12.5% | 12.1% | 16.2% | 17.4% | 15.3% | 16.0% | 16.5% | 16.3% | 16.8% | 15.8% | 13.9% | 13.4% | 12.8% |
| Nonconventional: Asian | 12.6% | 11.6% | 10.6% | 15.5% | 20.2% | 17.7% | 18.7% | 19.3% | 20.2% | 20.6% | 18.9% | 16.2% | 14.9% | 14.1% |
| Nonconventional: African American | 17.7% | 16.8% | 16.2% | 22.8% | 25.3% | 22.6% | 22.7% | 23.9% | 24.0% | 24.1% | 21.9% | 19.7% | 18.8% | 17.9% |
| Nonconventional: Hispanic white | 16.3% | 17.2% | 15.7% | 20.5% | 23.1% | 20.4% | 20.7% | 19.9% | 19.3% | 19.9% | 18.0% | 15.6% | 14.7% | 13.4% |
| Nonconventional: Non-Hispanic white | 10.7% | 10.2% | 10.0% | 13.1% | 13.9% | 12.5% | 13.0% | 13.6% | 13.7% | 14.1% | 13.4% | 11.7% | 11.2% | 10.6% |
| Nonconventional: Other minority | 16.8% | 16.3% | 15.2% | 18.6% | 20.9% | 18.7% | 18.7% | 18.8% | 18.9% | 20.1% | 17.9% | 16.2% | 16.4% | 14.7% |
Refinancing rejection rate
| Loan & borrower | 2004 | 2005 | 2006 | 2007 | 2008 | 2009 | 2010 | 2011 | 2012 | 2013 | 2014 | 2015 | 2016 | 2017 |
|---|---|---|---|---|---|---|---|---|---|---|---|---|---|---|
| All applicants | 29.5% | 32.6% | 35.4% | 39.6% | 37.7% | 24.0% | 23.3% | 23.8% | 19.9% | 23.3% | 31.0% | 27.2% | 29.9% | 26.4% |
| Asian | 18.8% | 23.5% | 27.5% | 32.6% | 32.5% | 21.4% | 19.5% | 20.1% | 17.3% | 21.0% | 28.1% | 23.8% | 25.1% | 24.8% |
| African American | 39.9% | 42.2% | 44.1% | 52.0% | 56.0% | 42.2% | 41.7% | 40.0% | 32.8% | 35.0% | 45.8% | 43.1% | 45.9% | 39.0% |
| Hispanic white | 28.7% | 30.1% | 33.2% | 43.0% | 49.1% | 36.4% | 33.4% | 33.2% | 27.5% | 29.6% | 36.7% | 32.5% | 33.8% | 30.2% |
| Non-Hispanic white | 24.1% | 26.9% | 30.1% | 33.7% | 32.2% | 20.7% | 20.6% | 21.3% | 17.8% | 20.5% | 27.5% | 24.1% | 26.9% | 22.9% |
| Other minority | 33.7% | 35.5% | 40.6% | 52.0% | 57.4% | 37.3% | 35.4% | 34.4% | 30.0% | 32.1% | 41.6% | 40.1% | 44.2% | 37.2% |
| Conventional: All applicants | 30.1% | 32.9% | 35.6% | 39.9% | 37.0% | 22.1% | 21.2% | 22.3% | 19.4% | 22.5% | 29.6% | 26.4% | 28.8% | 24.0% |
| Conventional: Asian | 18.8% | 23.5% | 27.5% | 32.5% | 31.5% | 20.2% | 18.5% | 19.4% | 17.0% | 20.5% | 27.2% | 23.2% | 23.7% | 23.5% |
| Conventional: African American | 41.7% | 43.0% | 44.7% | 53.3% | 60.9% | 48.6% | 41.4% | 40.6% | 34.8% | 36.0% | 47.0% | 47.7% | 52.3% | 39.3% |
| Conventional: Hispanic white | 29.3% | 30.2% | 33.3% | 43.2% | 50.2% | 38.9% | 33.6% | 33.5% | 28.9% | 30.6% | 37.3% | 34.8% | 35.2% | 30.0% |
| Conventional: Non-Hispanic white | 24.6% | 27.1% | 30.4% | 33.9% | 31.5% | 19.1% | 18.9% | 20.1% | 17.4% | 19.9% | 26.2% | 23.2% | 25.7% | 20.7% |
| Conventional: Other minority | 34.5% | 35.7% | 40.9% | 52.6% | 59.4% | 38.4% | 34.8% | 34.4% | 31.1% | 32.6% | 40.9% | 41.2% | 45.9% | 34.5% |
| Nonconventional: All applicants | 15.0% | 20.1% | 21.9% | 31.6% | 40.9% | 31.1% | 33.3% | 32.2% | 22.2% | 26.7% | 36.5% | 29.6% | 33.0% | 32.4% |
| Nonconventional: Asian | 15.0% | 20.0% | 22.0% | 38.5% | 48.9% | 37.2% | 34.2% | 32.7% | 22.2% | 26.9% | 37.5% | 28.8% | 36.7% | 34.2% |
| Nonconventional: African American | 17.5% | 23.6% | 24.6% | 33.7% | 43.5% | 35.1% | 42.2% | 39.1% | 29.5% | 33.1% | 43.9% | 37.5% | 38.8% | 38.6% |
| Nonconventional: Hispanic white | 15.7% | 23.6% | 26.3% | 34.6% | 43.4% | 31.4% | 33.0% | 32.3% | 23.3% | 26.6% | 34.5% | 27.1% | 30.5% | 30.5% |
| Nonconventional: Non-Hispanic white | 12.0% | 17.6% | 19.7% | 28.3% | 36.1% | 27.4% | 29.3% | 29.0% | 19.7% | 23.8% | 33.7% | 26.9% | 31.0% | 29.7% |
| Nonconventional: Other minority | 15.2% | 25.8% | 22.2% | 34.8% | 45.4% | 34.1% | 37.0% | 34.4% | 26.6% | 30.6% | 43.8% | 37.6% | 41.2% | 41.7% |
This data can be broken down further based on the type of financial institution offering the loan. The following table shows HMDA data for 2017
| Institution Size & Loan Purpose | Small bank | Large bank | Credit union | Affiliated mortgage company | Independent mortgage company | All |
|---|---|---|---|---|---|---|
| Number of institutions | 1,994 | 1,117 | 1,706 | 99 | 936 | 5,852 |
| Applications (thousands) | 627 | 3,490 | 1,136 | 351 | 6,452 | 12,056 |
| Originations (thousands) | 461 | 2,204 | 709 | 254 | 3,710 | 7,339 |
| Approval rate | 73.5% | 63.2% | 62.4% | 72.4% | 57.5% | 60.9% |
| Rejection rate | 26.5% | 36.8% | 37.6% | 27.6% | 42.5% | 39.1% |
| Purchases (thousands) | 13 | 1,074 | 17 | 125 | 857 | 2,087 |
| Number of institutions with fewer than 100 loans | 870 | 314 | 781 | 28 | 125 | 2,118 |
| Institutions with fewer than 100 loans: Originations (thousands) | 46.7 | 16.2 | 35.8 | 0.9 | 4.1 | 103.7 |
| Number of institutions with fewer than 25 loans | 97 | 43 | 198 | 14 | 69 | 421 |
| Institutions with fewer than 25 loans: Originations (thousands) | 1.6 | 0.6 | 2.7 | 0.0 | 0.5 | 5.5 |
| Number of home-purchase loans (thousands) | 196 | 974 | 237 | 170 | 2,017 | 3,594 |
| Home-purchase loans: Conventional | 73.4% | 79.6% | 85.4% | 61.5% | 52.8% | 63.7% |
| Home-purchase loans: Higher-priced share of conventional loans | 9.5% | 2.7% | 4.3% | 3.1% | 4.6% | 4.2% |
| Home-purchase loans: LMI borrower | 28.3% | 22.0% | 25.3% | 28.7% | 28.1% | 26.3% |
| Home-purchase loans: LMI neighborhood | 13.6% | 13.3% | 14.8% | 15.3% | 17.9% | 16.1% |
| Home-purchase loans: Non-Hispanic White | 80.0% | 67.7% | 67.0% | 68.0% | 61.5% | 64.9% |
| Home-purchase loans: Minority borrower | 11.6% | 19.4% | 16.6% | 17.9% | 25.0% | 21.9% |
| Home-purchase loans: Sold | 76.2% | 69.3% | 44.9% | 94.7% | 97.8% | 85.2% |
| Number of refinance loans (thousands) | 86 | 612 | 209 | 53 | 1,210 | 2,170 |
| Refinance loans: Conventional | 86.3% | 92.1% | 94.8% | 87.0% | 61.9% | 75.1% |
| Refinance loans: Higher-priced share of conventional loans | 9.9% | 1.7% | 3.0% | 0.8% | 1.6% | 2.1% |
| Refinance loans: LMI borrower | 22.9% | 21.7% | 25.1% | 23.6% | 23.1% | 22.9% |
| Refinance loans: LMI neighborhood | 11.8% | 13.3% | 16.0% | 12.6% | 17.0% | 15.5% |
| Refinance loans: Non-Hispanic white | 83.9% | 69.5% | 67.9% | 70.7% | 57.5% | 63.3% |
| Refinance loans: Minority borrower | 7.8% | 17.1% | 16.4% | 13.4% | 19.3% | 17.8% |
| Refinance loans: Sold | 63.0% | 66.5% | 32.2% | 94.0% | 97.9% | 80.9% |
This table shows 2018 loan denial data from HMDA.
| Denial Reason | Count | Percent of Denials With a Reason |
|---|---|---|
| Collateral | 220,014 | 15.58% |
| Credit application incomplete | 179,330 | 12.70% |
| Credit history | 392,096 | 27.77% |
| Debt-to-income ratio | 384,777 | 27.25% |
| Employment history | 21,008 | 1.49% |
| Insufficient cash (downpayment, closing costs) | 37,848 | 2.68% |
| Mortgage insurance denied | 1,277 | 0.09% |
| Other | 126,294 | 8.94% |
| Unverifiable information | 49,326 | 3.49% |
The following tables highlights 2017 HMDA data for why first liens were rejected. The first table is for first-lien home purchases, while the second table is for refinance loans.
Home Purchases
| Loan type and borrower race and ethnicity | Debt-to-income ratio | Employment history | Credit history | Collateral | Insufficient cash | Unverifiable information | Incomplete credit application | Mortgage insurance denied | Other | No reason given |
|---|---|---|---|---|---|---|---|---|---|---|
| Conventional and nonconventional: All applicants | 22.8% | 3.6% | 17.0% | 14.4% | 6.8% | 5.8% | 10.2% | 0.3% | 8.9% | 27.9% |
| Conventional and nonconventional: Asian | 28.5% | 4.5% | 9.6% | 11.7% | 9.0% | 10.3% | 11.6% | 0.3% | 9.9% | 25.7% |
| Conventional and nonconventional: Black or African American | 25.1% | 3.1% | 22.7% | 10.7% | 7.4% | 4.7% | 6.9% | 0.3% | 9.3% | 30.1% |
| Conventional and nonconventional: Hispanic white | 24.3% | 4.1% | 14.9% | 12.0% | 6.8% | 7.1% | 7.3% | 0.3% | 10.3% | 32.3% |
| Conventional and nonconventional: Non-Hispanic white | 21.6% | 3.6% | 16.8% | 15.5% | 6.5% | 5.4% | 10.0% | 0.3% | 8.6% | 28.5% |
| Conventional and nonconventional: Other minority | 23.9% | 3.9% | 18.9% | 12.2% | 7.5% | 5.4% | 8.4% | 0.4% | 9.5% | 29.3% |
| Conventional only: All applicants | 24.6% | 3.2% | 16.8% | 16.9% | 7.6% | 6.4% | 11.2% | 0.4% | 8.9% | 23.2% |
| Conventional only: Asian | 29.0% | 4.3% | 9.4% | 12.3% | 9.6% | 10.7% | 11.9% | 0.3% | 10.0% | 23.9% |
| Conventional only: Black or African American | 27.2% | 2.7% | 26.2% | 14.4% | 8.3% | 4.6% | 6.9% | 0.6% | 10.4% | 22.2% |
| Conventional only: Hispanic white | 26.4% | 3.3% | 16.0% | 15.0% | 8.1% | 7.3% | 7.3% | 0.5% | 11.3% | 26.7% |
| Conventional only: Non-Hispanic white | 23.6% | 3.2% | 16.8% | 17.8% | 7.2% | 6.0% | 10.9% | 0.4% | 8.3% | 24.1% |
| Conventional only: Other minority | 26.5% | 3.8% | 21.7% | 12.8% | 8.4% | 6.0% | 7.9% | 0.7% | 10.3% | 24.1% |
| Nonconventional only: All applicants | 20.5% | 4.1% | 17.2% | 11.3% | 5.9% | 5.1% | 9.0% | 0.1% | 8.9% | 33.9% |
| Nonconventional only: Asian | 26.0% | 5.4% | 10.7% | 9.0% | 6.3% | 8.7% | 10.2% | 0.1% | 9.6% | 33.5% |
| Nonconventional only: Black or African American | 23.8% | 3.4% | 20.6% | 8.6% | 6.9% | 4.8% | 6.9% | 0.1% | 8.6% | 34.8% |
| Nonconventional only: Hispanic white | 22.6% | 4.7% | 14.0% | 9.5% | 5.8% | 6.9% | 7.4% | 0.1% | 9.5% | 37.0% |
| Nonconventional only: Non-Hispanic white | 18.6% | 4.3% | 16.8% | 12.2% | 5.5% | 4.6% | 8.8% | 0.2% | 9.1% | 34.9% |
| Nonconventional only: Other minority | 21.5% | 3.9% | 16.3% | 11.5% | 6.6% | 4.8% | 8.8% | 0.1% | 8.8% | 34.2% |
Refinances
| Loan type and borrower race and ethnicity | Debt-to-income ratio | Employment history | Credit history | Collateral | Insufficient cash | Unverifiable information | Incomplete credit application | Mortgage insurance denied | Other | No reason given |
|---|---|---|---|---|---|---|---|---|---|---|
| Conventional and nonconventional: All applicants | 17.9% | 0.9% | 18.6% | 13.3% | 2.8% | 2.7% | 13.7% | 0.1% | 8.2% | 33.8% |
| Conventional and nonconventional: Asian | 27.2% | 1.3% | 15.9% | 9.5% | 3.9% | 4.8% | 11.8% | 0.0% | 9.1% | 32.2% |
| Conventional and nonconventional: Black or African American | 14.5% | 0.5% | 22.3% | 11.1% | 3.0% | 1.7% | 9.1% | 0.1% | 8.5% | 41.6% |
| Conventional and nonconventional: Hispanic white | 23.6% | 1.2% | 22.8% | 9.2% | 3.6% | 3.8% | 9.2% | 0.1% | 10.4% | 33.0% |
| Conventional and nonconventional: Non-Hispanic white | 17.5% | 1.0% | 18.4% | 13.5% | 2.7% | 2.7% | 12.1% | 0.1% | 8.1% | 35.6% |
| Conventional and nonconventional: Other minority | 16.1% | 0.8% | 19.4% | 9.3% | 2.7% | 2.4% | 10.0% | 0.0% | 9.0% | 42.6% |
| Conventional only: All applicants | 22.2% | 1.1% | 20.7% | 13.7% | 3.1% | 3.3% | 13.8% | 0.1% | 9.0% | 27.6% |
| Conventional only: Asian | 30.0% | 1.4% | 16.2% | 9.9% | 4.3% | 5.3% | 11.8% | 0.1% | 9.4% | 28.6% |
| Conventional only: Black or African American | 19.6% | 0.6% | 27.3% | 12.1% | 3.1% | 2.1% | 8.9% | 0.1% | 10.2% | 32.3% |
| Conventional only: Hispanic white | 28.0% | 1.2% | 25.1% | 9.8% | 3.9% | 4.3% | 8.5% | 0.1% | 11.1% | 27.4% |
| Conventional only: Non-Hispanic white | 21.8% | 1.1% | 20.6% | 14.6% | 3.0% | 3.3% | 12.2% | 0.1% | 8.9% | 28.5% |
| Conventional only: Other minority | 21.9% | 1.0% | 23.9% | 10.4% | 3.3% | 3.1% | 10.3% | 0.0% | 11.0% | 31.4% |
| Nonconventional only: All applicants | 9.7% | 0.7% | 14.7% | 12.5% | 2.3% | 1.6% | 13.6% | 0.0% | 6.7% | 45.7% |
| Nonconventional only: Asian | 13.7% | 0.8% | 14.4% | 7.6% | 1.9% | 2.5% | 11.8% | 0.0% | 7.9% | 49.9% |
| Nonconventional only: Black or African American | 8.9% | 0.4% | 16.7% | 10.0% | 2.9% | 1.3% | 9.2% | 0.0% | 6.7% | 51.8% |
| Nonconventional only: Hispanic white | 12.0% | 1.0% | 16.8% | 7.9% | 2.9% | 2.6% | 10.9% | 0.1% | 8.6% | 47.6% |
| Nonconventional only: Non-Hispanic white | 8.5% | 0.7% | 14.0% | 11.4% | 2.1% | 1.5% | 11.9% | 0.0% | 6.4% | 50.2% |
| Nonconventional only: Other minority | 8.1% | 0.4% | 13.2% | 7.8% | 1.9% | 1.4% | 9.7% | 0.0% | 6.3% | 58.0% |
The following tables list mortgage preapproval requests in thousands. The first table lists annual data, while the second table lists monthly data. Between 2004 & 2017 22.41% of preapproval requests were rejected while 77.59% were approved. About 17.86% of prospective homebuyers who were preapproved did not purchase a home using the preapproved loan. Roughly 19.53% of homebuyers sought preapproval before applying for a loan.
Annual Preapproval Data
| Year | Purchased loans | Preapproval requests | Approved, not used | Denied |
|---|---|---|---|---|
| 2004 | 5,142 | 1,068 | 167 | 171 |
| 2005 | 5,868 | 1,260 | 166 | 231 |
| 2006 | 6,236 | 1,175 | 189 | 222 |
| 2007 | 4,821 | 1,065 | 197 | 235 |
| 2008 | 2,935 | 735 | 99 | 177 |
| 2009 | 4,301 | 559 | 61 | 155 |
| 2010 | 3,231 | 440 | 53 | 117 |
| 2011 | 2,939 | 429 | 55 | 130 |
| 2012 | 3,163 | 474 | 64 | 149 |
| 2013 | 2,788 | 474 | 69 | 123 |
| 2014 | 1,800 | 496 | 64 | 125 |
| 2015 | 2,126 | 531 | 63 | 115 |
| 2016 | 2,232 | 514 | 60 | 115 |
| 2017 | 2,087 | 481 | 36 | 107 |
Monthly Preapproval Data
| Month | Purchased loans | Preapproval requests | Approved, not used | Denied |
|---|---|---|---|---|
| Jan 2004 | 327 | 33 | 4 | 7 |
| Feb 2004 | 329 | 48 | 4 | 10 |
| Mar 2004 | 436 | 73 | 6 | 14 |
| Apr 2004 | 499 | 85 | 9 | 15 |
| May 2004 | 465 | 97 | 13 | 16 |
| June 2004 | 508 | 117 | 17 | 17 |
| July 2004 | 400 | 111 | 19 | 16 |
| Aug 2004 | 400 | 114 | 20 | 18 |
| Sept 2004 | 430 | 103 | 19 | 15 |
| Oct 2004 | 401 | 98 | 19 | 14 |
| Nov 2004 | 395 | 92 | 17 | 14 |
| Dec 2004 | 551 | 97 | 19 | 14 |
| Jan 2005 | 424 | 74 | 10 | 17 |
| Feb 2005 | 331 | 79 | 9 | 18 |
| Mar 2005 | 475 | 102 | 11 | 22 |
| Apr 2005 | 446 | 103 | 12 | 22 |
| May 2005 | 452 | 113 | 15 | 22 |
| June 2005 | 522 | 121 | 14 | 21 |
| July 2005 | 503 | 110 | 15 | 20 |
| Aug 2005 | 587 | 123 | 16 | 22 |
| Sept 2005 | 576 | 119 | 18 | 18 |
| Oct 2005 | 530 | 104 | 16 | 17 |
| Nov 2005 | 488 | 105 | 14 | 17 |
| Dec 2005 | 534 | 108 | 17 | 15 |
| Jan 2006 | 441 | 73 | 12 | 16 |
| Feb 2006 | 419 | 75 | 10 | 15 |
| Mar 2006 | 517 | 100 | 12 | 20 |
| Apr 2006 | 439 | 90 | 12 | 18 |
| May 2006 | 499 | 109 | 18 | 19 |
| June 2006 | 605 | 121 | 22 | 20 |
| July 2006 | 470 | 115 | 22 | 20 |
| Aug 2006 | 574 | 120 | 21 | 23 |
| Sept 2006 | 617 | 102 | 16 | 19 |
| Oct 2006 | 528 | 95 | 15 | 19 |
| Nov 2006 | 552 | 89 | 16 | 17 |
| Dec 2006 | 575 | 85 | 15 | 15 |
| Jan 2007 | 481 | 74 | 15 | 18 |
| Feb 2007 | 419 | 74 | 12 | 18 |
| Mar 2007 | 529 | 94 | 14 | 22 |
| Apr 2007 | 442 | 93 | 17 | 21 |
| May 2007 | 452 | 102 | 17 | 23 |
| June 2007 | 528 | 104 | 16 | 22 |
| July 2007 | 415 | 103 | 17 | 23 |
| Aug 2007 | 403 | 108 | 20 | 23 |
| Sept 2007 | 325 | 83 | 17 | 17 |
| Oct 2007 | 329 | 86 | 19 | 19 |
| Nov 2007 | 249 | 77 | 18 | 16 |
| Dec 2007 | 248 | 69 | 16 | 14 |
| Jan 2008 | 227 | 62 | 15 | 16 |
| Feb 2008 | 224 | 64 | 13 | 17 |
| Mar 2008 | 270 | 71 | 12 | 19 |
| Apr 2008 | 256 | 71 | 12 | 18 |
| May 2008 | 233 | 66 | 6 | 15 |
| June 2008 | 235 | 69 | 6 | 15 |
| July 2008 | 232 | 70 | 7 | 15 |
| Aug 2008 | 202 | 64 | 7 | 15 |
| Sept 2008 | 506 | 58 | 6 | 14 |
| Oct 2008 | 216 | 56 | 6 | 14 |
| Nov 2008 | 162 | 42 | 5 | 11 |
| Dec 2008 | 171 | 41 | 4 | 9 |
| Jan 2009 | 216 | 33 | 4 | 11 |
| Feb 2009 | 259 | 35 | 4 | 11 |
| Mar 2009 | 365 | 43 | 4 | 15 |
| Apr 2009 | 1,083 | 45 | 4 | 15 |
| May 2009 | 321 | 48 | 4 | 14 |
| June 2009 | 372 | 56 | 5 | 16 |
| July 2009 | 317 | 58 | 7 | 16 |
| Aug 2009 | 264 | 53 | 6 | 14 |
| Sept 2009 | 253 | 51 | 6 | 14 |
| Oct 2009 | 249 | 51 | 6 | 12 |
| Nov 2009 | 255 | 46 | 6 | 9 |
| Dec 2009 | 349 | 41 | 6 | 8 |
| Jan 2010 | 269 | 30 | 4 | 9 |
| Feb 2010 | 184 | 32 | 3 | 10 |
| Mar 2010 | 231 | 44 | 4 | 13 |
| Apr 2010 | 238 | 48 | 4 | 13 |
| May 2010 | 226 | 44 | 4 | 10 |
| June 2010 | 261 | 47 | 5 | 10 |
| July 2010 | 248 | 34 | 4 | 9 |
| Aug 2010 | 285 | 35 | 4 | 10 |
| Sept 2010 | 304 | 33 | 4 | 9 |
| Oct 2010 | 316 | 31 | 4 | 8 |
| Nov 2010 | 313 | 30 | 5 | 8 |
| Dec 2010 | 358 | 33 | 5 | 8 |
| Jan 2011 | 298 | 25 | 4 | 9 |
| Feb 2011 | 205 | 28 | 3 | 11 |
| Mar 2011 | 204 | 37 | 4 | 13 |
| Apr 2011 | 189 | 36 | 4 | 12 |
| May 2011 | 194 | 40 | 4 | 12 |
| June 2011 | 233 | 44 | 5 | 13 |
| July 2011 | 208 | 39 | 5 | 11 |
| Aug 2011 | 265 | 42 | 5 | 12 |
| Sept 2011 | 273 | 37 | 5 | 10 |
| Oct 2011 | 271 | 36 | 6 | 10 |
| Nov 2011 | 283 | 32 | 4 | 9 |
| Dec 2011 | 317 | 34 | 5 | 9 |
| Jan 2012 | 239 | 28 | 4 | 10 |
| Feb 2012 | 254 | 33 | 6 | 12 |
| Mar 2012 | 252 | 38 | 5 | 14 |
| Apr 2012 | 265 | 40 | 4 | 14 |
| May 2012 | 245 | 47 | 6 | 15 |
| June 2012 | 247 | 46 | 6 | 14 |
| July 2012 | 267 | 46 | 7 | 14 |
| Aug 2012 | 286 | 46 | 6 | 13 |
| Sept 2012 | 266 | 38 | 5 | 11 |
| Oct 2012 | 308 | 41 | 5 | 13 |
| Nov 2012 | 250 | 36 | 5 | 11 |
| Dec 2012 | 286 | 35 | 5 | 10 |
| Jan 2013 | 285 | 30 | 5 | 9 |
| Feb 2013 | 245 | 29 | 4 | 9 |
| Mar 2013 | 266 | 37 | 5 | 11 |
| Apr 2013 | 267 | 43 | 6 | 12 |
| May 2013 | 338 | 46 | 6 | 12 |
| June 2013 | 240 | 45 | 6 | 11 |
| July 2013 | 253 | 49 | 7 | 12 |
| Aug 2013 | 228 | 47 | 7 | 11 |
| Sept 2013 | 187 | 40 | 7 | 10 |
| Oct 2013 | 184 | 40 | 6 | 10 |
| Nov 2013 | 141 | 33 | 6 | 8 |
| Dec 2013 | 153 | 34 | 5 | 8 |
| Jan 2014 | 133 | 30 | 5 | 10 |
| Feb 2014 | 109 | 31 | 5 | 10 |
| Mar 2014 | 115 | 38 | 5 | 12 |
| Apr 2014 | 131 | 43 | 6 | 12 |
| May 2014 | 147 | 46 | 6 | 11 |
| June 2014 | 157 | 49 | 6 | 11 |
| July 2014 | 178 | 49 | 5 | 12 |
| Aug 2014 | 167 | 46 | 5 | 11 |
| Sept 2014 | 166 | 45 | 6 | 11 |
| Oct 2014 | 170 | 45 | 6 | 10 |
| Nov 2014 | 137 | 35 | 5 | 7 |
| Dec 2014 | 189 | 38 | 5 | 8 |
| Jan 2015 | 145 | 31 | 4 | 9 |
| Feb 2015 | 135 | 32 | 3 | 9 |
| Mar 2015 | 177 | 43 | 5 | 11 |
| Apr 2015 | 204 | 46 | 4 | 12 |
| May 2015 | 172 | 48 | 5 | 10 |
| June 2015 | 208 | 55 | 6 | 11 |
| July 2015 | 234 | 55 | 7 | 11 |
| Aug 2015 | 186 | 49 | 6 | 9 |
| Sept 2015 | 189 | 47 | 6 | 9 |
| Oct 2015 | 187 | 45 | 6 | 9 |
| Nov 2015 | 140 | 37 | 6 | 7 |
| Dec 2015 | 149 | 42 | 5 | 8 |
| Jan 2016 | 136 | 31 | 5 | 8 |
| Feb 2016 | 138 | 34 | 4 | 10 |
| Mar 2016 | 166 | 43 | 5 | 12 |
| Apr 2016 | 168 | 45 | 5 | 11 |
| May 2016 | 168 | 49 | 6 | 11 |
| June 2016 | 202 | 55 | 7 | 11 |
| July 2016 | 191 | 49 | 6 | 9 |
| Aug 2016 | 215 | 51 | 6 | 11 |
| Sept 2016 | 214 | 43 | 5 | 9 |
| Oct 2016 | 217 | 39 | 4 | 8 |
| Nov 2016 | 205 | 37 | 3 | 8 |
| Dec 2016 | 213 | 38 | 3 | 7 |
| Jan 2017 | 178 | 30 | 3 | 8 |
| Feb 2017 | 133 | 30 | 2 | 9 |
| Mar 2017 | 164 | 42 | 3 | 11 |
| Apr 2017 | 151 | 40 | 2 | 10 |
| May 2017 | 177 | 47 | 3 | 11 |
| June 2017 | 195 | 50 | 3 | 10 |
| July 2017 | 180 | 44 | 3 | 9 |
| Aug 2017 | 199 | 47 | 3 | 9 |
| Sept 2017 | 170 | 40 | 3 | 7 |
| Oct 2017 | 184 | 40 | 3 | 8 |
| Nov 2017 | 184 | 37 | 3 | 7 |
| Dec 2017 | 172 | 35 | 3 | 6 |
A credit score of 720 or above is considered good, while a score of 760 or above is considered excellent. Generally buyers who are considering a conventional mortgage should have a credit score of at least 620. VA loans typically require a 620 credit score, though some lenders will loan to borrowers as low as 580. Home buyers who have scores as low as 580 may qualify for FHA loans with a 3.5% down payment. Credit scores as low as 500 can qualify for some FHA loans if they put 10% down. USDA loans typically require a minimum credit score of 640. Borrowers with lower credit scores are typically charged higher interest rates to compensate for the additional credit risk. The term for this is "loan-level pricing." A credit score difference of 100 points can lead to a quarter percent different interest rate. Meaning if your credit score improved 100 points you would be likely to get a discount on the loan APR of 0.25%.
The following graphics show a breakdown of recent mortgages by credit score & the scores associated with various percentiles.
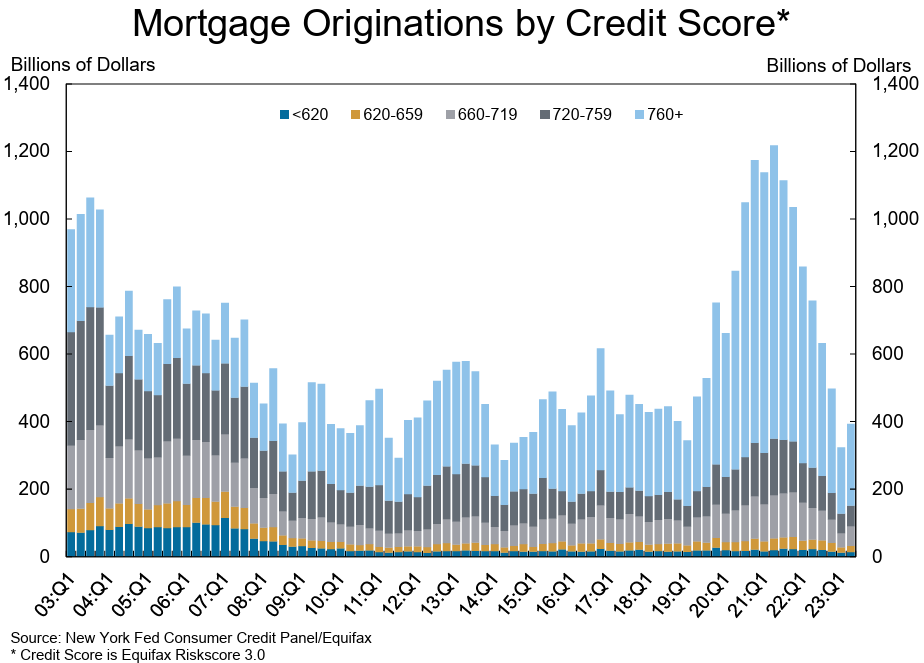
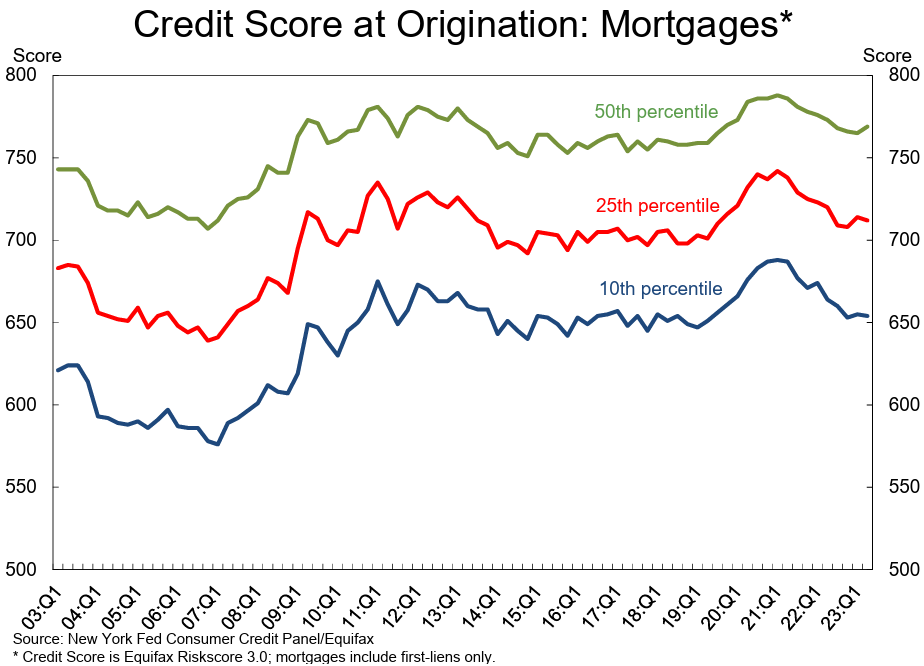
Here are the top 25 loan originators for 2017 based on HMDA data with their home loan volumes published in thousands. The first table shows aggregate data, while the second table shows home purchase loans& the third table shows data for refinances.
Total Mortgage Originations
| Financial Institution | Classification | Loan Originations | Total Purchases |
|---|---|---|---|
| Quicken Loans | Independent Mortgage Company | 396 | 0 |
| Wells Fargo Bank, NA | Large bank | 312 | 481 |
| JPMorgan Chase Bank, NA | Large bank | 155 | 189 |
| loanDepot.com, LLC | Independent Mortgage Company | 135 | 0 |
| Caliber Home Loans, Inc. | Independent Mortgage Company | 118 | 48 |
| Bank of America, NA | Large bank | 111 | 24 |
| United Shore Financial Service | Independent Mortgage Company | 105 | 0 |
| US Bank, NA | Large bank | 96 | 133 |
| Fairway Independent Mort Corp | Independent Mortgage Company | 90 | 0 |
| Flagstar Bank, FSB | Large bank | 87 | 37 |
| Freedom Mortgage Corporation | Independent Mortgage Company | 80 | 95 |
| Navy Federal Credit Union | Credit union | 71 | 0 |
| Guild Mortgage Company | Independent Mortgage Company | 66 | 2 |
| Nationstar Mortgage | Independent Mortgage Company | 65 | 24 |
| USAA Federal Savings Bank | Large bank | 63 | 0 |
| PrimeLending | Affiliated mortgage company | 60 | 1 |
| Guaranteed Rate, Inc. | Independent Mortgage Company | 60 | 0 |
| Movement Mortgage, LLC | Independent Mortgage Company | 60 | 0 |
| PNC Bank, NA | Large bank | 58 | 0 |
| Finance of America Mortgage | Independent Mortgage Company | 54 | 0 |
| HomeBridge Financial Services | Independent Mortgage Company | 48 | 0 |
| Stearns Lending | Independent Mortgage Company | 47 | 13 |
| Mortgage Research Center | Independent Mortgage Company | 46 | 0 |
| Academy Mortgage Corporation | Independent Mortgage Company | 44 | 1 |
| DITECH Financial LLC | Independent Mortgage Company | 40 | 42 |
| Top 25 institutions | ... | 2,465 | 1,091 |
| All institutions | ... | 7,339 | 2,087 |
Home Purchase Loans
| Lender | Institution type | Loans | Conventional | Higher-priced | LMI borrower | LMI neighborhood | Non-Hispanic white | Minority borrower | Sold |
|---|---|---|---|---|---|---|---|---|---|
| Quicken Loans | Independent mortgage company | 105 | 64.9% | 0.6% | 28.3% | 17.4% | 48.7% | 11.8% | 99.9% |
| Wells Fargo Bank, NA | Large bank | 136 | 90.3% | 3.1% | 16.2% | 12.1% | 64.2% | 21.9% | 73.3% |
| JPMorgan Chase Bank, NA | Large bank | 56 | 96.8% | 0.6% | 13.5% | 10.8% | 59.5% | 26.0% | 60.5% |
| loanDepot.com, LLC | Independent mortgage company | 40 | 57.1% | 4.7% | 19.6% | 16.6% | 52.4% | 29.9% | 99.1% |
| Caliber Home Loans, Inc. | Independent mortgage company | 78 | 57.1% | 7.7% | 29.0% | 19.0% | 58.9% | 26.9% | 99.7% |
| Bank of America, NA | Large bank | 45 | 93.9% | 0.2% | 13.3% | 11.1% | 54.6% | 30.1% | 31.3% |
| United Shore Financial Service | Independent mortgage company | 56 | 81.8% | 2.1% | 26.8% | 17.8% | 59.9% | 30.5% | 99.8% |
| US Bank, NA | Large bank | 35 | 85.3% | 0.7% | 25.1% | 13.9% | 72.0% | 15.3% | 76.1% |
| Fairway Independent Mort Corp | Independent mortgage company | 67 | 56.5% | 5.5% | 30.4% | 17.7% | 72.1% | 19.7% | 99.9% |
| Flagstar Bank, FSB | Large bank | 46 | 55.7% | 2.8% | 25.0% | 15.7% | 62.8% | 27.7% | 95.4% |
| Freedom Mortgage Corporation | Independent mortgage company | 21 | 37.8% | 1.9% | 27.1% | 18.7% | 55.9% | 31.0% | 99.4% |
| Navy Federal Credit Union | Credit union | 36 | 38.1% | 22.9% | 19.4% | 13.9% | 54.6% | 25.9% | 56.6% |
| Guild Mortgage Company | Independent mortgage company | 44 | 52.1% | 6.0% | 28.6% | 20.8% | 57.8% | 21.0% | 99.9% |
| Nationstar Mortgage | Independent mortgage company | 1 | 79.1% | 1.7% | 14.2% | 13.3% | 61.6% | 17.6% | 92.1% |
| USAA Federal Savings Bank | Large bank | 44 | 34.5% | 0.3% | 15.3% | 12.5% | 65.8% | 15.6% | 99.6% |
| PrimeLending | Affiliated mortgage company | 45 | 60.5% | 5.6% | 29.1% | 16.2% | 68.6% | 18.6% | 98.8% |
| Guaranteed Rate, Inc. | Independent mortgage company | 39 | 75.9% | 2.0% | 21.7% | 15.6% | 69.2% | 18.1% | 100.0% |
| Movement Mortgage, LLC | Independent mortgage company | 48 | 51.9% | 7.7% | 32.9% | 19.2% | 67.6% | 24.3% | 99.9% |
| PNC Bank, NA | Large bank | 16 | 80.9% | 0.0% | 28.2% | 14.2% | 61.0% | 14.8% | 78.3% |
| Finance of America Mortgage | Independent mortgage company | 33 | 54.7% | 3.5% | 23.7% | 20.2% | 60.4% | 22.8% | 99.7% |
| HomeBridge Financial Services | Independent mortgage company | 28 | 52.0% | 3.5% | 25.3% | 19.1% | 53.8% | 32.4% | 99.8% |
| Stearns Lending | Independent mortgage company | 29 | 50.3% | 3.2% | 25.4% | 18.9% | 57.9% | 29.2% | 100.0% |
| Mortgage Research Center | Independent mortgage company | 40 | 1.4% | 0.2% | 27.6% | 15.9% | 62.1% | 22.1% | 100.0% |
| Academy Mortgage Corporation | Independent mortgage company | 31 | 53.0% | 9.9% | 29.8% | 19.3% | 68.8% | 22.4% | 99.8% |
| DITECH Financial LLC | Independent mortgage company | 4 | 65.2% | 1.7% | 25.0% | 15.9% | 63.3% | 27.6% | 99.6% |
| Top 25 institutions | ... | 1,124 | 63.8% | 3.5% | 24.0% | 16.0% | 61.1% | 22.7% | 89.1% |
| All institutions | ... | 3,594 | 63.7% | 4.2% | 26.3% | 16.1% | 64.9% | 21.9% | 85.2% |
Mortgage Refinance Lenders
| Lender | Institution type | Loans | Conventional | Higher-priced | LMI borrower | LMI neighborhood | Non-Hispanic white | Minority borrower | Sold |
|---|---|---|---|---|---|---|---|---|---|
| Quicken Loans | Independent mortgage company | 269 | 70.7% | 0.1% | 27.9% | 16.2% | 41.8% | 9.4% | 99.9% |
| Wells Fargo Bank, NA | Large bank | 101 | 93.7% | 1.8% | 22.2% | 14.5% | 64.6% | 21.3% | 87.5% |
| JPMorgan Chase Bank, NA | Large bank | 72 | 94.4% | 0.9% | 22.3% | 13.4% | 65.5% | 21.8% | 76.4% |
| loanDepot.com, LLC | Independent mortgage company | 83 | 51.9% | 3.4% | 27.3% | 17.1% | 63.1% | 18.2% | 99.1% |
| Caliber Home Loans, Inc. | Independent mortgage company | 26 | 70.4% | 2.4% | 20.8% | 15.7% | 63.3% | 21.4% | 99.9% |
| Bank of America, NA | Large bank | 47 | 99.6% | 0.4% | 19.4% | 13.4% | 60.6% | 24.9% | 41.5% |
| United Shore Financial Service | Independent mortgage company | 37 | 83.9% | 0.3% | 18.2% | 15.2% | 60.2% | 28.8% | 99.9% |
| US Bank, NA | Large bank | 37 | 96.0% | 2.8% | 24.7% | 15.9% | 70.7% | 14.5% | 46.3% |
| Fairway Independent Mort Corp | Independent mortgage company | 9 | 81.1% | 0.9% | 23.4% | 15.0% | 77.2% | 14.9% | 99.9% |
| Flagstar Bank, FSB | Large bank | 29 | 72.0% | 0.9% | 18.4% | 14.2% | 63.7% | 23.8% | 94.2% |
| Freedom Mortgage Corporation | Independent mortgage company | 53 | 16.9% | 0.6% | 14.4% | 19.1% | 58.2% | 26.0% | 98.8% |
| Navy Federal Credit Union | Credit union | 15 | 42.4% | 3.8% | 15.3% | 14.1% | 54.0% | 29.1% | 62.2% |
| Guild Mortgage Company | Independent mortgage company | 10 | 75.0% | 0.3% | 23.7% | 19.1% | 63.3% | 19.3% | 100.0% |
| Nationstar Mortgage | Independent mortgage company | 55 | 76.7% | 2.2% | 17.2% | 19.9% | 60.2% | 24.1% | 99.9% |
| USAA Federal Savings Bank | Large bank | 11 | 39.9% | 0.2% | 11.0% | 12.8% | 63.1% | 17.8% | 99.8% |
| PrimeLending | Affiliated mortgage company | 7 | 87.5% | 2.0% | 20.3% | 13.3% | 72.2% | 16.1% | 99.6% |
| Guaranteed Rate, Inc. | Independent mortgage company | 13 | 90.7% | 0.5% | 15.9% | 12.2% | 72.5% | 13.5% | 100.0% |
| Movement Mortgage, LLC | Independent mortgage company | 4 | 77.7% | 1.7% | 26.5% | 15.5% | 73.5% | 19.3% | 99.9% |
| PNC Bank, NA | Large bank | 21 | 94.3% | 0.1% | 27.2% | 13.3% | 66.7% | 12.9% | 53.0% |
| Finance of America Mortgage | Independent mortgage company | 13 | 81.3% | 0.3% | 19.0% | 17.5% | 61.5% | 23.1% | 99.9% |
| HomeBridge Financial Services | Independent mortgage company | 14 | 42.7% | 1.0% | 11.6% | 17.2% | 54.5% | 30.1% | 100.0% |
| Stearns Lending | Independent mortgage company | 12 | 68.2% | 0.5% | 20.4% | 18.1% | 58.2% | 28.9% | 100.0% |
| Mortgage Research Center | Independent mortgage company | 5 | 2.6% | 0.0% | 15.2% | 15.2% | 64.5% | 19.3% | 100.0% |
| Academy Mortgage Corporation | Independent mortgage company | 6 | 81.9% | 1.0% | 25.1% | 16.0% | 76.0% | 16.1% | 99.9% |
| DITECH Financial LLC | Independent mortgage company | 28 | 92.4% | 0.9% | 41.9% | 20.6% | 64.9% | 20.4% | 100.0% |
| Top 25 institutions | ... | 977 | 73.8% | 1.1% | 23.3% | 16.0% | 57.5% | 18.3% | 90.0% |
| All institutions | ... | 2,170 | 75.1% | 2.1% | 22.9% | 15.5% | 63.3% | 17.8% | 80.9% |
The rate of growth of new housing units across the United States stands at about half of what it was at the peak of the home construction boom in January of 2006. In September 2018 there were 1,201,000 seasonally adjusted new housing units started compared with 2,273,000 in January 2016. The following table lists seasonally-adjusted new privately owned housing unit starts (all numbers in thousands).
| Date | Housing Starts |
|---|---|
| 1959-01-01 | 1,657 |
| 1959-02-01 | 1,667 |
| 1959-03-01 | 1,620 |
| 1959-04-01 | 1,590 |
| 1959-05-01 | 1,498 |
| 1959-06-01 | 1,503 |
| 1959-07-01 | 1,547 |
| 1959-08-01 | 1,430 |
| 1959-09-01 | 1,540 |
| 1959-10-01 | 1,355 |
| 1959-11-01 | 1,416 |
| 1959-12-01 | 1,601 |
| 1960-01-01 | 1,460 |
| 1960-02-01 | 1,503 |
| 1960-03-01 | 1,109 |
| 1960-04-01 | 1,289 |
| 1960-05-01 | 1,271 |
| 1960-06-01 | 1,247 |
| 1960-07-01 | 1,197 |
| 1960-08-01 | 1,344 |
| 1960-09-01 | 1,097 |
| 1960-10-01 | 1,246 |
| 1960-11-01 | 1,246 |
| 1960-12-01 | 1,063 |
| 1961-01-01 | 1,183 |
| 1961-02-01 | 1,226 |
| 1961-03-01 | 1,312 |
| 1961-04-01 | 1,166 |
| 1961-05-01 | 1,228 |
| 1961-06-01 | 1,382 |
| 1961-07-01 | 1,335 |
| 1961-08-01 | 1,312 |
| 1961-09-01 | 1,429 |
| 1961-10-01 | 1,415 |
| 1961-11-01 | 1,385 |
| 1961-12-01 | 1,365 |
| 1962-01-01 | 1,361 |
| 1962-02-01 | 1,278 |
| 1962-03-01 | 1,443 |
| 1962-04-01 | 1,524 |
| 1962-05-01 | 1,483 |
| 1962-06-01 | 1,404 |
| 1962-07-01 | 1,450 |
| 1962-08-01 | 1,517 |
| 1962-09-01 | 1,324 |
| 1962-10-01 | 1,533 |
| 1962-11-01 | 1,622 |
| 1962-12-01 | 1,564 |
| 1963-01-01 | 1,244 |
| 1963-02-01 | 1,456 |
| 1963-03-01 | 1,534 |
| 1963-04-01 | 1,689 |
| 1963-05-01 | 1,641 |
| 1963-06-01 | 1,588 |
| 1963-07-01 | 1,614 |
| 1963-08-01 | 1,639 |
| 1963-09-01 | 1,763 |
| 1963-10-01 | 1,779 |
| 1963-11-01 | 1,622 |
| 1963-12-01 | 1,491 |
| 1964-01-01 | 1,603 |
| 1964-02-01 | 1,820 |
| 1964-03-01 | 1,517 |
| 1964-04-01 | 1,448 |
| 1964-05-01 | 1,467 |
| 1964-06-01 | 1,550 |
| 1964-07-01 | 1,562 |
| 1964-08-01 | 1,569 |
| 1964-09-01 | 1,455 |
| 1964-10-01 | 1,524 |
| 1964-11-01 | 1,486 |
| 1964-12-01 | 1,484 |
| 1965-01-01 | 1,361 |
| 1965-02-01 | 1,433 |
| 1965-03-01 | 1,423 |
| 1965-04-01 | 1,438 |
| 1965-05-01 | 1,478 |
| 1965-06-01 | 1,488 |
| 1965-07-01 | 1,529 |
| 1965-08-01 | 1,432 |
| 1965-09-01 | 1,482 |
| 1965-10-01 | 1,452 |
| 1965-11-01 | 1,460 |
| 1965-12-01 | 1,656 |
| 1966-01-01 | 1,370 |
| 1966-02-01 | 1,378 |
| 1966-03-01 | 1,394 |
| 1966-04-01 | 1,352 |
| 1966-05-01 | 1,265 |
| 1966-06-01 | 1,194 |
| 1966-07-01 | 1,086 |
| 1966-08-01 | 1,119 |
| 1966-09-01 | 1,046 |
| 1966-10-01 | 843 |
| 1966-11-01 | 961 |
| 1966-12-01 | 990 |
| 1967-01-01 | 1,067 |
| 1967-02-01 | 1,123 |
| 1967-03-01 | 1,056 |
| 1967-04-01 | 1,091 |
| 1967-05-01 | 1,304 |
| 1967-06-01 | 1,248 |
| 1967-07-01 | 1,364 |
| 1967-08-01 | 1,407 |
| 1967-09-01 | 1,421 |
| 1967-10-01 | 1,491 |
| 1967-11-01 | 1,538 |
| 1967-12-01 | 1,308 |
| 1968-01-01 | 1,380 |
| 1968-02-01 | 1,520 |
| 1968-03-01 | 1,466 |
| 1968-04-01 | 1,554 |
| 1968-05-01 | 1,408 |
| 1968-06-01 | 1,405 |
| 1968-07-01 | 1,512 |
| 1968-08-01 | 1,495 |
| 1968-09-01 | 1,556 |
| 1968-10-01 | 1,569 |
| 1968-11-01 | 1,630 |
| 1968-12-01 | 1,548 |
| 1969-01-01 | 1,769 |
| 1969-02-01 | 1,705 |
| 1969-03-01 | 1,561 |
| 1969-04-01 | 1,524 |
| 1969-05-01 | 1,583 |
| 1969-06-01 | 1,528 |
| 1969-07-01 | 1,368 |
| 1969-08-01 | 1,358 |
| 1969-09-01 | 1,507 |
| 1969-10-01 | 1,381 |
| 1969-11-01 | 1,229 |
| 1969-12-01 | 1,327 |
| 1970-01-01 | 1,085 |
| 1970-02-01 | 1,305 |
| 1970-03-01 | 1,319 |
| 1970-04-01 | 1,264 |
| 1970-05-01 | 1,290 |
| 1970-06-01 | 1,385 |
| 1970-07-01 | 1,517 |
| 1970-08-01 | 1,399 |
| 1970-09-01 | 1,534 |
| 1970-10-01 | 1,580 |
| 1970-11-01 | 1,647 |
| 1970-12-01 | 1,893 |
| 1971-01-01 | 1,828 |
| 1971-02-01 | 1,741 |
| 1971-03-01 | 1,910 |
| 1971-04-01 | 1,986 |
| 1971-05-01 | 2,049 |
| 1971-06-01 | 2,026 |
| 1971-07-01 | 2,083 |
| 1971-08-01 | 2,158 |
| 1971-09-01 | 2,041 |
| 1971-10-01 | 2,128 |
| 1971-11-01 | 2,182 |
| 1971-12-01 | 2,295 |
| 1972-01-01 | 2,494 |
| 1972-02-01 | 2,390 |
| 1972-03-01 | 2,334 |
| 1972-04-01 | 2,249 |
| 1972-05-01 | 2,221 |
| 1972-06-01 | 2,254 |
| 1972-07-01 | 2,252 |
| 1972-08-01 | 2,382 |
| 1972-09-01 | 2,481 |
| 1972-10-01 | 2,485 |
| 1972-11-01 | 2,421 |
| 1972-12-01 | 2,366 |
| 1973-01-01 | 2,481 |
| 1973-02-01 | 2,289 |
| 1973-03-01 | 2,365 |
| 1973-04-01 | 2,084 |
| 1973-05-01 | 2,266 |
| 1973-06-01 | 2,067 |
| 1973-07-01 | 2,123 |
| 1973-08-01 | 2,051 |
| 1973-09-01 | 1,874 |
| 1973-10-01 | 1,677 |
| 1973-11-01 | 1,724 |
| 1973-12-01 | 1,526 |
| 1974-01-01 | 1,451 |
| 1974-02-01 | 1,752 |
| 1974-03-01 | 1,555 |
| 1974-04-01 | 1,607 |
| 1974-05-01 | 1,426 |
| 1974-06-01 | 1,513 |
| 1974-07-01 | 1,316 |
| 1974-08-01 | 1,142 |
| 1974-09-01 | 1,150 |
| 1974-10-01 | 1,070 |
| 1974-11-01 | 1,026 |
| 1974-12-01 | 975 |
| 1975-01-01 | 1,032 |
| 1975-02-01 | 904 |
| 1975-03-01 | 993 |
| 1975-04-01 | 1,005 |
| 1975-05-01 | 1,121 |
| 1975-06-01 | 1,087 |
| 1975-07-01 | 1,226 |
| 1975-08-01 | 1,260 |
| 1975-09-01 | 1,264 |
| 1975-10-01 | 1,344 |
| 1975-11-01 | 1,360 |
| 1975-12-01 | 1,321 |
| 1976-01-01 | 1,367 |
| 1976-02-01 | 1,538 |
| 1976-03-01 | 1,421 |
| 1976-04-01 | 1,395 |
| 1976-05-01 | 1,459 |
| 1976-06-01 | 1,495 |
| 1976-07-01 | 1,401 |
| 1976-08-01 | 1,550 |
| 1976-09-01 | 1,720 |
| 1976-10-01 | 1,629 |
| 1976-11-01 | 1,641 |
| 1976-12-01 | 1,804 |
| 1977-01-01 | 1,527 |
| 1977-02-01 | 1,943 |
| 1977-03-01 | 2,063 |
| 1977-04-01 | 1,892 |
| 1977-05-01 | 1,971 |
| 1977-06-01 | 1,893 |
| 1977-07-01 | 2,058 |
| 1977-08-01 | 2,020 |
| 1977-09-01 | 1,949 |
| 1977-10-01 | 2,042 |
| 1977-11-01 | 2,042 |
| 1977-12-01 | 2,142 |
| 1978-01-01 | 1,718 |
| 1978-02-01 | 1,738 |
| 1978-03-01 | 2,032 |
| 1978-04-01 | 2,197 |
| 1978-05-01 | 2,075 |
| 1978-06-01 | 2,070 |
| 1978-07-01 | 2,092 |
| 1978-08-01 | 1,996 |
| 1978-09-01 | 1,970 |
| 1978-10-01 | 1,981 |
| 1978-11-01 | 2,094 |
| 1978-12-01 | 2,044 |
| 1979-01-01 | 1,630 |
| 1979-02-01 | 1,520 |
| 1979-03-01 | 1,847 |
| 1979-04-01 | 1,748 |
| 1979-05-01 | 1,876 |
| 1979-06-01 | 1,913 |
| 1979-07-01 | 1,760 |
| 1979-08-01 | 1,778 |
| 1979-09-01 | 1,832 |
| 1979-10-01 | 1,681 |
| 1979-11-01 | 1,524 |
| 1979-12-01 | 1,498 |
| 1980-01-01 | 1,341 |
| 1980-02-01 | 1,350 |
| 1980-03-01 | 1,047 |
| 1980-04-01 | 1,051 |
| 1980-05-01 | 927 |
| 1980-06-01 | 1,196 |
| 1980-07-01 | 1,269 |
| 1980-08-01 | 1,436 |
| 1980-09-01 | 1,471 |
| 1980-10-01 | 1,523 |
| 1980-11-01 | 1,510 |
| 1980-12-01 | 1,482 |
| 1981-01-01 | 1,547 |
| 1981-02-01 | 1,246 |
| 1981-03-01 | 1,306 |
| 1981-04-01 | 1,360 |
| 1981-05-01 | 1,140 |
| 1981-06-01 | 1,045 |
| 1981-07-01 | 1,041 |
| 1981-08-01 | 940 |
| 1981-09-01 | 911 |
| 1981-10-01 | 873 |
| 1981-11-01 | 837 |
| 1981-12-01 | 910 |
| 1982-01-01 | 843 |
| 1982-02-01 | 866 |
| 1982-03-01 | 931 |
| 1982-04-01 | 917 |
| 1982-05-01 | 1,025 |
| 1982-06-01 | 902 |
| 1982-07-01 | 1,166 |
| 1982-08-01 | 1,046 |
| 1982-09-01 | 1,144 |
| 1982-10-01 | 1,173 |
| 1982-11-01 | 1,372 |
| 1982-12-01 | 1,303 |
| 1983-01-01 | 1,586 |
| 1983-02-01 | 1,699 |
| 1983-03-01 | 1,606 |
| 1983-04-01 | 1,472 |
| 1983-05-01 | 1,776 |
| 1983-06-01 | 1,733 |
| 1983-07-01 | 1,785 |
| 1983-08-01 | 1,910 |
| 1983-09-01 | 1,710 |
| 1983-10-01 | 1,715 |
| 1983-11-01 | 1,785 |
| 1983-12-01 | 1,688 |
| 1984-01-01 | 1,897 |
| 1984-02-01 | 2,260 |
| 1984-03-01 | 1,663 |
| 1984-04-01 | 1,851 |
| 1984-05-01 | 1,774 |
| 1984-06-01 | 1,843 |
| 1984-07-01 | 1,732 |
| 1984-08-01 | 1,586 |
| 1984-09-01 | 1,698 |
| 1984-10-01 | 1,590 |
| 1984-11-01 | 1,689 |
| 1984-12-01 | 1,612 |
| 1985-01-01 | 1,711 |
| 1985-02-01 | 1,632 |
| 1985-03-01 | 1,800 |
| 1985-04-01 | 1,821 |
| 1985-05-01 | 1,680 |
| 1985-06-01 | 1,676 |
| 1985-07-01 | 1,684 |
| 1985-08-01 | 1,743 |
| 1985-09-01 | 1,676 |
| 1985-10-01 | 1,834 |
| 1985-11-01 | 1,698 |
| 1985-12-01 | 1,942 |
| 1986-01-01 | 1,972 |
| 1986-02-01 | 1,848 |
| 1986-03-01 | 1,876 |
| 1986-04-01 | 1,933 |
| 1986-05-01 | 1,854 |
| 1986-06-01 | 1,847 |
| 1986-07-01 | 1,782 |
| 1986-08-01 | 1,807 |
| 1986-09-01 | 1,687 |
| 1986-10-01 | 1,681 |
| 1986-11-01 | 1,623 |
| 1986-12-01 | 1,833 |
| 1987-01-01 | 1,774 |
| 1987-02-01 | 1,784 |
| 1987-03-01 | 1,726 |
| 1987-04-01 | 1,614 |
| 1987-05-01 | 1,628 |
| 1987-06-01 | 1,594 |
| 1987-07-01 | 1,575 |
| 1987-08-01 | 1,605 |
| 1987-09-01 | 1,695 |
| 1987-10-01 | 1,515 |
| 1987-11-01 | 1,656 |
| 1987-12-01 | 1,400 |
| 1988-01-01 | 1,271 |
| 1988-02-01 | 1,473 |
| 1988-03-01 | 1,532 |
| 1988-04-01 | 1,573 |
| 1988-05-01 | 1,421 |
| 1988-06-01 | 1,478 |
| 1988-07-01 | 1,467 |
| 1988-08-01 | 1,493 |
| 1988-09-01 | 1,492 |
| 1988-10-01 | 1,522 |
| 1988-11-01 | 1,569 |
| 1988-12-01 | 1,563 |
| 1989-01-01 | 1,621 |
| 1989-02-01 | 1,425 |
| 1989-03-01 | 1,422 |
| 1989-04-01 | 1,339 |
| 1989-05-01 | 1,331 |
| 1989-06-01 | 1,397 |
| 1989-07-01 | 1,427 |
| 1989-08-01 | 1,332 |
| 1989-09-01 | 1,279 |
| 1989-10-01 | 1,410 |
| 1989-11-01 | 1,351 |
| 1989-12-01 | 1,251 |
| 1990-01-01 | 1,551 |
| 1990-02-01 | 1,437 |
| 1990-03-01 | 1,289 |
| 1990-04-01 | 1,248 |
| 1990-05-01 | 1,212 |
| 1990-06-01 | 1,177 |
| 1990-07-01 | 1,171 |
| 1990-08-01 | 1,115 |
| 1990-09-01 | 1,110 |
| 1990-10-01 | 1,014 |
| 1990-11-01 | 1,145 |
| 1990-12-01 | 969 |
| 1991-01-01 | 798 |
| 1991-02-01 | 965 |
| 1991-03-01 | 921 |
| 1991-04-01 | 1,001 |
| 1991-05-01 | 996 |
| 1991-06-01 | 1,036 |
| 1991-07-01 | 1,063 |
| 1991-08-01 | 1,049 |
| 1991-09-01 | 1,015 |
| 1991-10-01 | 1,079 |
| 1991-11-01 | 1,103 |
| 1991-12-01 | 1,079 |
| 1992-01-01 | 1,176 |
| 1992-02-01 | 1,250 |
| 1992-03-01 | 1,297 |
| 1992-04-01 | 1,099 |
| 1992-05-01 | 1,214 |
| 1992-06-01 | 1,145 |
| 1992-07-01 | 1,139 |
| 1992-08-01 | 1,226 |
| 1992-09-01 | 1,186 |
| 1992-10-01 | 1,244 |
| 1992-11-01 | 1,214 |
| 1992-12-01 | 1,227 |
| 1993-01-01 | 1,210 |
| 1993-02-01 | 1,210 |
| 1993-03-01 | 1,083 |
| 1993-04-01 | 1,258 |
| 1993-05-01 | 1,260 |
| 1993-06-01 | 1,280 |
| 1993-07-01 | 1,254 |
| 1993-08-01 | 1,300 |
| 1993-09-01 | 1,343 |
| 1993-10-01 | 1,392 |
| 1993-11-01 | 1,376 |
| 1993-12-01 | 1,533 |
| 1994-01-01 | 1,272 |
| 1994-02-01 | 1,337 |
| 1994-03-01 | 1,564 |
| 1994-04-01 | 1,465 |
| 1994-05-01 | 1,526 |
| 1994-06-01 | 1,409 |
| 1994-07-01 | 1,439 |
| 1994-08-01 | 1,450 |
| 1994-09-01 | 1,474 |
| 1994-10-01 | 1,450 |
| 1994-11-01 | 1,511 |
| 1994-12-01 | 1,455 |
| 1995-01-01 | 1,407 |
| 1995-02-01 | 1,316 |
| 1995-03-01 | 1,249 |
| 1995-04-01 | 1,267 |
| 1995-05-01 | 1,314 |
| 1995-06-01 | 1,281 |
| 1995-07-01 | 1,461 |
| 1995-08-01 | 1,416 |
| 1995-09-01 | 1,369 |
| 1995-10-01 | 1,369 |
| 1995-11-01 | 1,452 |
| 1995-12-01 | 1,431 |
| 1996-01-01 | 1,467 |
| 1996-02-01 | 1,491 |
| 1996-03-01 | 1,424 |
| 1996-04-01 | 1,516 |
| 1996-05-01 | 1,504 |
| 1996-06-01 | 1,467 |
| 1996-07-01 | 1,472 |
| 1996-08-01 | 1,557 |
| 1996-09-01 | 1,475 |
| 1996-10-01 | 1,392 |
| 1996-11-01 | 1,489 |
| 1996-12-01 | 1,370 |
| 1997-01-01 | 1,355 |
| 1997-02-01 | 1,486 |
| 1997-03-01 | 1,457 |
| 1997-04-01 | 1,492 |
| 1997-05-01 | 1,442 |
| 1997-06-01 | 1,494 |
| 1997-07-01 | 1,437 |
| 1997-08-01 | 1,390 |
| 1997-09-01 | 1,546 |
| 1997-10-01 | 1,520 |
| 1997-11-01 | 1,510 |
| 1997-12-01 | 1,566 |
| 1998-01-01 | 1,525 |
| 1998-02-01 | 1,584 |
| 1998-03-01 | 1,567 |
| 1998-04-01 | 1,540 |
| 1998-05-01 | 1,536 |
| 1998-06-01 | 1,641 |
| 1998-07-01 | 1,698 |
| 1998-08-01 | 1,614 |
| 1998-09-01 | 1,582 |
| 1998-10-01 | 1,715 |
| 1998-11-01 | 1,660 |
| 1998-12-01 | 1,792 |
| 1999-01-01 | 1,748 |
| 1999-02-01 | 1,670 |
| 1999-03-01 | 1,710 |
| 1999-04-01 | 1,553 |
| 1999-05-01 | 1,611 |
| 1999-06-01 | 1,559 |
| 1999-07-01 | 1,669 |
| 1999-08-01 | 1,648 |
| 1999-09-01 | 1,635 |
| 1999-10-01 | 1,608 |
| 1999-11-01 | 1,648 |
| 1999-12-01 | 1,708 |
| 2000-01-01 | 1,636 |
| 2000-02-01 | 1,737 |
| 2000-03-01 | 1,604 |
| 2000-04-01 | 1,626 |
| 2000-05-01 | 1,575 |
| 2000-06-01 | 1,559 |
| 2000-07-01 | 1,463 |
| 2000-08-01 | 1,541 |
| 2000-09-01 | 1,507 |
| 2000-10-01 | 1,549 |
| 2000-11-01 | 1,551 |
| 2000-12-01 | 1,532 |
| 2001-01-01 | 1,600 |
| 2001-02-01 | 1,625 |
| 2001-03-01 | 1,590 |
| 2001-04-01 | 1,649 |
| 2001-05-01 | 1,605 |
| 2001-06-01 | 1,636 |
| 2001-07-01 | 1,670 |
| 2001-08-01 | 1,567 |
| 2001-09-01 | 1,562 |
| 2001-10-01 | 1,540 |
| 2001-11-01 | 1,602 |
| 2001-12-01 | 1,568 |
| 2002-01-01 | 1,698 |
| 2002-02-01 | 1,829 |
| 2002-03-01 | 1,642 |
| 2002-04-01 | 1,592 |
| 2002-05-01 | 1,764 |
| 2002-06-01 | 1,717 |
| 2002-07-01 | 1,655 |
| 2002-08-01 | 1,633 |
| 2002-09-01 | 1,804 |
| 2002-10-01 | 1,648 |
| 2002-11-01 | 1,753 |
| 2002-12-01 | 1,788 |
| 2003-01-01 | 1,853 |
| 2003-02-01 | 1,629 |
| 2003-03-01 | 1,726 |
| 2003-04-01 | 1,643 |
| 2003-05-01 | 1,751 |
| 2003-06-01 | 1,867 |
| 2003-07-01 | 1,897 |
| 2003-08-01 | 1,833 |
| 2003-09-01 | 1,939 |
| 2003-10-01 | 1,967 |
| 2003-11-01 | 2,083 |
| 2003-12-01 | 2,057 |
| 2004-01-01 | 1,911 |
| 2004-02-01 | 1,846 |
| 2004-03-01 | 1,998 |
| 2004-04-01 | 2,003 |
| 2004-05-01 | 1,981 |
| 2004-06-01 | 1,828 |
| 2004-07-01 | 2,002 |
| 2004-08-01 | 2,024 |
| 2004-09-01 | 1,905 |
| 2004-10-01 | 2,072 |
| 2004-11-01 | 1,782 |
| 2004-12-01 | 2,042 |
| 2005-01-01 | 2,144 |
| 2005-02-01 | 2,207 |
| 2005-03-01 | 1,864 |
| 2005-04-01 | 2,061 |
| 2005-05-01 | 2,025 |
| 2005-06-01 | 2,068 |
| 2005-07-01 | 2,054 |
| 2005-08-01 | 2,095 |
| 2005-09-01 | 2,151 |
| 2005-10-01 | 2,065 |
| 2005-11-01 | 2,147 |
| 2005-12-01 | 1,994 |
| 2006-01-01 | 2,273 |
| 2006-02-01 | 2,119 |
| 2006-03-01 | 1,969 |
| 2006-04-01 | 1,821 |
| 2006-05-01 | 1,942 |
| 2006-06-01 | 1,802 |
| 2006-07-01 | 1,737 |
| 2006-08-01 | 1,650 |
| 2006-09-01 | 1,720 |
| 2006-10-01 | 1,491 |
| 2006-11-01 | 1,570 |
| 2006-12-01 | 1,649 |
| 2007-01-01 | 1,409 |
| 2007-02-01 | 1,480 |
| 2007-03-01 | 1,495 |
| 2007-04-01 | 1,490 |
| 2007-05-01 | 1,415 |
| 2007-06-01 | 1,448 |
| 2007-07-01 | 1,354 |
| 2007-08-01 | 1,330 |
| 2007-09-01 | 1,183 |
| 2007-10-01 | 1,264 |
| 2007-11-01 | 1,197 |
| 2007-12-01 | 1,037 |
| 2008-01-01 | 1,084 |
| 2008-02-01 | 1,103 |
| 2008-03-01 | 1,005 |
| 2008-04-01 | 1,013 |
| 2008-05-01 | 973 |
| 2008-06-01 | 1,046 |
| 2008-07-01 | 923 |
| 2008-08-01 | 844 |
| 2008-09-01 | 820 |
| 2008-10-01 | 777 |
| 2008-11-01 | 652 |
| 2008-12-01 | 560 |
| 2009-01-01 | 490 |
| 2009-02-01 | 582 |
| 2009-03-01 | 505 |
| 2009-04-01 | 478 |
| 2009-05-01 | 540 |
| 2009-06-01 | 585 |
| 2009-07-01 | 594 |
| 2009-08-01 | 586 |
| 2009-09-01 | 585 |
| 2009-10-01 | 534 |
| 2009-11-01 | 588 |
| 2009-12-01 | 581 |
| 2010-01-01 | 614 |
| 2010-02-01 | 604 |
| 2010-03-01 | 636 |
| 2010-04-01 | 687 |
| 2010-05-01 | 583 |
| 2010-06-01 | 536 |
| 2010-07-01 | 546 |
| 2010-08-01 | 599 |
| 2010-09-01 | 594 |
| 2010-10-01 | 543 |
| 2010-11-01 | 545 |
| 2010-12-01 | 539 |
| 2011-01-01 | 630 |
| 2011-02-01 | 517 |
| 2011-03-01 | 600 |
| 2011-04-01 | 554 |
| 2011-05-01 | 561 |
| 2011-06-01 | 608 |
| 2011-07-01 | 623 |
| 2011-08-01 | 585 |
| 2011-09-01 | 650 |
| 2011-10-01 | 610 |
| 2011-11-01 | 711 |
| 2011-12-01 | 694 |
| 2012-01-01 | 723 |
| 2012-02-01 | 704 |
| 2012-03-01 | 695 |
| 2012-04-01 | 753 |
| 2012-05-01 | 708 |
| 2012-06-01 | 757 |
| 2012-07-01 | 740 |
| 2012-08-01 | 754 |
| 2012-09-01 | 847 |
| 2012-10-01 | 915 |
| 2012-11-01 | 833 |
| 2012-12-01 | 976 |
| 2013-01-01 | 888 |
| 2013-02-01 | 962 |
| 2013-03-01 | 1,010 |
| 2013-04-01 | 835 |
| 2013-05-01 | 930 |
| 2013-06-01 | 839 |
| 2013-07-01 | 880 |
| 2013-08-01 | 917 |
| 2013-09-01 | 850 |
| 2013-10-01 | 925 |
| 2013-11-01 | 1,100 |
| 2013-12-01 | 1,002 |
| 2014-01-01 | 890 |
| 2014-02-01 | 941 |
| 2014-03-01 | 970 |
| 2014-04-01 | 1,049 |
| 2014-05-01 | 1,008 |
| 2014-06-01 | 903 |
| 2014-07-01 | 1,082 |
| 2014-08-01 | 983 |
| 2014-09-01 | 1,020 |
| 2014-10-01 | 1,077 |
| 2014-11-01 | 1,001 |
| 2014-12-01 | 1,068 |
| 2015-01-01 | 1,094 |
| 2015-02-01 | 888 |
| 2015-03-01 | 963 |
| 2015-04-01 | 1,203 |
| 2015-05-01 | 1,079 |
| 2015-06-01 | 1,185 |
| 2015-07-01 | 1,133 |
| 2015-08-01 | 1,134 |
| 2015-09-01 | 1,212 |
| 2015-10-01 | 1,064 |
| 2015-11-01 | 1,171 |
| 2015-12-01 | 1,155 |
| 2016-01-01 | 1,114 |
| 2016-02-01 | 1,202 |
| 2016-03-01 | 1,115 |
| 2016-04-01 | 1,173 |
| 2016-05-01 | 1,133 |
| 2016-06-01 | 1,183 |
| 2016-07-01 | 1,225 |
| 2016-08-01 | 1,161 |
| 2016-09-01 | 1,064 |
| 2016-10-01 | 1,327 |
| 2016-11-01 | 1,151 |
| 2016-12-01 | 1,280 |
| 2017-01-01 | 1,225 |
| 2017-02-01 | 1,289 |
| 2017-03-01 | 1,179 |
| 2017-04-01 | 1,165 |
| 2017-05-01 | 1,122 |
| 2017-06-01 | 1,225 |
| 2017-07-01 | 1,185 |
| 2017-08-01 | 1,172 |
| 2017-09-01 | 1,158 |
| 2017-10-01 | 1,265 |
| 2017-11-01 | 1,303 |
| 2017-12-01 | 1,210 |
| 2018-01-01 | 1,334 |
| 2018-02-01 | 1,290 |
| 2018-03-01 | 1,327 |
| 2018-04-01 | 1,276 |
| 2018-05-01 | 1,329 |
| 2018-06-01 | 1,177 |
| 2018-07-01 | 1,184 |
| 2018-08-01 | 1,268 |
| 2018-09-01 | 1,201 |
From 2010 to 2013 the number of families with home-secured debt fell from 47.0% to 42.9%. These numbers reflect both a decline in home-ownership, and a reticence on the part of consumers to take out extended home equity loans. That being said, home-secured debt remains the most common type of debt held by families in the US.
Again, according to the latest census numbers, the conditional median value of home-secured debt for families in the United States fell by 2% from $117,500 in 2010 to $115,000 in 2013. The conditional mean value of home-secured debt during the same period fell from $165,400 to $156,700, showing a 5% drop in the average home-secured debt being held by families in the US. These declines clearly show a loss of consumer confidence following the financial crisis of 2008. Still, forecasts are positive, and all economic predictors point to an uptick in mortgages and other home-secured loan products.
(source: The US Federal Reserve's Survey of Consumer Finances)
There has always been a small percentage of mortgages that slip into delinquency or default, regardless of the prevailing economic climate. From 1979 through to 2006, the share of mortgage loans that were classed as ‘seriously delinquent' (in excess of 90 days past due or in the process of foreclosure) averaged 1.7%; with a low of 0.7% in 1979 and a high of 2.4% in 2002 when the country experienced its first recession of the new century. However, the rise of ‘sub-prime' or ‘near-prime' lending in the middle of the decade led to an inevitable increase in mortgage defaults and delinquencies. Indeed, by 2008 the number of home loans determined to be ‘seriously delinquent' or in default rose to 4.5%, nearly double the levels seen in 2002. The increased level of delinquencies preceded a sharp rise in home foreclosures, peaking at 1.2 million by the first quarter of 2008. To put that in perspective, that's an increase of 79% over the first quarter of 2007.
Following the recession of 2008, lenders became much more conservative in their lending practices. While that did not necessarily stem the tide of existing delinquencies, it did help to curb the rise of any new defaults or foreclosures. Mortgage loans that originated in the early to mid 2000's still account for the largest percentage of delinquencies, though they only make up roughly 38% of all outstanding home loans. Mortgages that originated after 2009 are performing much better, with a much lower rate of delinquencies and defaults. In fact, the number of mortgages written post 2009 now account for nearly 62% of all active loans, yet they only make up 15% of those classified as seriously delinquent.

There are two primary mortgage formats in the United States, the fixed-rate and the adjustable-rate (ARM). Fixed-rate mortgages remain the most common, and most popular, mortgage product for US home buyers. With a fixed-rate mortgage, interest rates are set during the loan's origination and they remain constant throughout the life of the loan. Fixed-rate mortgages are offered at a variety of terms, Fixed-rate mortgages are offered at a variety of terms, typically in 15, 20 or 30 year formats, with a 30 year fixed-rate mortgage be the most popular throughout the US. The main advantage of these types of loans is that buyers are protected from any sudden and unexpected increases in interest rates while they hold the mortgage. Monthly payments remain predictable, as does the total cost of the loan itself.
Fixed-rate mortgages were the standard format prior to 1982 when congress passed the Garn-St. Germain Depository Institutions Act, after which banks and savings and loans in the United States were able to offer adjustable-rate mortgages to their customers. With an adjustable-rate mortgage, the initial interest rate on the loan is set below the current market value applied to fixed-rate mortgages. Over the term of the loan, interest rates are adjusted at predetermined intervals based on a set of market indexes. The main attraction of adjustable-rate mortgages is that they allow for lower initial monthly payments, and often allow consumers to qualify for larger home loans. However, with an adjustable-rate mortgage monthly payments can change frequently over the life of the loan, and when interest rates rise that can present a financial burden for the borrower. Still, adjustable-rate mortgages can be attractive to first time buyers, and to homeowners who intend to flip their property or expect to move within a short span of time.
Adjustable-rate, also known as variable-rate, mortgages may not be the most popular format in the US, but they are the prevailing home loan product in many other countries. Indeed, in the United Kingdom, Australia, and Canada they are the most common type of home loans, and in these countries it is extremely unusual to find a fixed-rate rate mortgage product. This is because the basic structure of the mortgage lending industry in most countries doesn't support long term lending. With the notable exceptions of Germany and Austria, in most European countries the predominant mortgage format remains the ARM or variable-rate loan.
Interest rates on both fixed and variable rate mortgages are constantly in flux, and a review of their performance over the last several years reveals some interesting trends.
Interest rates on a 30 year fixed-rate mortgage were at their highest when they peaked at 18.45 during the fourth quarter of 1981. Indeed, from 1979 through 1990 interest rates on a 30 year fixed-rate mortgage remained firmly rooted in the double digits, and it is only in the last twenty years that they have slowly returned to, and ultimately bettered, pre-1980 levels.
Rates on 15 year fixed-rate mortgages have been relatively more stable over the last twenty years, reaching their highest level of 8.58 in the early to mid nineties. Since then, rates and points on 15 year mortgages have slowly declined, once again reaching an all time statistical low. The same holds true for 5 year fixed-rate mortgages and 1 year variable rate home loans, with both hovering at their lowest rates for products in their class.
The general public might find it surprising to learn that interest levels on most standard mortgages are lower now than they have been in over forty years. While much of this is due to the economic downturn of the last decade or more, it does make for a buyer's market, with current rates greatly favoring the consumer.
(source: Freddie Mac – Economic and Housing Research)
Of course, mortgage rates are also influenced by region, and where you buy a home will have a big impact on the available interest rates. Currently, rates are lowest on the upper East coast, with New York and New Jersey leading the country in most affordable mortgage rates. Arizona, New Mexico, and Florida continue to have the highest rates in the country, following the historical trends. To see where your state ranks among the national averages, check out this handy interactive map. It's updated regularly so you can track the rise and fall of mortgage rates in your region of the country.
The recent economic crisis may have dealt the US housing market a devastating blow, but it is slowly returning to form. Spurred on by a strengthening economy and record low interest rates, real estate markets across the country are returning to (and some cases exceeding) their pre-recession levels. But as consumers return to the market, housing costs have begun to rise, particularly in some of the most desirable regions of the nation. For a greater perspective on the rising cost of home-ownership, let's take a quick look at the 5 most expensive states for home buyers in the U.S.
(sources: Find The Home's Guide to The Most Expensive States & Market Watch's Map of the Most Expensive and Cheapest States to Live)

While most states have seen their real estate markets rebound thanks to a strengthening economy, some are still a better buy for homeowners than others. Now that we've looked at the 5 most expensive states in which to buy a home, it's only fair that we touch on the 5 least expensive housing markets. They are, in no particular order:
(sources: Zillow Research & Numbeo)
Here is a table of the top mortgage lenders for the years 2020 through 2022
| Institution | LEI | Agency | 2020 | 2021 | 2022 | 3-Year Total |
| ROCKET MORTGAGE, LLC | 549300FGXN1K3HLB1R50 | HUD | 1,503,505 | 1,586,789 | 672,240 | 3,762,534 |
| WELLS FARGO BANK, NATIONAL ASSOCIATION | KB1H1DSPRFMYMCUFXT09 | CFPB | 1,180,466 | 897,196 | 408,300 | 2,485,962 |
| UNITED SHORE FINANCIAL SERVICES, LLC | 549300HW662MN1WU8550 | HUD | 689,666 | 803,496 | 462,351 | 1,955,513 |
| FREEDOM MORTGAGE CORPORATION | 549300LYRWPSYPK6S325 | HUD | 779,005 | 739,580 | 177,112 | 1,695,697 |
| PENNYMAC LOAN SERVICES, LLC | RVDPPPGHCGZ40J4VQ731 | CFPB | 436,396 | 590,862 | 328,053 | 1,355,311 |
| U.S. BANK NATIONAL ASSOCIATION | 6BYL5QZYBDK8S7L73M02 | CFPB | 529,466 | 492,078 | 312,902 | 1,334,446 |
| JPMORGAN CHASE BANK, NATIONAL ASSOCIATION | 7H6GLXDRUGQFU57RNE97 | CFPB | 481,058 | 546,394 | 243,081 | 1,270,533 |
| LOANDEPOT.COM, LLC | 549300AG64NHILB7ZP05 | HUD | 443,912 | 558,593 | 249,252 | 1,251,757 |
| NEWREZ LLC | 549300FNXYY540N23N64 | HUD | 381,017 | 529,874 | 212,573 | 1,123,464 |
| BANK OF AMERICA, NATIONAL ASSOCIATION | B4TYDEB6GKMZO031MB27 | CFPB | 373,621 | 368,728 | 348,961 | 1,091,310 |
| AMERISAVE MORTGAGE CORPORATION | 549300YIQ7S7Z8PIHE53 | HUD | 279,100 | 488,180 | 195,894 | 963,174 |
| CALIBER HOME LOANS, INC. | 549300J7XKT2BI5WX213 | HUD | 397,379 | 400,596 | 161,747 | 959,722 |
| NATIONSTAR MORTGAGE LLC | 549300LBCBNR1OT00651 | HUD | 312,395 | 402,748 | 151,383 | 866,526 |
| FAIRWAY INDEPENDENT MORTGAGE CORPORATION | 549300MGPZBLQDIL7538 | HUD | 323,000 | 326,921 | 187,419 | 837,340 |
| TRUIST BANK | JJKC32MCHWDI71265Z06 | CFPB | 329,924 | 286,895 | 194,190 | 811,009 |
| GUARANTEED RATE, INC. | 549300U3721PJGQZYY68 | HUD | 264,365 | 319,880 | 175,146 | 759,391 |
| CITIZENS BANK, NATIONAL ASSOCIATION | DRMSV1Q0EKMEXLAU1P80 | CFPB | 231,117 | 273,341 | 197,248 | 701,706 |
| HOME POINT FINANCIAL CORPORATION | 549300BRJZYHYKT4BJ84 | HUD | 235,968 | 344,390 | 102,277 | 682,635 |
| LAKEVIEW LOAN SERVICING, LLC | 549300NOCASXPA34X033 | HUD | 213,769 | 279,905 | 137,418 | 631,092 |
| CROSSCOUNTRY MORTGAGE, INC. | 549300VZVN841I2ILS84 | HUD | 183,950 | 220,540 | 159,375 | 563,865 |
| FLAGSTAR BANK, FSB | SS1TRMSN6BRNMOREEV51 | CFPB | 209,649 | 212,842 | 132,590 | 555,081 |
| MORTGAGE RESEARCH CENTER, LLC | 549300DD5QQUHO6PCH70 | HUD | 168,005 | 223,183 | 160,679 | 551,867 |
| NAVY FEDERAL CREDIT UNION | 5493003GQDUH26DNNH17 | CFPB | 206,004 | 175,240 | 169,004 | 550,248 |
| PNC BANK, NATIONAL ASSOCIATION | AD6GFRVSDT01YPT1CS68 | CFPB | 167,346 | 173,932 | 197,790 | 539,068 |
| 21ST MORTGAGE CORPORATION | 549300XQVJ1XBNFA5536 | HUD | 176,363 | 179,953 | 175,852 | 532,168 |
| CARDINAL FINANCIAL COMPANY, LIMITED PARTNERSHIP | 549300VORTI31GZTJL53 | HUD | 198,135 | 231,879 | 91,195 | 521,209 |
| BROKER SOLUTIONS, INC. | 549300E2UX99HKDBR481 | HUD | 171,183 | 190,325 | 117,927 | 479,435 |
| GUILD MORTGAGE COMPANY | 549300AQ3T62GXDU7D76 | HUD | 180,122 | 167,037 | 91,409 | 438,568 |
| MOVEMENT MORTGAGE, LLC | 549300DD4R4SYK5RAQ92 | HUD | 149,836 | 149,914 | 101,234 | 400,984 |
| DISCOVER BANK | X05BVSK68TQ7YTOSNR22 | CFPB | 113,043 | 119,817 | 163,101 | 395,961 |
| THE HUNTINGTON NATIONAL BANK | 2WHM8VNJH63UN14OL754 | CFPB | 130,283 | 144,028 | 119,598 | 393,909 |
| FIFTH THIRD BANK, NATIONAL ASSOCIATION | QFROUN1UWUYU0DVIWD51 | OCC | 131,689 | 145,301 | 110,747 | 387,737 |
| VANDERBILT MORTGAGE AND FINANCE, INC. | 5493000YNV8IX4VD3X12 | HUD | 122,950 | 128,354 | 120,765 | 372,069 |
| REGIONS BANK | EQTWLK1G7ODGC2MGLV11 | CFPB | 122,740 | 116,367 | 97,816 | 336,923 |
| NEW DAY FINANCIAL, LLC | 549300SUCQ1358EGVE89 | HUD | 126,533 | 119,826 | 74,997 | 321,356 |
| DHI MORTGAGE COMPANY, LTD. | 5493001SXWZ4OFP8Z903 | HUD | 115,715 | 83,519 | 84,405 | 283,639 |
| CARRINGTON MORTGAGE SERVICES, LLC | 549300R9S3MVDV4MGF56 | HUD | 92,616 | 92,949 | 72,653 | 258,218 |
| NETWORK CAPITAL FUNDING CORPORATION | 549300GQDT484LGI9C04 | HUD | 63,085 | 92,108 | 64,330 | 219,523 |
| TD BANK, NATIONAL ASSOCIATION | 03D0JEWFDFUS0SEEKG89 | CFPB | 75,338 | 66,213 | 74,449 | 216,000 |
| TRIAD FINANCIAL SERVICES, INC. | 549300CB67L6KPJLHE19 | HUD | 51,893 | 66,079 | 80,961 | 198,933 |
| STATE EMPLOYEES' | 549300SHE1JTCOWBP090 | CFPB | 51,542 | 66,038 | 66,121 | 183,701 |
| SPRING EQ, LLC | 549300PIL8LFAQ04XC20 | HUD | 22,059 | 33,925 | 83,704 | 139,688 |
| FIGURE LENDING LLC | 254900UL88QFG0E40516 | HUD | 22,579 | 37,919 | 65,579 | 126,077 |
| Total of quarterly filers | 12,437,787 | 13,473,734 | 7,593,828 | 33,505,349 | ||
| Total of all filers | 25,707,575 | 26,253,190 | 16,090,155 | 68,050,920 |
Top loan servicers in the United States in Q2 of 2023 (via MortgageStats.com):
At the heart of the mortgage market lies the home buyer, and their characteristics can tell us a lot about the housing market. As we round out our review of mortgage and housing statistics, it's seems appropriate that we take a brief look at home buyers in the United States, and how they navigate the mortgage market.
(sources: Surveys by the National Association of Realtors & the National Association of Home Builders)
As is to be expected, the housing market is subject to constant change, reacting as it must to the prevailing economic climate. The statistics we have provided for you here are a virtual snapshot of the US mortgage market as it responds to a strengthening economy and the return of consumer confidence in the American consumer. It should, we hope, provide a deeper insight into the current state of the US housing and mortgage markets.
Here are historical average annual interest rates for popular home loan products.
| Year | 30-YR FRM Rate | 30-YR Points | 15-YR FRM Rate | 15-YR Points | 1-YR ARM Rate | 1-YR Points | 1-YR Margin | 5/1-YR ARM Rate | 5/1-YR Points | 5/1-YR Margin |
|---|---|---|---|---|---|---|---|---|---|---|
| 2025 | 6.60 | 5.78 | ||||||||
| 2024 | 6.72 | 5.96 | ||||||||
| 2023 | 6.81 | 6.11 | ||||||||
| 2022 | 5.34 | 0.81 | 4.58 | 0.84 | 4.09 | 0.29 | 2.75 | |||
| 2021 | 2.96 | 0.68 | 2.27 | 0.64 | 2.61 | 0.29 | 2.75 | |||
| 2020 | 3.10 | 0.73 | 2.59 | 0.69 | 3.07 | 0.30 | 2.75 | |||
| 2019 | 3.94 | 0.5 | 3.39 | 0.5 | 3.14 | 0.3 | 2.75 | |||
| 2018 | 4.54 | 0.5 | 4.00 | 0.5 | 3.82 | 0.3 | 2.76 | |||
| 2017 | 3.99 | 0.5 | 3.27 | 0.5 | 3.20 | 0.4 | 2.74 | |||
| 2016 | 3.65 | 0.5 | 2.93 | 0.5 | 2.87 | 0.5 | 2.74 | |||
| 2015 | 3.85 | 0.6 | 3.09 | 0.6 | 2.53 | 0.3 | 2.74 | 2.94 | 0.5 | 2.74 |
| 2014 | 4.17 | 0.6 | 3.29 | 0.6 | 2.44 | 0.4 | 2.73 | 3.02 | 0.5 | 2.74 |
| 2013 | 3.98 | 0.7 | 3.11 | 0.7 | 2.62 | 0.4 | 2.76 | 2.88 | 0.5 | 2.75 |
| 2012 | 3.66 | 0.7 | 2.93 | 0.7 | 2.69 | 0.5 | 2.76 | 2.78 | 0.6 | 2.74 |
| 2011 | 4.45 | 0.7 | 3.68 | 0.7 | 3.03 | 0.6 | 2.76 | 3.31 | 0.6 | 2.74 |
| 2010 | 4.69 | 0.7 | 4.1 | 0.7 | 3.78 | 0.6 | 2.76 | 3.82 | 0.6 | 2.74 |
| 2009 | 5.04 | 0.7 | 4.57 | 0.7 | 4.7 | 0.6 | 2.75 | 4.75 | 0.6 | 2.74 |
| 2008 | 6.03 | 0.6 | 5.62 | 0.6 | 5.17 | 0.6 | 2.74 | 5.74 | 0.6 | 2.75 |
| 2007 | 6.34 | 0.4 | 6.03 | 0.4 | 5.56 | 0.6 | 2.75 | 6.07 | 0.5 | 2.76 |
| 2006 | 6.41 | 0.5 | 6.07 | 0.5 | 5.54 | 0.7 | 2.76 | 6.08 | 0.6 | 2.77 |
| 2005 | 5.87 | 0.6 | 5.42 | 0.6 | 4.49 | 0.7 | 2.77 | 5.32 | 0.6 | 2.78 |
| 2004 | 5.84 | 0.7 | 5.21 | 0.6 | 3.9 | 0.7 | 2.77 | |||
| 2003 | 5.83 | 0.6 | 5.17 | 0.6 | 3.76 | 0.6 | 2.76 | |||
| 2002 | 6.54 | 0.6 | 5.98 | 0.6 | 4.62 | 0.7 | 2.77 | |||
| 2001 | 6.97 | 0.9 | 6.5 | 0.9 | 5.82 | 0.9 | 2.77 | |||
| 2000 | 8.05 | 1 | 7.72 | 1 | 7.04 | 1 | 2.78 | |||
| 1999 | 7.44 | 1 | 7.06 | 1 | 5.99 | 1.1 | 2.79 | |||
| 1998 | 6.94 | 1.1 | 6.59 | 1.1 | 5.58 | 1.1 | 2.79 | |||
| 1997 | 7.6 | 1.7 | 7.13 | 1.7 | 5.61 | 1.4 | 2.79 | |||
| 1996 | 7.81 | 1.7 | 7.32 | 1.7 | 5.67 | 1.4 | 2.79 | |||
| 1995 | 7.93 | 1.8 | 7.48 | 1.8 | 6.06 | 1.5 | 2.8 | |||
| 1994 | 8.38 | 1.8 | 7.86 | 1.8 | 5.36 | 1.5 | 2.79 | |||
| 1993 | 7.31 | 1.6 | 6.83 | 1.6 | 4.58 | 1.5 | 2.77 | |||
| 1992 | 8.39 | 1.7 | 7.96 | 1.7 | 5.62 | 1.7 | 2.76 | |||
| 1991 | 9.25 | 2 | 7.09 | 1.9 | 2.77 | |||||
| 1990 | 10.13 | 2.1 | 8.36 | 2.1 | 2.77 | |||||
| 1989 | 10.32 | 2.1 | 8.8 | 2.3 | 2.77 | |||||
| 1988 | 10.34 | 2.1 | 7.9 | 2.3 | 2.75 | |||||
| 1987 | 10.21 | 2.2 | 7.83 | 2.2 | ||||||
| 1986 | 10.19 | 2.2 | 8.43 | 2.3 | ||||||
| 1985 | 12.43 | 2.5 | 10.05 | 2.5 | ||||||
| 1984 | 13.88 | 2.5 | 11.51 | 2.5 | ||||||
| 1983 | 13.24 | 2.1 | ||||||||
| 1982 | 16.04 | 2.2 | ||||||||
| 1981 | 16.63 | 2.1 | ||||||||
| 1980 | 13.74 | 1.8 | ||||||||
| 1979 | 11.2 | 1.6 | ||||||||
| 1978 | 9.64 | 1.3 | ||||||||
| 1977 | 8.85 | 1.1 | ||||||||
| 1976 | 8.87 | 1.1 | ||||||||
| 1975 | 9.05 | 1.1 | ||||||||
| 1974 | 9.19 | 1.2 | ||||||||
| 1973 | 8.04 | 1 | ||||||||
| 1972 | 7.38 | 0.9 |
Source: Freddie Mac PMMS
On November 25, 2025 the Federal Housing Finance Agency (FHFA) raised the 2025 conforming loan limit on single family homes from $806,500 to $832,750 - an increase of $26,250, or 3.26%. That rate is the baseline limit for areas of the country where homes are fairly affordable. In higher-cost areas like San Francisco or New York City the single-family home loan limit can go as high as $1,249,125.
Here is an overview of the 2026 limits based on the number of units in a building. Limits in the third row apply to Alaska, Guam, Virgin Islands, Washington D.C & Hawaii.
| Units | 1 | 2 | 3 | 4 |
|---|---|---|---|---|
| Continental U.S. Baseline | $832,750 | $1,066,250 | $1,288,800 | $1,601,750 |
| Designated High-cost Areas | $1,249,125 | $1,599,375 | $1,933,200 | $2,402,625 |
| Alaska, Hawaii, Guam & U.S. Virgin Islands | $1,249,125 | $1,599,375 | $1,933,200 | $2,402,625 |
We also publish historical conforming loan limits going back to 1970.
The Federal Reserve has hinted they are likely to taper their bond buying program later this year. Lock in today's low rates and save on your loan.
Are you paying too much for your mortgage?
Check your refinance options with a trusted El Monte lender.
Answer a few questions below and connect with a lender who can help you refinance and save today!