A complete guide to explore the economic impacts of the housing bubble & the Great Recession.
When the housing bubble was still inflating ARM loans were a popular option because they offered a low upfront payment & many people believed housing prices only go up - home ownership was, after all, the American dream.
| Loan Type | Volume & Value | 2005 | 2006 | 2007 | 2008 | 2009 | 2010 |
|---|---|---|---|---|---|---|---|
| Government | Loan Volume | 9.5% | 4.6% | 3.5% | 2.7% | 1.9% | 4.4% |
| Nonprime | Loan Volume | 52.5% | 42.3% | 12.9% | 3.6% | 0.8% | 1.1% |
| Prime Conforming | Loan Volume | 30.3% | 27.7% | 13.7% | 6.2% | 2.2% | 3.7% |
| Prime Jumbo | Loan Volume | 68.7% | 68.9% | 51.4% | 52.8% | 43.8% | 37.3% |
| Total | Loan Volume | 38.5% | 33.6% | 15.6% | 5.8% | 2.3% | 4.0% |
| Government | Loan Value | 10.1% | 5.2% | 4.0% | 3.1% | 2.3% | 4.9% |
| Nonprime | Loan Value | 59.9% | 49.2% | 19.1% | 6.7% | 3.4% | 2.6% |
| Prime Conforming | Loan Value | 34.4% | 33.1% | 17.0% | 8.3% | 2.7% | 4.8% |
| Prime Jumbo | Loan Value | 70.4% | 70.6% | 55.5% | 58.9% | 51.5% | 43.3% |
| Total | Loan Value | 48.9% | 44.6% | 25.6% | 10.5% | 4.0% | 6.1% |
Sources: Lender Processing Services (LPS); Federal Housing Finance Agency, Monthly Interest Rate Survey (MIRS).
Notes: Government mortgages include those insured by the Federal Housing Administration and the U.S. Department of Veterans Affairs.
| Loan Type | Volume & Value | 2005 | 2006 | 2007 | 2008 | 2009 | 2010 |
|---|---|---|---|---|---|---|---|
| Government | Loan Volume | 8.0% | 3.9% | 3.7% | 2.9% | 1.0% | 2.1% |
| Nonprime | Loan Volume | 60.4% | 47.5% | 12.5% | 3.4% | 0.7% | 0.0% |
| Prime Conforming | Loan Volume | 35.0% | 28.4% | 12.3% | 5.5% | 2.4% | 4.0% |
| Prime Jumbo | Loan Volume | 72.4% | 67.5% | 49.0% | 46.1% | 35.3% | 43.8% |
| Total (LPS) | Loan Volume | 41.8% | 33.4% | 14.1% | 5.0% | 1.8% | 3.2% |
| Total (MIRS) | Loan Volume | 34.0% | 24.1% | 10.7% | 5.5% | 1.8% | 1.8% |
| Government | Loan Value | 8.7% | 4.9% | 4.3% | 3.3% | 1.5% | 2.8% |
| Nonprime | Loan Value | 67.3% | 53.2% | 17.8% | 8.7% | 1.0% | 0.0% |
| Prime Conforming | Loan Value | 39.2% | 33.3% | 15.1% | 7.4% | 3.3% | 4.7% |
| Prime Jumbo | Loan Value | 73.7% | 68.5% | 53.0% | 52.5% | 44.5% | 43.6% |
| Total (LPS) | Loan Value | 52.3% | 43.3% | 23.3% | 9.0% | 3.8% | 5.5% |
| Total (MIRS) | Loan Value | 38.0% | 28.8% | 15.9% | 9.8% | 3.4% | 1.8% |
It is not just that ARMs made borrowers more sensitve to interest rate shifts, but also that many ARM loans were being made to Alt-A & Subprime borrowers who were unlikely to be able to repay them. Most subprime borrowers preferred short-term hybrid ARM loans.
From 2003 to the housing bubble peak nearly 10 million subprime and Alt-A loans were made.
| Collateteral Type | Subprime | Alt-A | Combined |
|---|---|---|---|
| 2003 | 1,081,629 | 303,969 | 1,385,598 |
| 2004 | 1,669,594 | 712,056 | 2,381,650 |
| 2005 | 1,921,637 | 1,093,797 | 3,015,434 |
| 2006 | 1,445,425 | 921,212 | 2,366,637 |
| 2007 (Jan - June) | 233,725 | 279,114 | 512,839 |
| All | 6,352,010 | 3,310,148 | 9,662,158 |
Source: Federal Reserve Board calculations based on data from First American LoanPerformance.
Note: Sample restricted to thirty-year, first-lien mortgages originated on one- to four-family properties in the contiguous United States.
| Collateral type | Loan type | 2003 | 2004 | 2005 | 2006 | 2007 (Jan-June) | All |
|---|---|---|---|---|---|---|---|
| Subprime | Fixed rate | 30% | 21% | 17% | 20% | 27% | 21% |
| Subprime | Floating rate | 0% | 0% | 0% | 0% | 0% | 0% |
| Subprime | Short-term hybrid | 68% | 77% | 81% | 77% | 68% | 76% |
| Subprime | Long-term hybrid | 1% | 1% | 2% | 3% | 4% | 2% |
| Alt-A | Fixed rate | 69% | 36% | 39% | 39% | 42% | 41% |
| Alt-A | Floating rate | 5% | 20% | 26% | 23% | 12% | 21% |
| Alt-A | Short-term hybrid | 11% | 23% | 12% | 6% | 1% | 12% |
| Alt-A | Long-term hybrid | 16% | 21% | 23% | 32% | 45% | 26% |
| Collateral Type | Loan Purpose | 2003 | 2004 | 2005 | 2006 | 2007 (Jan-June) | All |
|---|---|---|---|---|---|---|---|
| Subprime | Purchase | 90% | 95% | 100% | 100% | 100% | 95% |
| Subprime | Refinance | 80% | 80% | 80% | 80% | 80% | 80% |
| Alt-A | Purchase | 90% | 90% | 90% | 95% | 95% | 90% |
| Alt-A | Refinance | 74% | 75% | 75% | 79% | 79% | 76% |
| Collateral Type | 2003 | 2004 | 2005 | 2006 | 2007 (Jan-June) | All | |
|---|---|---|---|---|---|---|---|
| Purchase loans | Subprime | 30% | 36% | 40% | 42% | 31% | 37% |
| Piggyback loans | Subprime | 7% | 15% | 24% | 28% | 15% | 19% |
| Median FICO credit score | Subprime | 615 | 615 | 618 | 616 | 613 | 616 |
| Originated on investor property | Subprime | 8% | 8% | 7% | 7% | 8% | 7% |
| With low or no documentation | Subprime | 32% | 34% | 36% | 38% | 34% | 35% |
| With amortization > 30 years | Subprime | 0% | 0% | 4% | 23% | 26% | 7% |
| Requiring interest payments only (in early years of mortgage) | Subprime | 2% | 11% | 21% | 13% | 11% | 13% |
| Allowing negative amortization | Subprime | 0% | 0% | 0% | 0% | 0% | 0% |
| With prepayment penalty | Subprime | 74% | 73% | 72% | 70% | 69% | 72% |
| With prepayment penalty extending beyond ARM teaser period | Subprime | 10% | 8% | 6% | 3% | 2% | 7% |
| Purchase loans | Alt-A | 46% | 54% | 52% | 49% | 37% | 50% |
| Piggyback loans | Alt-A | 12% | 27% | 35% | 42% | 33% | 33% |
| Median FICO credit score | Alt-A | 710 | 706 | 708 | 701 | 707 | 706 |
| Originated on investor property | Alt-A | 27% | 23% | 22% | 21% | 22% | 22% |
| With low or no documentation | Alt-A | 63% | 62% | 69% | 80% | 81% | 71% |
| With amortization > 30 years | Alt-A | 0% | 0% | 0% | 1% | 1% | 0% |
| Requiring interest payments only (in early years of mortgage) | Alt-A | 16% | 37% | 40% | 44% | 52% | 39% |
| Allowing negative amortization | Alt-A | 2% | 16% | 24% | 26% | 30% | 21% |
| With prepayment penalty | Alt-A | 26% | 33% | 39% | 44% | 40% | 38% |
| With prepayment penalty extending beyond ARM teaser period | Alt-A | 12% | 18% | 30% | 32% | 16% | 26% |
| Collateral Type | Loan Type | 2003 | 2004 | 2005 | 2006 | 2007 (Jan-June) | All |
|---|---|---|---|---|---|---|---|
| Subprime | Fixed rate | 7.51% | 7.24% | 7.45% | 8.40% | 8.75% | 7.67% |
| Subprime | Floating rate | 6.79% | 6.50% | 6.60% | 8.36% | 8.09% | 7.22% |
| Subprime | Short-term hybrid | 7.76% | 7.33% | 7.57% | 8.53% | 8.56% | 7.79% |
| Subprime | Long-term hybrid | 6.43% | 6.32% | 6.80% | 7.74% | 7.99% | 7.08% |
| Alt-A | Fixed rate | 6.51% | 6.46% | 6.44% | 7.18% | 6.96% | 6.69% |
| Alt-A | Floating rate | 3.72% | 2.06% | 1.66% | 2.00% | 2.33% | 1.92% |
| Alt-A | Short-term hybrid | 6.00% | 5.77% | 6.50% | 7.31% | 6.79% | 6.26% |
| Alt-A | Long-term hybrid | 5.60% | 5.63% | 6.20% | 6.78% | 5.93% | 6.23% |
| Collateral Type | Fixed Rate | Floating Rate | Long-term Hybrid | Short-term Hybrid | |
|---|---|---|---|---|---|
| Median combined loan-to-value ratio | Subprime | 80% | 90% | 85% | 89.47% |
| Median FICO credit score | Subprime | 627 | 625 | 660 | 612 |
| Median interest rate | Subprime | 7.67% | 7.22% | 7.79% | 7.08% |
| Originated on investor property | Subprime | 9% | 12% | 11% | 7% |
| With prepayment penalty | Subprime | 73% | 57% | 66% | 72% |
| With prepayment penalty extending beyond teaser period | Subprime | 52% | 0% | 6% | |
| Allowing negative amortization | Subprime | 0% | 3% | 0% | 0% |
| With low or no documentation | Subprime | 27% | 45% | 40% | 37% |
| With amortization > 30 years | Subprime | 0% | 8% | 11% | 9% |
| Median combined loan-to-value ratio | Alt-A | 80% | 80% | 84.28% | 90% |
| Median FICO credit score | Alt-A | 708 | 703 | 710 | 694 |
| Median interest rate | Alt-A | 6.69% | 1.92% | 6.26% | 6.23% |
| Originated on investor property | Alt-A | 26% | 17% | 20% | 21% |
| With prepayment penalty | Alt-A | 20% | 74% | 35% | 48% |
| With prepayment penalty extending beyond teaser period | Alt-A | 72% | 0% | 3% | |
| Allowing negative amortization | Alt-A | 0% | 91% | 8% | 0% |
| With low or no documentation | Alt-A | 66% | 80% | 73% | 68% |
| With amortization > 30 years | Alt-A | 0% | 0% | 1% | 1% |
| Collateral Type | Purchase | Refinance | |
|---|---|---|---|
| Median combined loan-to-value ratio | Subprime | 95% | 80% |
| Median FICO credit score | Subprime | 637 | 602 |
| Median initial rate | Subprime | 7.75% | 7.75% |
| Originated on investor property | Subprime | 10% | 6% |
| With prepayment penalty | Subprime | 74% | 71% |
| Allowing negative amortization | Subprime | 0% | 0% |
| With low or no documentation | Subprime | 41% | 32% |
| With amortization > 30 years | Subprime | 9% | 7% |
| Median combined loan-to-value ratio | Alt-A | 90% | 76% |
| Median FICO credit score | Alt-A | 715 | 696 |
| Median initial rate | Alt-A | 5.98% | 5.08% |
| Originated on investor property | Alt-A | 25% | 19% |
| With prepayment penalty | Alt-A | 34% | 42% |
| Allowing negative amortization | Alt-A | 13% | 29% |
| With low or no documentation | Alt-A | 69% | 73% |
| With amortization > 30 years | Alt-A | 0% | 0% |
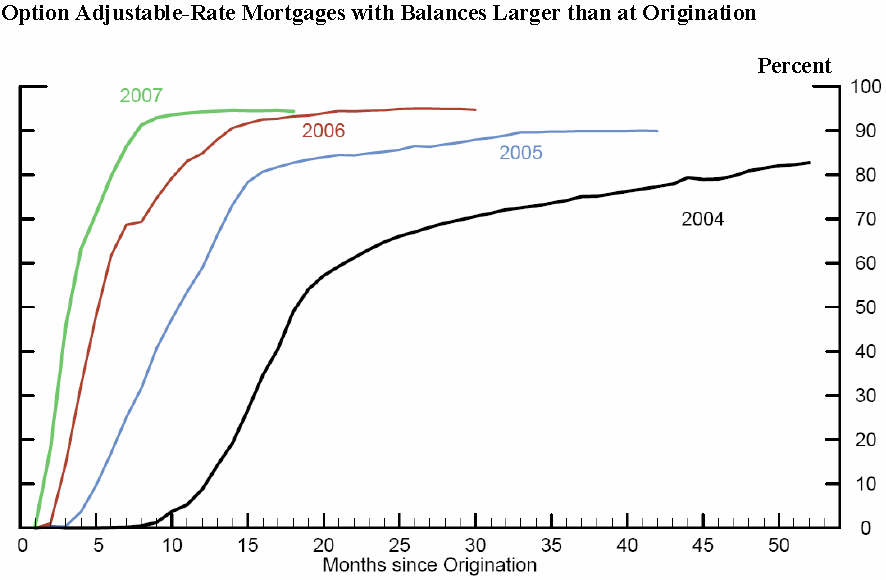
Many people, in fact, were using their homes like piggy banks.
People with Option ARM loans were paying less than the accrued interest & other homeowners repeatedly withdrew equity by refinancing their homes every few years.
Source: The Rise in Mortgage Defaults
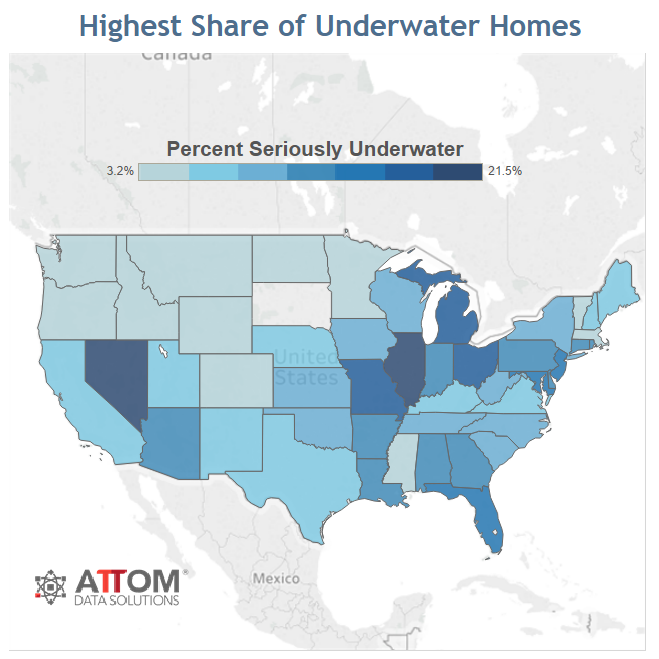
Initially default rates were higher in rustbelt states due to globalization & competition with highly subsidized Chinese products destroying the labor-intensive parts of the domestic manufacturing industry. Later, as the housing bubble grew, the states of California, Florida, Nevada & Arizona became the epicenter of negative equity.
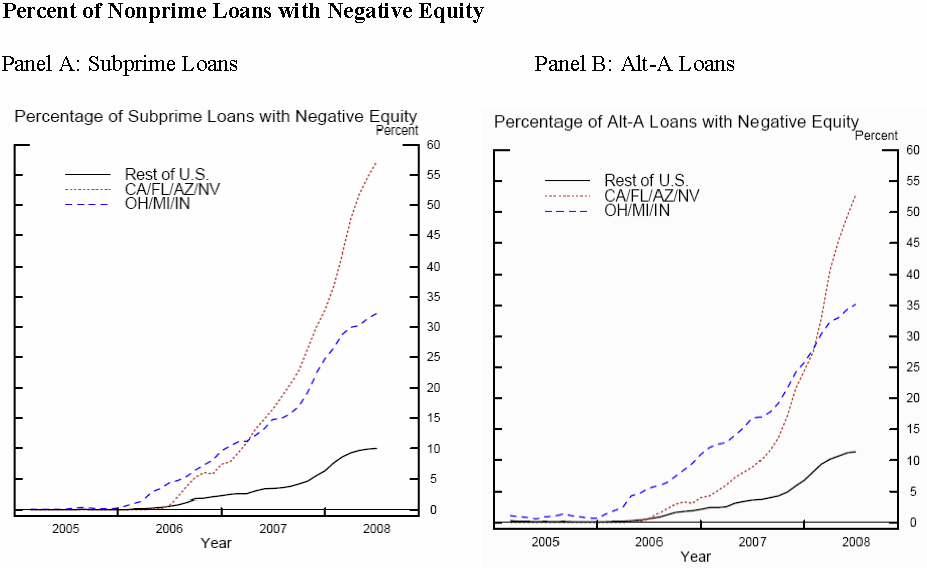
As the bubble grew increasingly marginal borrowers were targeted, which meant default rates rose faster over time.
During the bubble the advertised monthly ARM loan payments frequently excluded many common costs of home ownership including taxes and insurance.
Here is typical window marketing for the time.
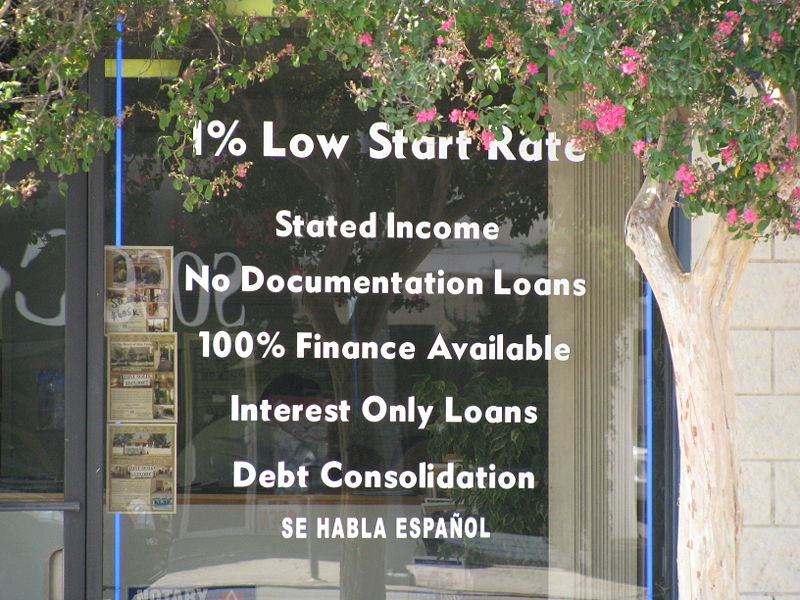
The most widely advertised mortgages catering to marginal borrowers were often the most expensive & most exploitative options. These loans frequently targeted areas with a prevalence of minority, less educated & poor borrowers.
Countrywide was one of the biggest subprime lenders & their CEO's license plate said "fund em." Here is one of their ads.
The following commercial shows how a 3/1 IO styled subprime mortgage might have been marketed during the bubble.
Can you get a $200,000 mortgage for $585 a month? Now you can!
In reality, the cost of such a loan at the then prevailing rate of 7% would have been closer to $1,700 per month if one wanted the loan to amortize in 30 years & included other expenses like property taxes, PMI, homeowner's insurance. And this would presume no closing costs & no major home repairs.
While subprime mortgages made up 14% of the market by 2006, the issue was wider than subprime as the housing bubble coupled with stagnant wages made homes unaffordable in the states & metro areas where home prices appreciated rapidly.
Making things worse, roughly 40% of home purchases in 2006 were not intended as primary residences. In 2006 22% of home purchases across the United States were for investment purposes while 12% were for vacation homes.
Median home prices across the United States increased every year betewen 1991 and 2007. Given that home prices had already doubled between 2000 and 2006 home prices had nowhere to go but down.
Median housing prices fell 5.79% from 2007 to 2008. Throughout the recession some markets fell much further, with key bubble markets like Phoenix & Las Vegas seeing real estate prices crash over 50%.
The belief in homeownership as a cornerstone of the American dream was widespread before the housing crisis, but those who over-extended themselves and got caught up in the bubble were in no rush to get back into the market after going through foreclosure.
Movies like The Big Short & Inside Job accurately portrayed behind-the-scenes actions of financial industry insider, but negative publicity surrounding the housing crisis has many people believing the cause of the crisis was ARM loans to subprime borrowers rather than widespread predatory lending & accounting-control fraud.
Certainly the belief that home prices could not go down was widespread after median home prices went up every year between 1991 and 2007, but however greedy borrowers may have been in buying 2 or 3 homes, it is the job of the banks to ensure the borrowers are qualified. It is - after all - the job of banks to judiciously allocate scarce capital resources effectively across the economy. Private lenders were responsible for over 84% of subprime loans in 2006.
| Loan Type | Share |
|---|---|
| Prime FRM | 68% |
| Prime ARM | 18% |
| Subprime FRM | 6% |
| Subprime ARM | 8% |
| FHA | 7% |
| VA | 3% |
* Percentages of prime & subprime markets only, exclusive of FHA & VA loans.
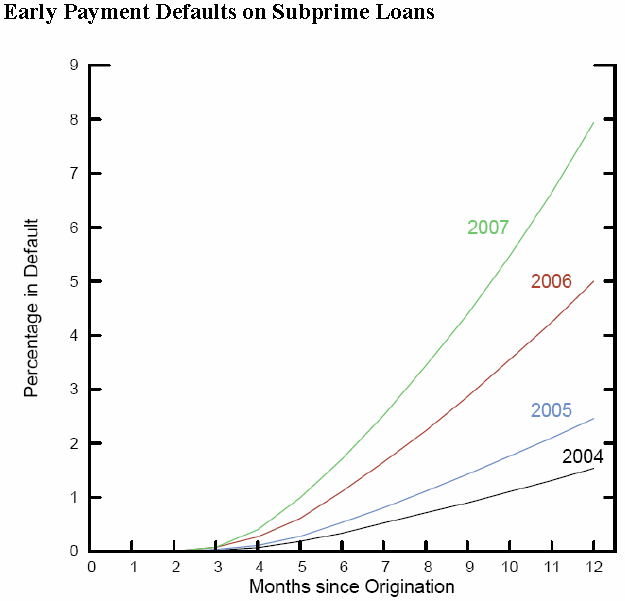
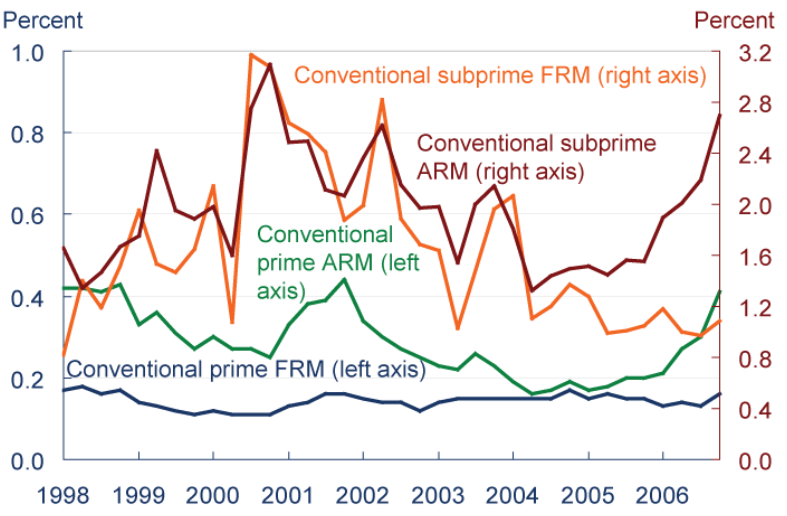
In 2006 & 2007 many subprime borrowers fell behind on their loans.
Sources: Mortgage Bankers Association, Federal Reserve Bank of Cleveland
As home price appreciation stopped & interest rates rose, many subprime borrowers & buyers who used ARM loans had little to no equity in their homes, which gave them greater incentive to default on their mortgage.
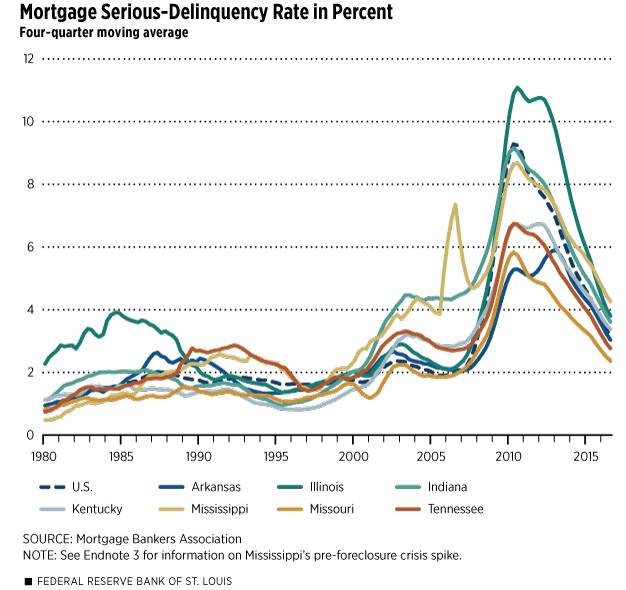
Source: Mortgage Bankers Association
It is hard to express the emotional damage done during the housing crisis with numbers alone.
Between 2007 and early 2010 8.8 million jobs were lost, driving the rate of unemployment near the early 1980s peak.
Worse yet, 94% of net job gains over the past decade - nearly all of the 10,000,000 new jobs - are low-paying service jobs & part-time gig economy work. People who lost their jobs during the recession and were employed were paid an average of 17.5% less per hour.
Globally 201 million people are unemployed & the global job gap has increased by 67 million people since the beginning of the Great Recession.
In the 17-month bear market which lasted from October 9, 2007 to March 9, 2009 the S&P 500 lost approximately half of its value.
| Date | Nasdaq | S&P 500 | Dow Jones |
|---|---|---|---|
| October 9, 2007 | 2,803.91 | 1,565.15 | 14,164.53 |
| March 9, 2009 | 1,268.64 | 676.53 | 6,507.04 |
| Level Change | −1,542.97 | −888.62 | −7,657.49 |
| % Change | −54.9% | −56.8% | −54.1% |
Median household wealth across the United States fell by 36% from $87,992 in 2003 to $56,335 in 2013.
Between January of 2007 and December of 2011 there were more than four million completed foreclosures & over 8.2 million foreclosure starts. Over 3.4% of homes nationwide were in the foreclosure process. This rate vastly exceeds the rate of foreclosures during the Great Depression & serious-delinquency rates remained elevated for a decade.
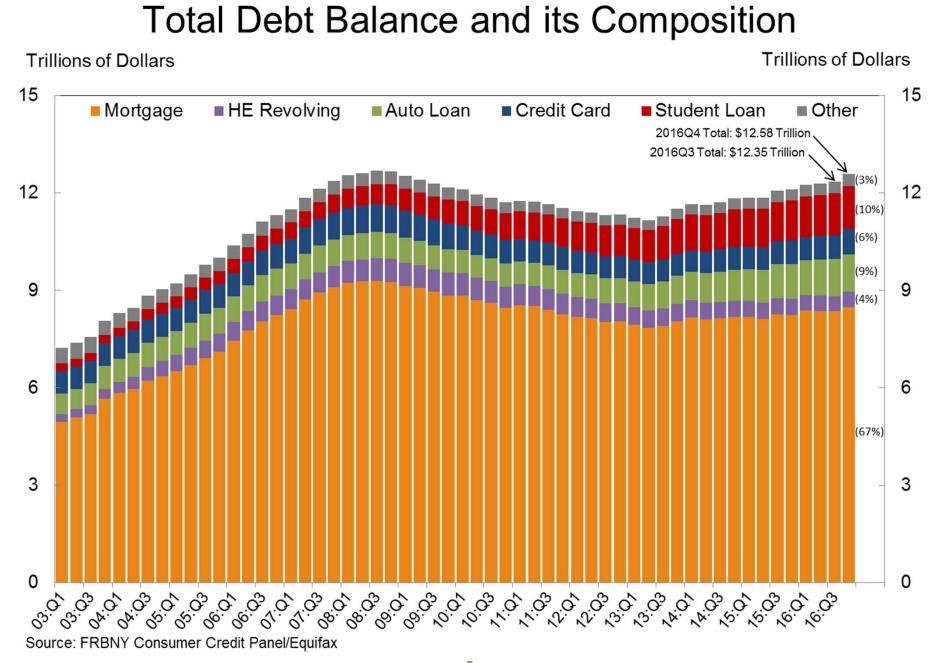
The economic recovery has been fueled by activist central banks which have printed over 13 trillion dollars to purchase bonds to drive up asset values. Strong asset price inflation without strong wage inflation has led to record wealth & income inequality. Most Americans do not have enough savings to cover an unplanned $500 expense.
Debt levels remain elevated.

The recent housing bubble stands apart from other real estate bubbles—any type of bubble in recorded history, actually-- for a couple of reasons. Good or bad we have yet to see. In retrospect, it certainly possesses characteristics that depart from other historic real estate bubbles: firstly, that once the market began its frenzied upshot, that it continued into stratosphere uncharted before in the economic world. Why the difference? And for all the money and energy invested, and the pain of loss, in the venture did we gain anything remarkable?
Remarkable-ness can be a key characteristic of bubbles. While they are often laid out linearly on economic graphs they must also be examined in light of their other aspects—the tangibles we are left with once the financial dust has settled, most of which are the fruits of hyper-invention and hyper-creative spurts.
Up until now each bubble, real estate or otherwise, has accelerated on the fuel of creative invention and by exploiting a blank new canvas:

Let’s take a look for a moment backward at a notable historic bubble, one that many consider frivolous: the Dutch Tulip Bubble of the 1630s. If we want to talk about the value of a bubble we only need to consider that this event has become one of the most mentioned episodes in history whenever Bubble-talk boils up. For many of us, the 1600s are like ancient history. But this particular historic moment has earned a certain level of remarkable-ness: the time in history when tulip bulbs were spun speculatively, as if from straw into gold, they were overnight wealth assets. Certain trophy varieties sold for zany prices and when money was not available, they were traded for carriage loads of commodities that added up to thousands of dollars by today’s standards (1).
Characteristic of bubbles, too, the bottom fell out—1637—once the imaginary value of a tulip bulb could no longer sustain itself and unwitting investors all scrambled to cash in.
The Tulip Bubble laid the groundwork both economically and creatively for the entire modern floral industry—it moved from an imagined idea—a blank canvas--a lark maybe when first thought (Don Quixote’s windmills), to something grounded in reality and viable in the long-term.
What this flower folly left us with is a booming, commoditized floral industry that now spans the globe. The tulip industry in Holland pulls in over $2.5 billion in revenue annually (2). And tulips are just a slice of the larger floral industry’s pie chart.
By far the most innovative and creative real estate bubble was the Dotcom Bubble of the late 1990s. Most of us know the nitty-gritty of the economics. But how do we explain this as a real estate bubble as well as a tech bubble?
Take just a few of the linguistic forms we use to describe the online world:

Each of these terms is designed to bring an incomprehensible dimension in space down to terms we can understand, spatial terms, which are logically associated with property and real estate. Beginning in the late 80s and spanning the 90s, here for the first time was a totally unexplored space that could be bought, sold, built upon without boundaries and it could be had cheaply: “Online acreage, cheap!” But it required an infrastructure to flesh it out; cable, routers, switches and servers, software, hardware, programming languages, and business applications and a way to look at it so it synthesized with our modern world. Like other unexplored and undeveloped tracts of real estate the cyber world promised riches. Advertising masterminds and marketers talked of wealth building in new terms. The CAN’T LOSE message became a viral siren’s song.
When the dust cleared in 2000, it was obvious that many promising dotcoms were leveled, gone. The physical real estate in Silicon Valley tanked. Paper rich upstarts had not only forged ahead online, but they also sank “virtual” millions into brick-and-mortar campuses where corps of geeks worked and played with seemingly endless job perks.
Financial loss aside, the Dotcom Bubble was absolutely most remarkable for its hyper-invention and hyper-creativity:
Amazon alone boasts revenue of $5.7 billion (5) if that’s any indication of the kind of financial fruit currently harvested from the Internet. Thanks go to the foundation laid during the 90s creative boom.
Online, the World Wide Web was one of the most uncharted and peculiar blank canvases Humankind had ever seen. It was like a second stage in outer space exploration and anyone with a dial-up Internet connection had her very own rocket ship.
Sometime around 1717, John Law ended up in Paris pitching the French government on the virtues of credit and paper money. This, after he was ousted from his Scottish homeland for murder, no less. Law had been raised in a banking family, but he was largely regarded as more of a rake and swindler (6) than a reputable banker. Just a few decades earlier French explorers had successfully landed in the southern area of Louisiana, specifically where the Mississippi River meets Gulf Coast. They immediately established a French colony there as well as in other areas of Louisiana and strove to make certain that control either lay in the hands of the French government or was contracted out to profiteering French trade companies, such as the Mississippi Company (7).
Back in France, Law was absolutely convinced that the only successful trade business was driven by credit and lots of it. His business pitch to French government officials could have gone something like this:
“It’s all about credit these days, trust me on this. Credit creates trade. Here’s a deal: give me control of a new bank; I’ll spearhead a new system based on credit—coin is so last century. We’ll buy outright the Mississippi Company, and get rich as the sole trade-runners in the French colony in Louisiana. We’ll offer up shares that investors may buy, which will instantly be worth exponentially more than what they paid. If we play our cards right we can dominate an entire stretch—acres and acres-- along the Mississippi River in America. This is a can’t lose deal. My sources tell me the area is brimming over with gold and silver mines and tobacco farms as far as the eye can see. Sky’s the limit on property value.”
This is a sarcastic rendering of a much more complex unraveling, but suffice it say Law was initially successful with introducing Frenchmen to credit. Paper shares exploded in value and his plan actually worked for a few years. Until such a point that investors wanted to actually extract their shares’ cash value—which had it been real would have made instant tycoons of them all. Law’s bank didn’t have the cash to pay up and much like what happened here in the run on the bank in1929, panic overtook every investor that heard the news (8).
In the end: financial lives ruined, deals lost, Law died poor, but famous for the IDEA and the motivation he inspired.
Thanks to Law’s lofty imagination and charisma he was a key contributor in the growth of French colonization and trade in Louisiana, a large area of which came to be modern day New Orleans.

The 1800s were jammed with innovation and invention in business and industry. The light bulb and telephone/telegraph (which spawned its own mini-bubble) would completely change how people lived. And the first Transcontinental Railroad was celebrated. Squeaking across the country by horse-drawn wagon was no longer a necessary punishment for travelers moving from point A to B. Transportation became uppermost as bigger bites of undeveloped territory were consumed into the States, including the area of the Louisiana Purchase and the Alaska Territory.
But the completion of the Transcontinental Railroad lit a fuse that fueled wild speculation among upstart railway companies which led, of course, to a track laying frenzy in the latter half of the century. Enterprising investors imagined the railroad development a sure bet. It was a “field of dreams,” the if-you-build-it-they-will-come idea. And what better way to make use of steel—one of the era’s biggest innovations (9) -- than stitch it like a quilt across the country? Rail commodities could be transported in bulk and quickly—cheaper transport, bigger profit. The tycoon vision painted by entrepreneurs sparked endorphin highs in investors everywhere and quickened stock values. When it came time to transport those goods, competition among companies killed any value the stock originally held. Twenty-five percent of the companies with railroad interests crumbled (10) in concert with a punishing strike, the Railway Strike of 1894.
What’s interesting is that 50 years prior to the U.S. Railroad Bubble, Britain wrestled with its own railway bubble. The characteristics and outcome could have easily promised the same here. Fortunately for Americans no one paid attention to the Britain bubble.
The railroad bubble allowed for euphoric invention, which ultimately made possible our modern manufacturing methods and goods transport. Tangential industries critical to our modern world were born particularly the industrialized food industry and travel.
The railroad industry earns $50 billion dollars annually spread across 350 companies (11). Right now the industry is riding a resurgence in popularity. Trains are a cheaper alternative to fuel-guzzling vehicles and a “green” investment to which many savvy investors have their sights glued (12).
It was the Roaring Twenties. Down in Florida, imaginative business entrepreneurs were busy with visions of a tropical vacationland swimming in their heads, which demanded they unravel the logistics necessary to convert buggy swampland into a getaway for wealthy northerners. The transportation problem had already been solved:
Now how to get people to buy-in on this amazing new venture; this once in a lifetime opportunity….
Developers went on an advertising and marketing spree especially with Miami. Here was a gleaming city already parceled out for skyscrapers and modern architecture. Prices were going through the roof. It was widely believed that this was a diamond in the rough, an investment to end all investments. How could anyone lose? Land was cheap, the climate that of a tropical island: the property values and the return on investment would be out of this world—make instant tycoons of everyone willing to drop a buck or two.
The marketing message hawked around the country appealed to real estate investors, vacationers and middle class Americans looking to relocate to someplace sunny, affordable, and perpetually warm.
People did come and they did invest—fortunes were made in Miami. In 1920 the city had less than 1,000 people living in its boundaries. By 1925 the population had exploded by almost 450%! (13)
Carl G. Fisher, a businessman and real estate investor from Michigan had great hopes for Miami and was one of the most influential leaders in the Florida Bubble craze. Fisher Island, bastion of fame and fortune in the middle of Miami, was named in honor of him (14)
What no one in the Florida real estate venture could foresee was what damage a major hurricane could do. On September 18, 1926, at the height of the Florida real estate bubble, one of the worst hurricanes in U.S. history hit shiny new and booming Miami head-on. Remember, in the 20s no modern weather tracking existed nor did building codes designed to make structures more impervious to hurricanes. The only information and forewarning residents would get would be increasing winds and driving rain and maybe a few hair-raising reports from fishermen rushing in off the ocean ahead of the storm. Many residents and vacationers managed to pack up and get out of town, but hundreds died there. Low-ball estimates put the number killed at 350, while high-ball estimates insist it was closer to 800 (15) Miami was for all intents and purposes destroyed. Anyone with an investment bailed but not after they lost fortunes. Elsewhere in Florida real estate investors took what they had left and ran back north, as well. If Miami had had any chance of recovery it was smacked down three years later with the Stock Market Crash and subsequent Great Depression.
The remarkable-ness of the Florida Real Estate Bubble was the vision and confidence that were poured into the time frame. A decade or so later developers were back at building up Miami (many of the great Art Deco hotels went up in the 30s and 40s), but property values did not recover until the 50s (16).
Innovative real estate development and creative advertising strategies were key components in turning Florida into one of the world’s most popular vacation destinations. The annual revenue take from state’s tourism today is $57 billion.
Remarkable-ness is the lasting feature of most bubbles, the innovations, creativity and growth they fueled in a previously uncharted territory. With this most recent U.S. property bubble where do we begin to look for the crowning achievement, the creative invention?
In the late 90s the initial asset market escalation associated with a traditional property bubble took shape in the U.S. market. What is clear and unique about the U.S. real estate bubble was its departure from the economic “rule” of past real estate booms: namely that the price of real estate does not veer far from the track followed by income (17), for obvious reasons. However, in the late 90s the upward track of the price of property did, in fact, take the high road in contrast to income’s low road. This explanation? A rapidly growing lending industry built on subprime mortgages and massive financial deregulation. These financial tools were relatively unknown to a wide audience prior to this and once discovered, allowed for the widespread and unchecked manipulation of “buying power.”
Mortgage brokers and real estate lenders had one simple question to answer: “How do we get our clients into homes even though they can’t afford them or are credit-disabled, because the investment value is just too good right now to miss?” In the short-term, interest only loans, option-ARMs, no money down, and other slipshod lending tools were leveraged with one goal only: shoehorn cash-poor and credit-challenged buyers into homes otherwise unquestionably beyond their buying power. Each little success bred exponentially more successes. In fact at the peak of real estate endorphin-highs this jet-set of “innovative” mortgages was called “exotic.” Sounded like a great vacation spot, a product most Americans would certainly want to get their hands on, right? Consumer buying power, dreams of home ownership, and equity beyond one’s wildest dreams flew higher and further from realistic solid ground. Everywhere you turned was another new world Icarus on some surreal madman’s fly-by past the boiling hot Sun.
What conditions made it possible to suddenly invent these new mortgage products? Because prior to the 1980s subprime mortgages were illegal.
Two critical laws laid the groundwork:
Ironically, the FDIC lists this latter Act among “Miscellaneous Statutes and Regulations” as if it were merely an incidental. The real intent behind the Act was simply to offer more freedom to homebuyers, and homeownership was a popular political rhetoric during the last two decades of the 20th century. In the short-term subprime mortgages were relatively unnecessary and in comparison with prime mortgages, few were used. But, when interest rates were hiked considerably in 1994 and threatened to put many credit-crunched homebuyers out of contention, the Act gave all lenders a great flexibility to innovate with rates and terms. What finally grew from these seeds was a mix-and-match business with as much potential for evil as for good.
Not until the mid 90s—in step with interest rate hikes-- did we see an upsweep in the subprime mortgage use as lenders innovated to embrace market demands. Secondary mortgage servicers like Fannie Mae and Freddie Mac were in place to ensure the mortgage business could mass manufacture its new exotic assortment of plug-and-play mortgage products (20).
Here is a snapshot of the growth of subprime mortgages:
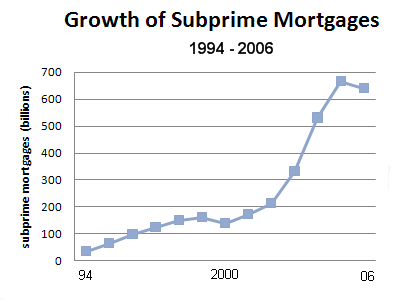
*1 trillion dollars by American standards: in simplest terms if you took 1,000 maverick real estate investors each equal to $1 billion in net worth and assembled them into a large lecture hall, the net worth present in that location would equal $1 trillion ($1,000,000,000,000)--just so we all are on the same conceptual page with the expansiveness of the American real estate market at its precarious zenith…
Right now nearly 3% of all the homes in America are “vacant and up for sale” (23) and 272,181 homes are in some stage of loan default or foreclosure, a figure that’s jumped by over 55% since mid-summer 2007 (24). We’ve paved no new roads, built no new cities, explored no fresh dimensions in space. HOWEVER, we have proven that American Ingenuity is alive and well. Our claim to fame on this great and glorious smack-down is the debatedly dangerous mortgage tools we wrought--a really impressive economic, political and social collaboration.
In 2002 George Bush preached the "American Dream" of homeownership from the White House.
And when that dream fell apart home ownership rates fell to 50-year lows.
While many believe the housing bubble is behind us, at the end of 2016 many homeowners are still underwater.
In Japan’s case their real estate boom did have the good fortune to produce a strong growth in new commercial development at the same time it pulled the rug from beneath many residential homeowners who lost everything they had. Between 1989 and 1992 residential homeowners suffered a crippling smack-down in heir home values—a 70% drop (25). 
An fortunate outcome was the crack-up of Japan’s completely bastardized, lackadaisical and hands-down crooked financial system. The global financial community got a glimpse into a traditionally impervious system and what they saw were ad-hoc policies, outright fraud, and backroom deals, plus a Ministry of Finance that again and again opted to take a “wait-and-see” (26) stance even as the walls came tumbling down. In 1995 six of Japan’s large credit houses tanked leaving in their wake about $70 billion dollars in bad loans, a figure by the way that is often so contradicted and challenged it simply reinforces how muddied and obsolete the Japanese financial system was across the board (27).
Bubbles are a given. They appear rather regularly throughout history. They are speculation, dreams and high hopes, all of which are part of human nature, always have been, always will be no matter how sophisticated we imagine ourselves as a species.
As much as we dwell on the economic fall-out from bubbles, the real truth is that which we are left with—it’s not monetary, it’s usually amazing tangibles, mash-ups of frenzied compartmentalized periods of ultra-creative, even collaborative, work: cities, digital roadways, software and a world wide web, a system of railways, available commercial and residential homes galore.
We don’t come out of a bubble empty-handed. Each bubble lays the track for even more amazing developments. Even if Bitcoin became a zero it would still leave us with blockchain technology. We really should be full of wide-eyed wonder as we look forward to the next bubble.
1 Focus-Economics & Investopedia
2 The Flower Expert
3 “AOL,” Wikipedia.
4 Michael Arrington, “Amazon: Grid Storage Web Service Launches,” TechCrunch, March 14, 2006.
5 Ibid.
6 John Law
7 Colonial Louisiana
8 John Law and the Mississippi Scheme, Mapforum.
9 History of the Modern Steel Industry, Wikipedia.
10 Daniel Gross, “The Bubbles that Built America,” CNN, May 16, 2007.
11 Industry Overview: Railroads, Hoovers.
12 Michael Sivy, “Why Warren Buffet is Buying Railroads,” CNN, March 2008.
13 Carl G. Fisher, Wikipedia.
14 Ibid.
15 Stuart McIver, “1926 Miami: The Blow that Broke the Boom,” Sun-Sentinel, September 19, 1993,
16 Chris Weber, Daily Wealth, September 15, 2007.
17 “The Crash Course,” Chris Martenson.
18 FDIC
19 Brenda White, “A Short History of Subprime,” Allbusiness, March 1, 2006,
20 Abraham Park, PhD, “Why Did Subprime Loans Become Such a Big Deal?” Graziadio Business Report Blog, May 5, 2008,
21 Souphala Chomsisengphet and Anthony Pennington-Cross, “The Evolution of the Subprime Mortgage Market,” Federal Reserve Bank of St. Louis Review, January/February 2006,
22 Matthew Brown, “Subprime Lending and the Affect to the US Markets,” FMR Analysts, August 2007.
23 “U.S. Vacant Homes Hit New Record,” CBS.com, April 28, 2008.
24 “Foreclosure Activity Increases 8 Percent in July,” RealtyTrac, August 14, 2008.
25 Brian Bremner, “Japan’s Real Crisis,” Business Week, May 18, 1998.
26 Costas Lapavitsas, “Economic Crisis: the New 1929 or the New Japan?” Socialist Review, April 2008.
27 Ulrike Schaede, “The 1995 Financial Crisis in Japan,” working paper, February 1996.
The Federal Reserve has hinted they are likely to taper their bond buying program later this year. Lock in today's low rates and save on your loan.
Are you paying too much for your mortgage?
Check your refinance options with a trusted El Monte lender.
Answer a few questions below and connect with a lender who can help you refinance and save today!